People Soft Performance Test Execution Using JMeter Freeware

 President Joseph W. Hendrickson, LLC. 847 -274 -1417 jwhllc@josephwhendricksonllc. onmicrosoft. com")


 Provide value to Number of threads (users) element")


 Response Time Results Elapsed time : JMeter measures the elapsed time")


 Response Time Results Elapsed time : JMeter measures the elapsed time")


 Response Time Results Elapsed time : JMeter measures the")
– Response Time vs. Threads Results This graph shows how")
– Active Threads Over time Active Threads Over Time is")
 Response Time Results Elapsed time : JMeter measures the elapsed time")


- Slides: 40
People. Soft Performance Test Execution Using JMeter Freeware Session Number 5301 March 27, 2018 – 2: 30 pm – 3: 00 pm
Joseph Hendrickson (Joe) President Joseph W. Hendrickson, LLC. 847 -274 -1417 jwhllc@josephwhendricksonllc. onmicrosoft. com Suresh Katamreddy Vice President Kastech 210 -859 -3259 suresh@kastechssg. com Presented by Joseph W. Hendrickson, LLC. & Kastech
Joseph W. Hendrickson, LLC. – Silver Partner Kastech – Gold Partner Presented by Joseph W. Hendrickson, LLC. & Kastech
Session Agenda • Introduction to People. Soft Performance Testing Tool • People. Soft Performance Testing Tool – Product Overview • Questions
Introduction to People. Soft Performance Testing Tool Presented by Joseph W. Hendrickson, LLC. & Kastech
People. Soft Performance Testing Tool Overview Obtain baseline performance profile for the People. Soft systems Ensure the People. Soft Applications have adequate capacity to support the user loads Confirm web servers, application servers, database server and subsystems are configured for optimal performance Identify on-line stress points or system bottlenecks where application performance degrades to an unacceptable level Validate the available CPU capacity is adequate to meet the transient load during Peak Load periods Provide recommended changes based on Oracle best practice and our experience in providing this type of service. Presented by Joseph W. Hendrickson, LLC. & Kastech
Performance Testing Objectives • Access the Production Readiness o Check the system response time during expected load conditions o Assess system behavior during unexpected load conditions o Check the system scalability o Validate the best configuration settings for optimal performance o Evaluate system behavior during spike user loads o Confirm system stability Improves productivity by providing a powerful toolplatforms for locating, with connecting, and collaborating • Compare two the same software to see which performs better with talent across the entire organization. • Compare performance characteristics of system configurations • Evaluate system against performance criteria • Find throughput level • Discover what parts of the application perform poorly and under what conditions • Find the source of performance problems • Support system tuning Presented by Joseph W. Hendrickson, LLC. & Kastech
Performance Test Drivers & Success Factors Presented by Joseph W. Hendrickson, LLC. & Kastech
Performance Test Sample Transactions Finance & Supply Chain Human Capital • • • New Hire Process Promotions Demotions Standard Hours Changes Leave of Absence changes Transfers Terminations Job Data Inquiry Benefit Changes Life Event Changes Address Changes Personal Data Inquiry e-Pay transactions • View Pay Check • View W 2 • Direct Deposit changes • W 2 Consent • Submit W 4 e-Benefits Transactions • Add Life Events • Updates beneficiaries • View Benefits summary • Name change • Benefit Election review Enter Requisitions Approve Requisition Create PO PO Approval Process Dispatch PO Source Requisitions to PO • Create Voucher • Create Journal e-Procurement • Create Requisition • Punch out process • Approve requisitions e-Supplier • Enter suppliers • Approvals • Updates • Deletes • • • Presented by Joseph W. Hendrickson, LLC. & Kastech Campus Solutions • • • • Add 4 Courses Ad hoc add course Search with 2 criteria Search for specific section Account Inquiry after add classes Drop Class Swap Class Unofficial Transcript Calendar Inquiry Modify Personal Data Lookup teaching schedule Approve Grade Sheet Lookup Class Roster
Performance Testing Metrics & Stats JMeter provides the following distinctive features for monitoring and viewing the metrics & stats. • Thread/Virtual Users Metrics • Response Times Metrics • Results Monitoring • Generating Report Dashboard • Real Time results JMeter comes with a Graphite. Backend. Listener. Client which sends metrics to a Graphite Backend. This feature provides: Live results Nice graphs for metrics Ability to compare 2 or more load tests Storing monitoring data as long as JMeter results in the same backend JMeter can measure Elapsed Time, Latency, Connect Time and Throughput Presented by Joseph W. Hendrickson, LLC. & Kastech
People. Soft Performance Test Tool Product Overview Presented by Joseph W. Hendrickson, LLC. & Kastech
Architecture Presented by Joseph W. Hendrickson, LLC. & Kastech
JMeter Dashboard Reporting Sample
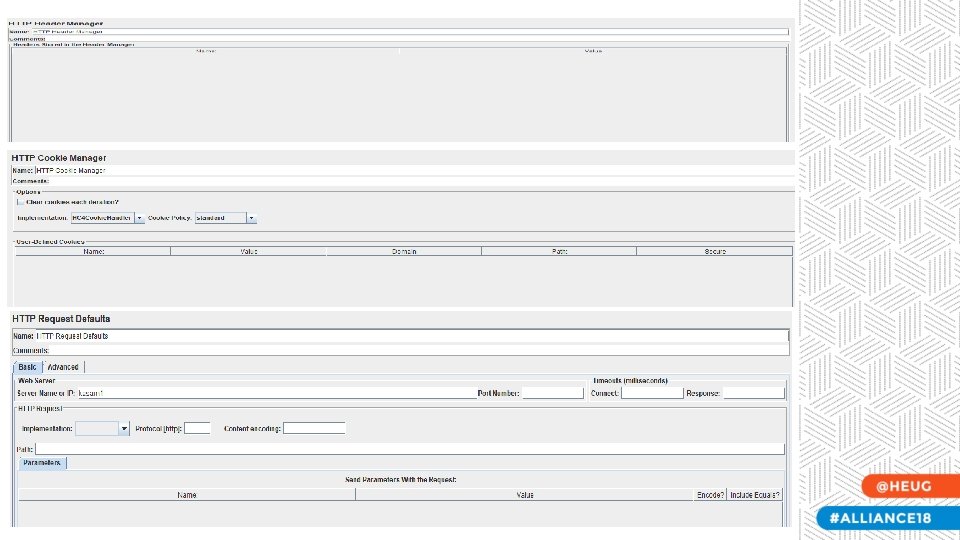
JMeter Environment – Script Recording
JMeter Environment -. Jmx Project
Create Thread Group(nothing but a project) Provide value to Number of threads (users) element based on requirement of load test. For example, If you set the number of threads as 100; JMeter will create and simulate 100 user requests to the server under test. Ramp-Up period is interval between each user.
CS Load Test All the tests are done through i. HUB portal except Highpoint One student action is done through highpoint (mobile) – Class Search. 3 Categories – Faculty, Staff and Student Self Service Most of the failures are connection time out as response time is very high from server In case of Self Service • Beyond 1500 user loads results into App server crash • Beyond 1000 user load leads to more failures • In case of Faculty & Staff • Beyond 1000 user loads results into App server crash • Beyond 750 user load leads to more failures • • • The number against each process is percentage of failures during load test. • Blank means there are no failures
HCM Load Test All the tests are done through i. HUB portal HCM Load test are done for Managed and Self service processes Managed – 300& 500 user load Self Service – 500, 1000 & 1500 Not tested beyond 1500 as we experienced the server crash Following table is for Self Service process results. The results are shown in failure percentage. • Most of the failures are because of connection time out issue. • • The number against each process is percentage of failures during load test. • Not Executed : Might lead to system unavailability
i. HUB Portal Load Test • • All the tests are done through i. HUB portal i. HUB login load tests are executed for 500, 1000 and 1500 Beyond 1500 will result in App server crash Most of the failures are because of connection time out issue. • The number against each process is percentage of failures during load test. • Not Executed : Might lead to system unavailability
FSCM Load Test • • • All the tests are done through i. HUB portal Two cycles of Load testing First one with 300 and second cycle is with 500 users with ramp up period 0. 05 seconds. No Significant performance issues during FSCM load testing. Needs an attention for Dispatch PO process as this involves Run Control/System process. • The number against each process is percentage of failures during load test. • Not Executed : Might lead to system unavailability
Ad-Hoc Scenarios Intention of this scenario is to do more stress testing and see how application behaves when multiple process with 500 user load hits the i. HUB portal This test was simulated from 3 different desk tops using load testing tool 1 st Desk top : Run the i. HUB-FSCM login script with load of 500 user (0. 05 Seconds ramp up) 2 nd Desk top : Run the View Paycheck script with load of 500 user (0. 05 Seconds ramp up) 3 rd Desk top : Run the View Tuition calculation script with load of 500 user (0. 05 Seconds ramp up) All above 3 scripts are kicked at the same time and system could not take the load. As per results analysis the failure percentage is 60% on average. Which means of we load total of 1500 users at same time then system cannot handle the load and 60% of user will get connection time out errors. I have listed few graphs around these load test and these can self explained as mentioned in previous slides. * When tested the same above listed scenario with load of 1000 users and there was 100% failure rate Presented by Joseph W. Hendrickson, LLC. & Kastech
CS (Tuition Calculation) Response Time Results Elapsed time : JMeter measures the elapsed time from just before sending the request to just after the last response has been received. JMeter does not include the time needed to render the response Presented by Joseph W. Hendrickson, LLC. & Kastech
Tuition Calculation – Response Time vs. Threads Results This graph shows how Response Time changes with amount of parallel threads. Naturally, server takes longer to respond when a lot of users requests it simultaneously. This graph visualizes such dependencies. Average response time in this graph is pretty much over 150 Second and seems like users are timed our when lots of users are queued up over this wait time. Presented by Joseph W. Hendrickson, LLC. & Kastech
Tuition Calculation – Active Threads Over time Active Threads Over Time is a simple listener showing how many active threads are there in each thread group during test run Presented by Joseph W. Hendrickson, LLC. & Kastech
Sample Recommendations Presented by Joseph W. Hendrickson, LLC. & Kastech
Sample Recommendations Presented by Joseph W. Hendrickson, LLC. & Kastech
Questions? Presented by Joseph W. Hendrickson, LLC. & Kastech
People. Soft Performance Test Tool Product Overview – Remaining Sample Results Presented by Joseph W. Hendrickson, LLC. & Kastech
HCM (View Paycheck) Response Time Results Elapsed time : JMeter measures the elapsed time from just before sending the request to just after the last response has been received. JMeter does not include the time needed to render the response, nor does JMeter process any client code, for example Java. Script As seen in graph there more threads/users are queued up over 150 seconds and application did not respond which turned out to be connection time and that’s reason with load of 1500 , we see 30% of failures during the load test . Presented by Joseph W. Hendrickson, LLC. & Kastech
View Paycheck– Response Time vs. Threads Results This graph shows how Response Time changes with amount of parallel threads. Naturally, server takes longer to respond when a lot of users requests it simultaneously. This graph visualizes such dependencies. Average response time in this graph is pretty much over 150 Second and seems like users are timed our when lots of users are queued up over this wait time. Presented by Joseph W. Hendrickson, LLC. & Kastech
View Paycheck– Active Threads Over time Active Threads Over Time is a simple listener showing how many active threads are there in each thread group during test run Presented by Joseph W. Hendrickson, LLC. & Kastech
i. HUB CS (Student Login) Response Time Results Elapsed time : JMeter measures the elapsed time from just before sending the request to just after the last response has been received. JMeter does not include the time needed to render the response, nor does JMeter process any client code, for example Java. Script As seen in graph there more threads/users are queued up over 150 seconds and application did not respond which turned out to be connection time and that’s reason with load of 1500 , we see 30% of failures during the load test . Presented by Joseph W. Hendrickson, LLC. & Kastech
i. HUB CS (Student Login)– Response Time vs. Threads Results This graph shows how Response Time changes with amount of parallel threads. Naturally, server takes longer to respond when a lot of users requests it simultaneously. This graph visualizes such dependencies. Average response time in this graph is pretty much over 150 Second and seems like users are timed our when lots of users are queued up over this wait time. Presented by Joseph W. Hendrickson, LLC. & Kastech
i. HUB CS (Student Login)– Active Threads Over time Active Threads Over Time is a simple listener showing how many active threads are there in each thread group during test run Presented by Joseph W. Hendrickson, LLC. & Kastech
FSCM (Create Supplier) Response Time Results Elapsed time : JMeter measures the elapsed time from just before sending the request to just after the last response has been received. JMeter does not include the time needed to render the response, nor does JMeter process any client code, for example Java. Script In this graph as you can see we see only one thread (PINK) was elevated and all other threads are flat Which mean for this there is consistent response from Application and we didn’t see any issue during this load test. Also observe that the single thread is just over 150 Seconds response time. Presented by Joseph W. Hendrickson, LLC. & Kastech
Create Supplier – Response Time vs. Threads Results This graph shows how Response Time changes with amount of parallel threads. Naturally, server takes longer to respond when a lot of users requests it simultaneously. This graph visualizes such dependencies. Average response time in this graph was pretty much below 150 Second and seems like users are not timed out on average response time. Presented by Joseph W. Hendrickson, LLC. & Kastech
Create Supplier – Active Threads Over time Active Threads Over Time is a simple listener showing how many active threads are there in each thread group during test run Presented by Joseph W. Hendrickson, LLC. & Kastech
Complete your session survey! • Open the HEUG Events App on your phone, tablet, or laptop • Click on this session in your schedule. • Then click the "Resources" button and "Survey“ You will be required to login once with your Eventsential username and password. Presented by Joseph W. Hendrickson, LLC. & Kastech
This presentation and all Alliance 2018 presentations are available for download from the Conference site at www. alliance-conference. com