
Penn Series Funds Inc Flexibly Managed Fund Our
Penn Series Funds, Inc. — Flexibly Managed Fund Our Approach for a Risk-Aware Investment Strategy Copyright 2007. T. Rowe Price. All Rights Reserved. - -
What is the Objective? To achieve equity-like returns over the longer term with substantially lower volatility than the S&P 500. • We pay attention to RISK as well as REWARD. • We are fundamental investors, not market timers. • We have a value orientation. • We favor large and mid-capitalization stocks. • We invest in all parts of a company’s capital structure. • We seek good companies with bad psychology. • We take a long-term view. Copyright 2007. T. Rowe Price. All Rights Reserved. 1
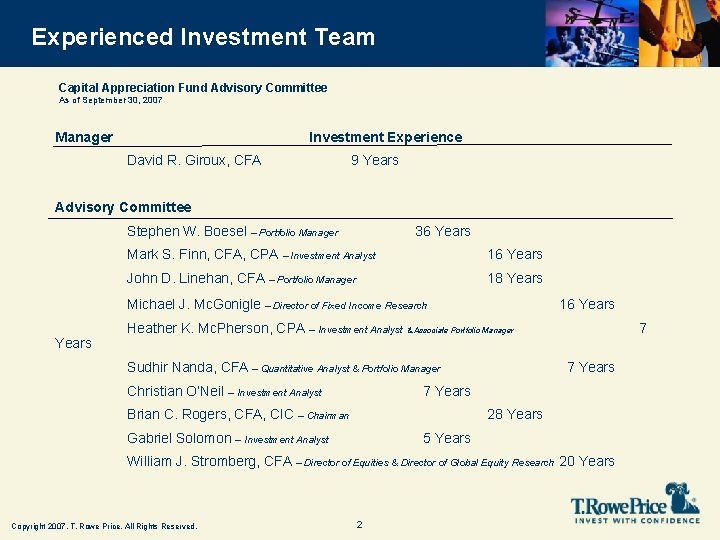
Experienced Investment Team Capital Appreciation Fund Advisory Committee As of September 30, 2007 Manager Investment Experience David R. Giroux, CFA 9 Years Advisory Committee Stephen W. Boesel – Portfolio Manager 36 Years Mark S. Finn, CFA, CPA – Investment Analyst 16 Years John D. Linehan, CFA – Portfolio Manager 18 Years Michael J. Mc. Gonigle – Director of Fixed Income Research Years 16 Years Heather K. Mc. Pherson, CPA – Investment Analyst & Associate Portfolio Manager Sudhir Nanda, CFA – Quantitative Analyst & Portfolio Manager Christian O’Neil – Investment Analyst 7 7 Years Brian C. Rogers, CFA, CIC – Chairman 28 Years Gabriel Solomon – Investment Analyst 5 Years William J. Stromberg, CFA – Director of Equities & Director of Global Equity Research 20 Years Copyright 2007. T. Rowe Price. All Rights Reserved. 2
What is the Investment Process? • Flexible Portfolio Management – Multiple asset classes (Equities, Convertible Securities, Fixed Income, Cash) – Asset allocation • Rigorous Fundamental Research – Over 100 global research professionals – Hundreds of face-to-face company meetings annually • Disciplined Valuation Work – Quantitative overlay complements fundamental work – Proprietary valuation screens – Behavioral finance We focus as much on avoiding losses and estimating the downside as we do on seeking gains and estimating the potential for profit in our holdings. Copyright 2007. T. Rowe Price. All Rights Reserved. 3
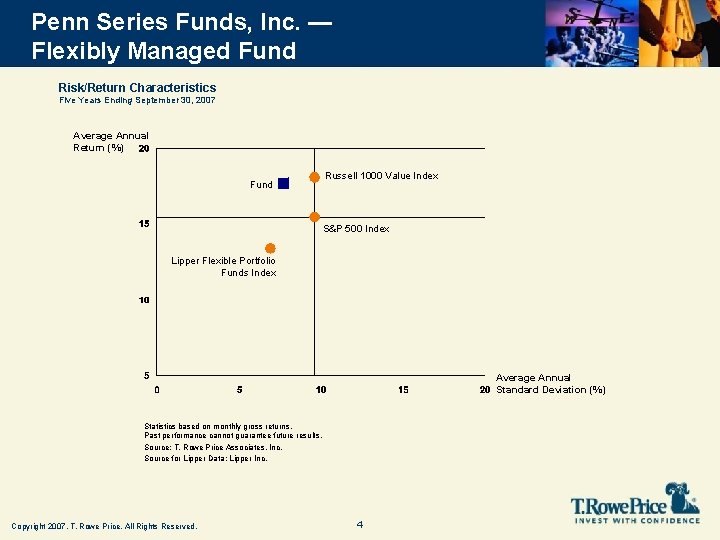
Penn Series Funds, Inc. — Flexibly Managed Fund Risk/Return Characteristics Five Years Ending September 30, 2007 Average Annual Return (%) Fund Russell 1000 Value Index S&P 500 Index Lipper Flexible Portfolio Funds Index Average Annual Standard Deviation (%) Statistics based on monthly gross returns. Past performance cannot guarantee future results. Source: T. Rowe Price Associates, Inc. Source for Lipper Data: Lipper Inc. Copyright 2007. T. Rowe Price. All Rights Reserved. 4
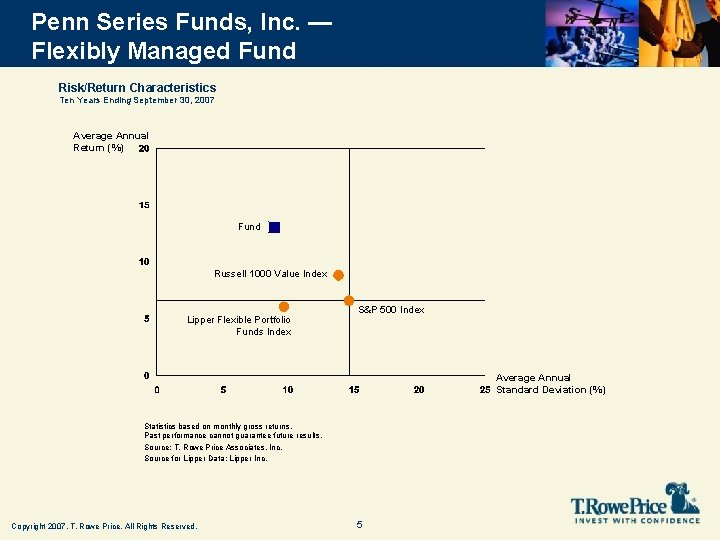
Penn Series Funds, Inc. — Flexibly Managed Fund Risk/Return Characteristics Ten Years Ending September 30, 2007 Average Annual Return (%) Fund Russell 1000 Value Index Lipper Flexible Portfolio Funds Index S&P 500 Index Average Annual Standard Deviation (%) Statistics based on monthly gross returns. Past performance cannot guarantee future results. Source: T. Rowe Price Associates, Inc. Source for Lipper Data: Lipper Inc. Copyright 2007. T. Rowe Price. All Rights Reserved. 5
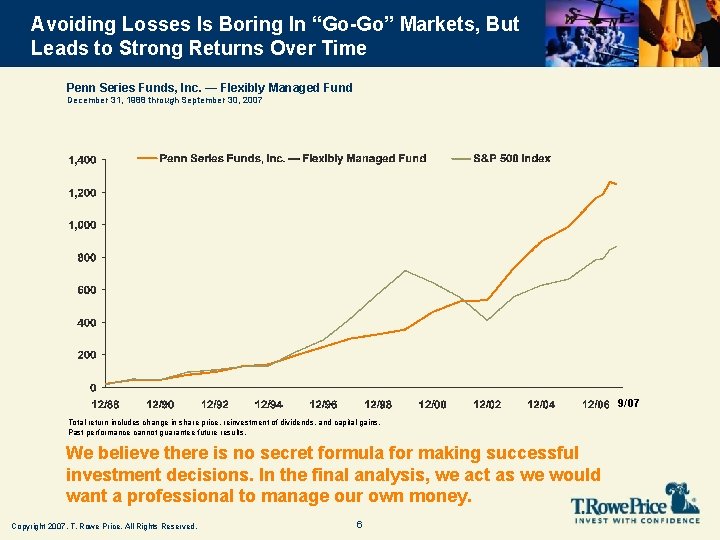
Avoiding Losses Is Boring In “Go-Go” Markets, But Leads to Strong Returns Over Time Penn Series Funds, Inc. — Flexibly Managed Fund December 31, 1988 through September 30, 2007 9/07 Total return includes change in share price, reinvestment of dividends, and capital gains. Past performance cannot guarantee future results. We believe there is no secret formula for making successful investment decisions. In the final analysis, we act as we would want a professional to manage our own money. Copyright 2007. T. Rowe Price. All Rights Reserved. 6
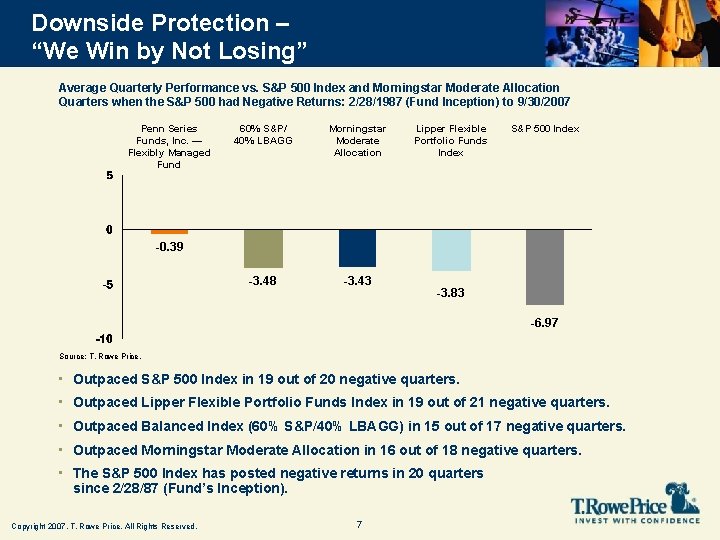
Downside Protection – “We Win by Not Losing” Average Quarterly Performance vs. S&P 500 Index and Morningstar Moderate Allocation Quarters when the S&P 500 had Negative Returns: 2/28/1987 (Fund Inception) to 9/30/2007 Penn Series Funds, Inc. — Flexibly Managed Fund 60% S&P/ 40% LBAGG Morningstar Moderate Allocation -3. 48 -3. 43 Lipper Flexible Portfolio Funds Index S&P 500 Index -0. 39 -3. 83 -6. 97 Source: T. Rowe Price. • Outpaced S&P 500 Index in 19 out of 20 negative quarters. • Outpaced Lipper Flexible Portfolio Funds Index in 19 out of 21 negative quarters. • Outpaced Balanced Index (60% S&P/40% LBAGG) in 15 out of 17 negative quarters. • Outpaced Morningstar Moderate Allocation in 16 out of 18 negative quarters. • The S&P 500 Index has posted negative returns in 20 quarters since 2/28/87 (Fund’s Inception). Copyright 2007. T. Rowe Price. All Rights Reserved. 7
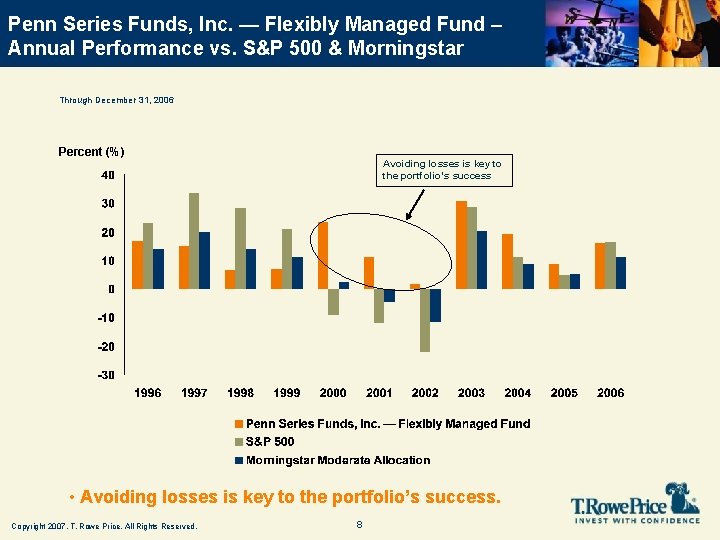
Penn Series Funds, Inc. — Flexibly Managed Fund – Annual Performance vs. S&P 500 & Morningstar Through December 31, 2006 Percent (%) Avoiding losses is key to the portfolio’s success • Avoiding losses is key to the portfolio’s success. Copyright 2007. T. Rowe Price. All Rights Reserved. 8
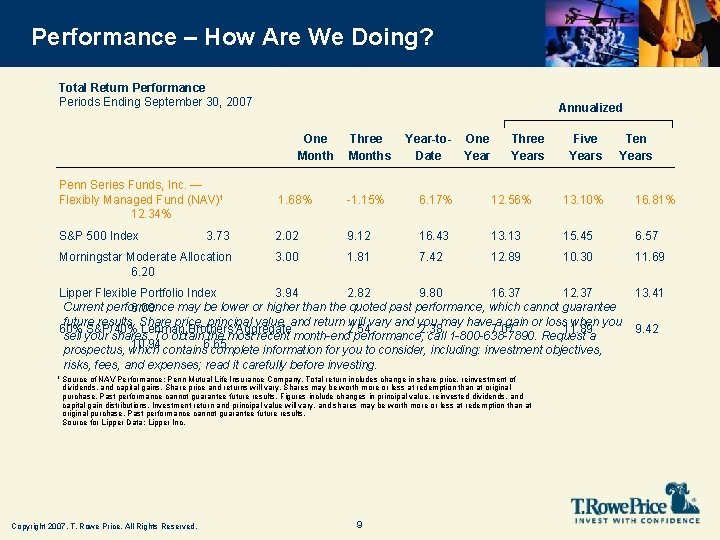
Performance – How Are We Doing? Total Return Performance Periods Ending September 30, 2007 Annualized One Month Three Months Year-to. Date One Year Three Years Five Years Ten Years Penn Series Funds, Inc. — Flexibly Managed Fund (NAV)1 12. 34% 1. 68% -1. 15% 6. 17% 12. 56% 13. 10% 16. 81% S&P 500 Index 3. 73 2. 02 9. 12 16. 43 13. 13 15. 45 6. 57 Morningstar Moderate Allocation 6. 20 3. 00 1. 81 7. 42 12. 89 10. 30 11. 69 Lipper Flexible Portfolio Index 3. 94 2. 82 9. 80 16. 37 12. 37 Current performance may be lower or higher than the quoted past performance, which cannot guarantee 6. 08 future results. Share price, principal value, and return will vary and you may have a gain or loss when you 60% S&P/40% Lehman Brothers Aggregate 2. 54 2. 38 7. 07 11. 89 sell your shares. To obtain the most recent month-end performance, call 1 -800 -638 -7890. Request a 10. 94 6. 65 prospectus, which contains complete information for you to consider, including: investment objectives, risks, fees, and expenses; read it carefully before investing. 1 Source of NAV Performance: Penn Mutual Life Insurance Company. Total return includes change in share price, reinvestment of dividends, and capital gains. Share price and returns will vary. Shares may be worth more or less at redemption than at original purchase. Past performance cannot guarantee future results. Figures include changes in principal value, reinvested dividends, and capital gain distributions. Investment return and principal value will vary, and shares may be worth more or less at redemption than at original purchase. Past performance cannot guarantee future results. Source for Lipper Data: Lipper Inc. Copyright 2007. T. Rowe Price. All Rights Reserved. 9 13. 41 9. 42
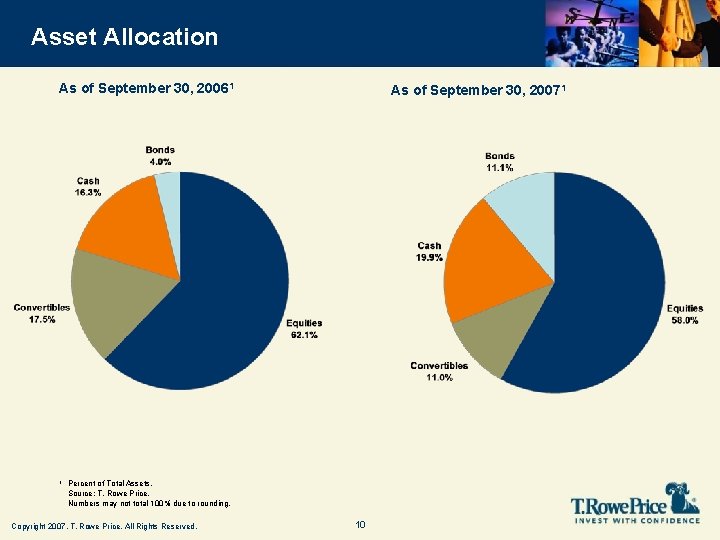
Asset Allocation As of September 30, 20061 1 As of September 30, 20071 Percent of Total Assets. Source: T. Rowe Price. Numbers may not total 100% due to rounding. Copyright 2007. T. Rowe Price. All Rights Reserved. 10
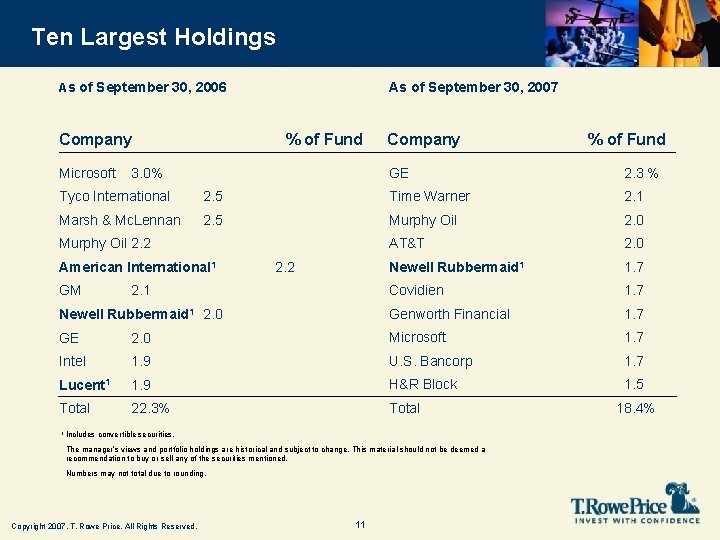
Ten Largest Holdings As of September 30, 2006 Company As of September 30, 2007 % of Fund Microsoft 3. 0% Company % of Fund GE 2. 3 % Tyco International 2. 5 Time Warner 2. 1 Marsh & Mc. Lennan 2. 5 Murphy Oil 2. 0 AT&T 2. 0 Newell Rubbermaid 1 1. 7 Covidien 1. 7 Newell Rubbermaid 1 2. 0 Genworth Financial 1. 7 GE 2. 0 Microsoft 1. 7 Intel 1. 9 U. S. Bancorp 1. 7 Lucent 1 1. 9 H&R Block 1. 5 Total 22. 3% Total Murphy Oil 2. 2 American International 1 GM 2. 2 2. 1 1 Includes convertible securities. The manager’s views and portfolio holdings are historical and subject to change. This material should not be deemed a recommendation to buy or sell any of the securities mentioned. Numbers may not total due to rounding. Copyright 2007. T. Rowe Price. All Rights Reserved. 11 18. 4%
How is the Penn Series Funds, Inc. — Flexibly Managed Fund Different? Return Profile Uniquely Consistent with Risk Averse Clients’ Objectives & Tolerances • • Solid equity market participation in good markets. Capital preservation in difficult markets. Over a cycle, equity-like returns without equity-like risk. Low turnover keeps more of the return in the clients’ pocket. Flexibility. Not “Style Box” Constrained • Bonds, stocks, convertible securities, and cash. Invest where we find the best risk-adjusted returns for our clients. Focus on Capital Preservation • Win by Not Losing… Avoid high multiples, deteriorating earnings quality, and weak balance sheets. • Favor low multiple & high yielding stocks. Favor convertible securities as a means to capture equity upside while limiting losses. High-Insider Ownership • PM has 100% of his 401 K assets in the strategy. • Interest of PM & clients highly aligned. Substantial Resources at Work for Our Clients • Over 100 research analysts on a global platform. • Hundreds of face-to-face meetings with current and potential portfolio companies each year. • Experienced advisory committee. Copyright 2007. T. Rowe Price. All Rights Reserved. 12
Who Should Consider the Penn Series Funds, Inc. — Flexibly Managed Fund? • Clients looking to lower the risk profile of their portfolio, but still generate an equity-like return over time. • Clients in or nearing retirement. • First time equity investors. We understand that we are working for you on behalf of your clients. Copyright 2007. T. Rowe Price. All Rights Reserved. 13
Thank You for Your Business! Copyright 2007. T. Rowe Price. All Rights Reserved. 14
- Slides: 15