
PEFA Physical Energy Flow Accounts ESTP Training Course




- Slides: 25
PEFA Physical Energy Flow Accounts ESTP Training Course Vienna, 6 -7 May 2015 1
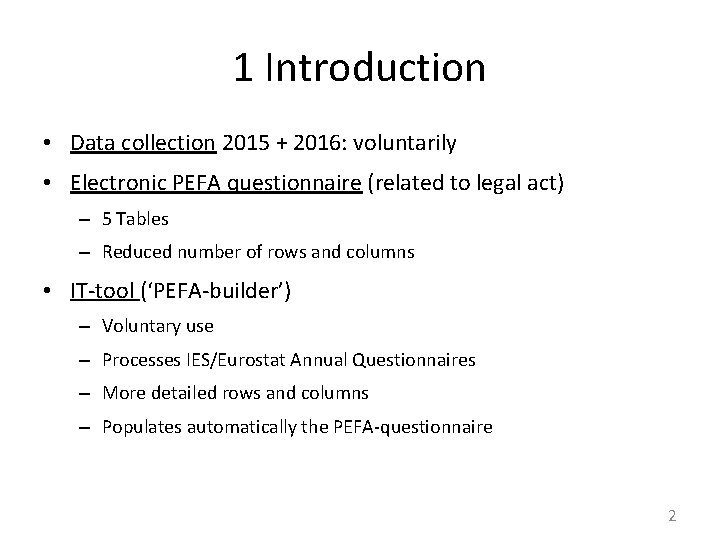
1 Introduction • Data collection 2015 + 2016: voluntarily • Electronic PEFA questionnaire (related to legal act) – 5 Tables – Reduced number of rows and columns • IT-tool (‘PEFA-builder’) – Voluntary use – Processes IES/Eurostat Annual Questionnaires – More detailed rows and columns – Populates automatically the PEFA-questionnaire 2
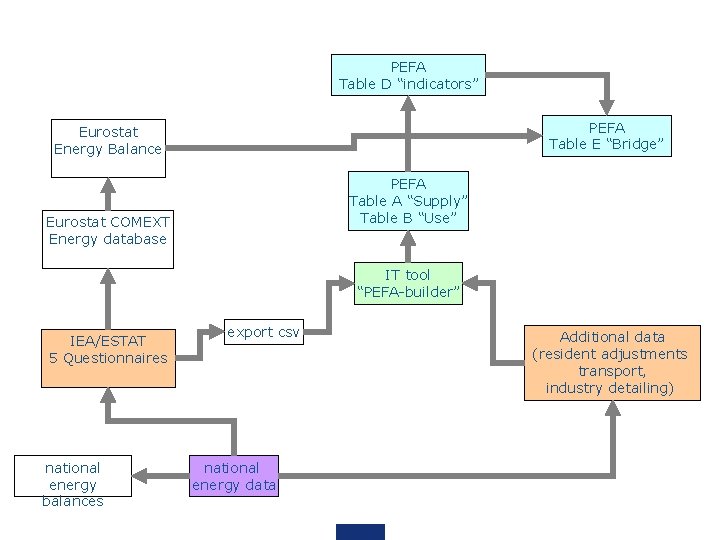
PEFA Table D “indicators” PEFA Table E “Bridge” Eurostat Energy Balance PEFA Table A “Supply” Table B “Use” Eurostat COMEXT Energy database IT tool “PEFA-builder” IEA/ESTAT 5 Questionnaires national energy balances export csv national energy data Additional data (resident adjustments transport, industry detailing)
PEFA 2 Conceptual foundations 4
5
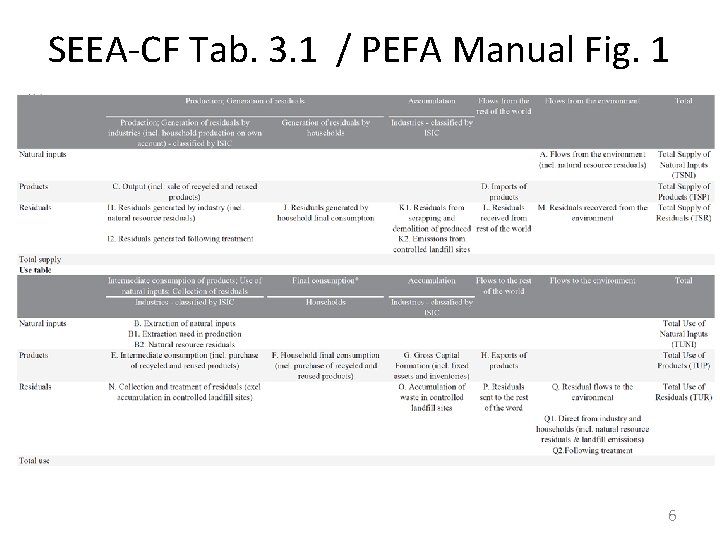
SEEA-CF Tab. 3. 1 / PEFA Manual Fig. 1 6
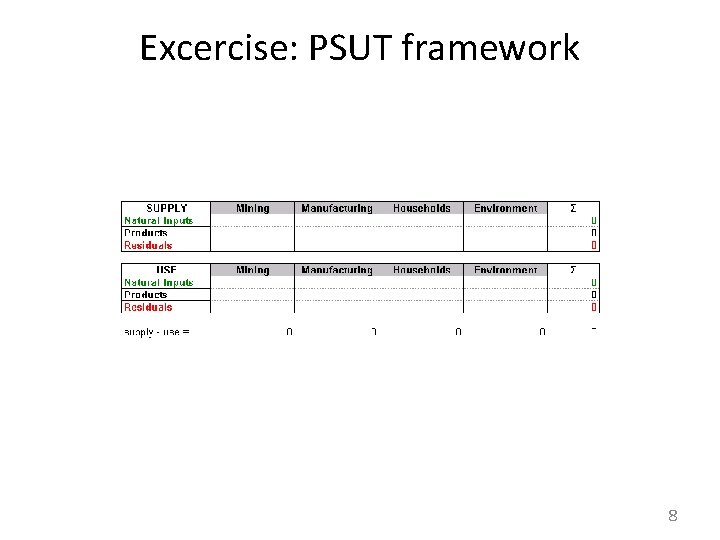
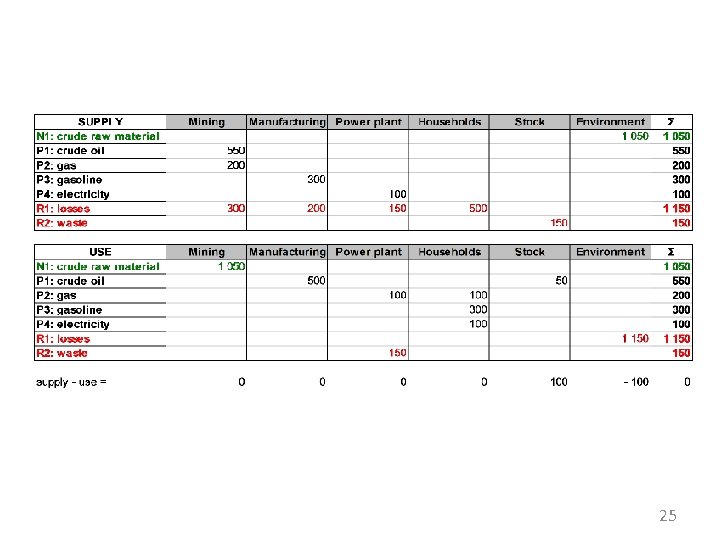
Excercise: PSUT framework 7
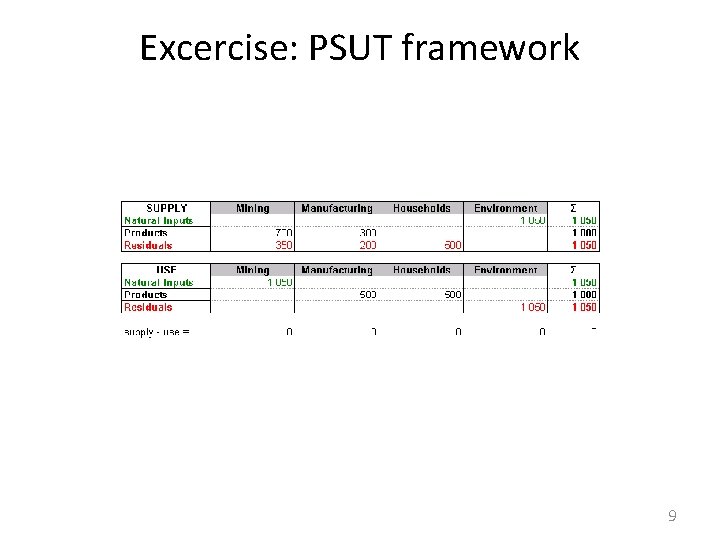
Excercise: PSUT framework 8
Excercise: PSUT framework 9
3 PEFA Questionnaire 10
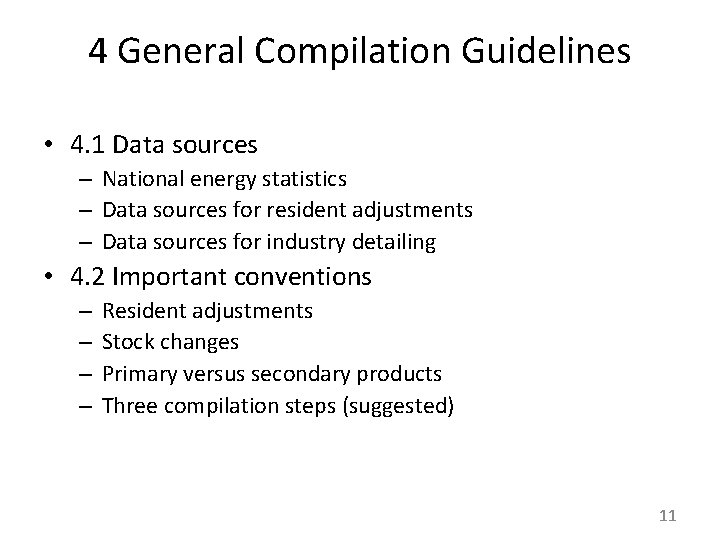
4 General Compilation Guidelines • 4. 1 Data sources – National energy statistics – Data sources for resident adjustments – Data sources for industry detailing • 4. 2 Important conventions – – Resident adjustments Stock changes Primary versus secondary products Three compilation steps (suggested) 11
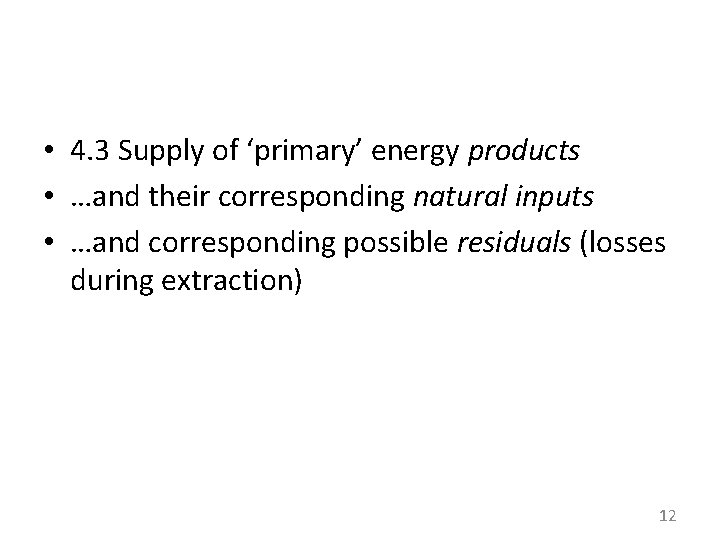
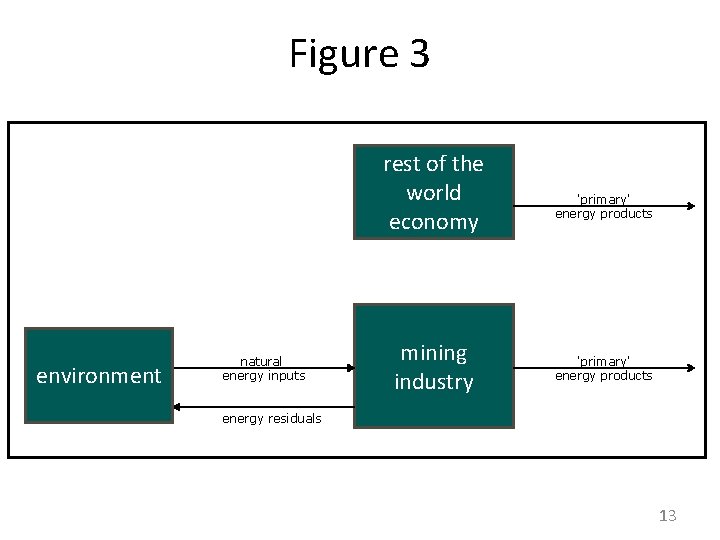
• 4. 3 Supply of ‘primary’ energy products • …and their corresponding natural inputs • …and corresponding possible residuals (losses during extraction) 12
Figure 3 rest of the world economy environment natural energy inputs mining industry 'primary' energy products energy residuals 13
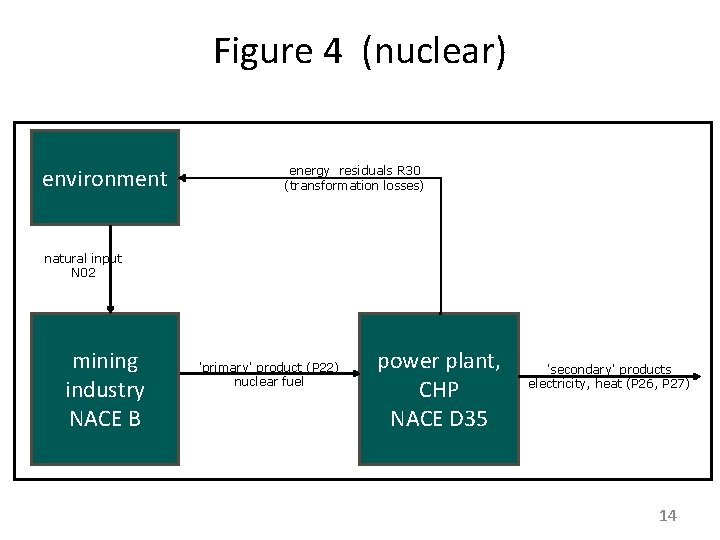
Figure 4 (nuclear) environment energy residuals R 30 (transformation losses) natural input N 02 mining industry NACE B 'primary' product (P 22) nuclear fuel power plant, CHP NACE D 35 'secondary' products electricity, heat (P 26, P 27) 14
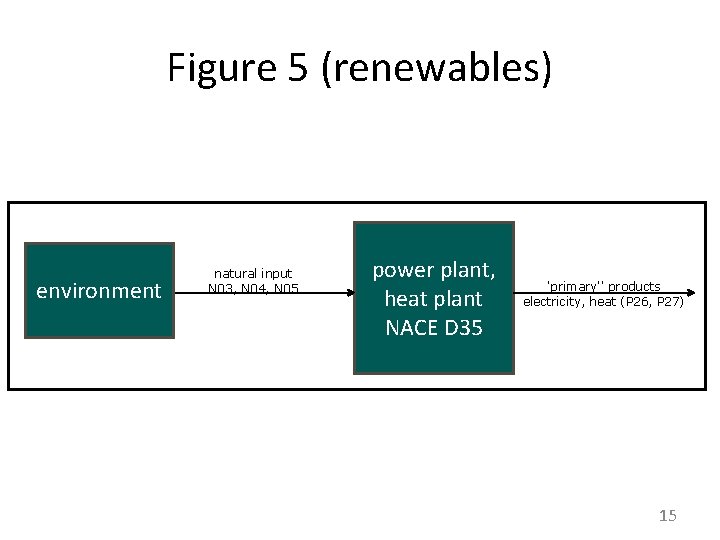
Figure 5 (renewables) environment natural input N 03, N 04, N 05 power plant, heat plant NACE D 35 'primary'' products electricity, heat (P 26, P 27) 15
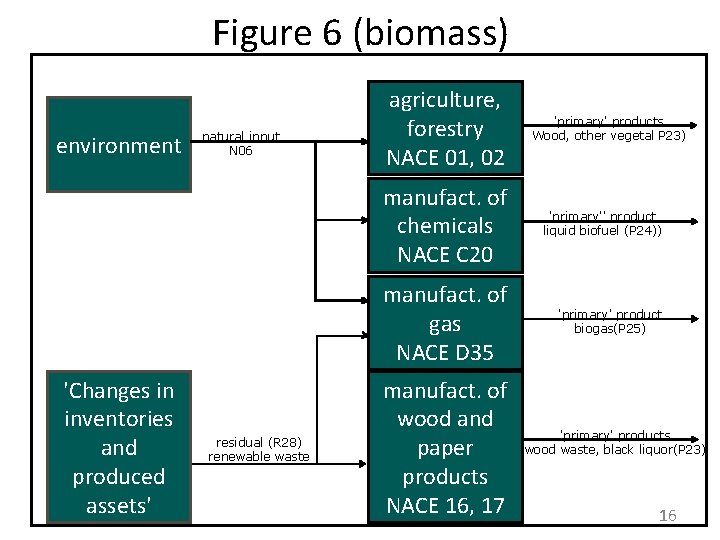
Figure 6 (biomass) environment 'Changes in inventories and produced assets' natural input N 06 residual (R 28) renewable waste agriculture, forestry NACE 01, 02 'primary' products Wood, other vegetal P 23) manufact. of chemicals NACE C 20 'primary'' product liquid biofuel (P 24)) manufact. of gas NACE D 35 'primary' product biogas(P 25) manufact. of wood and paper products NACE 16, 17 'primary' products wood waste, black liquor(P 23) 16
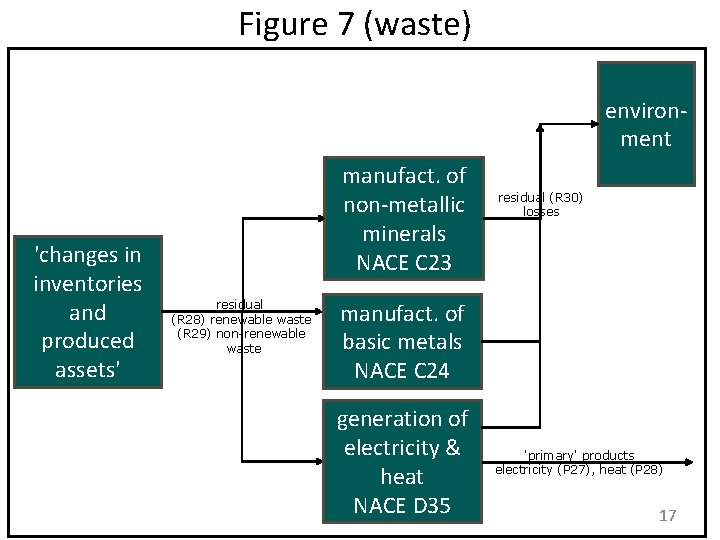
Figure 7 (waste) environment 'changes in inventories and produced assets' manufact. of non-metallic minerals NACE C 23 residual (R 28) renewable waste (R 29) non-renewable waste residual (R 30) losses manufact. of basic metals NACE C 24 generation of electricity & heat NACE D 35 'primary' products electricity (P 27), heat (P 28) 17
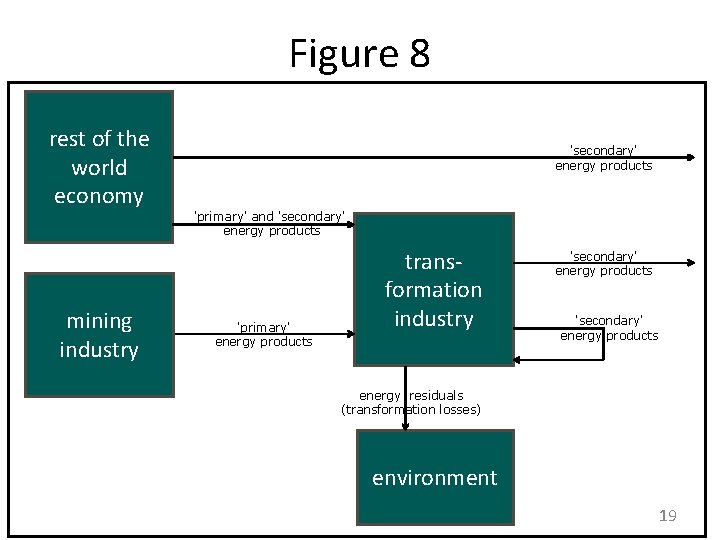
• 4. 4 Transformation into ‘secondary’ energy products • …and corresponding residuals (transformation losses) 18
Figure 8 rest of the world economy mining industry 'secondary' energy products 'primary' and 'secondary' energy products 'primary' energy products transformation industry 'secondary' energy products energy residuals (transformation losses) environment 19
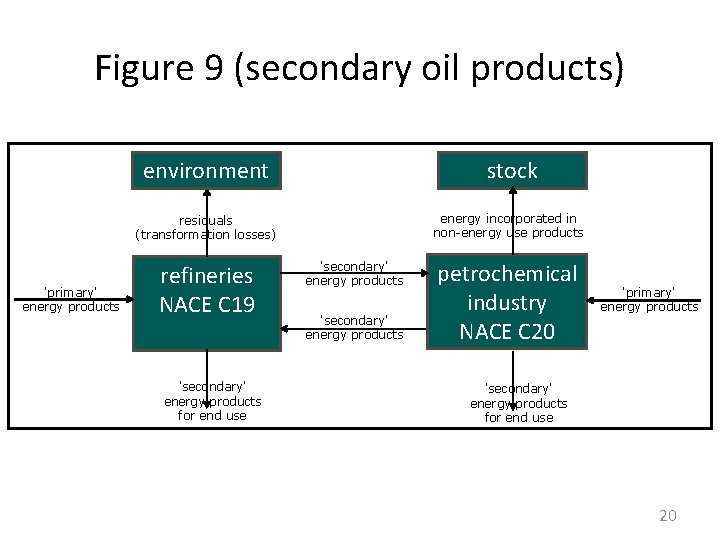
Figure 9 (secondary oil products) environment stock energy incorporated in non-energy use products residuals (transformation losses) 'primary' energy products refineries NACE C 19 'secondary' energy products for end use 'secondary' energy products petrochemical industry NACE C 20 'primary' energy products 'secondary' energy products for end use 20
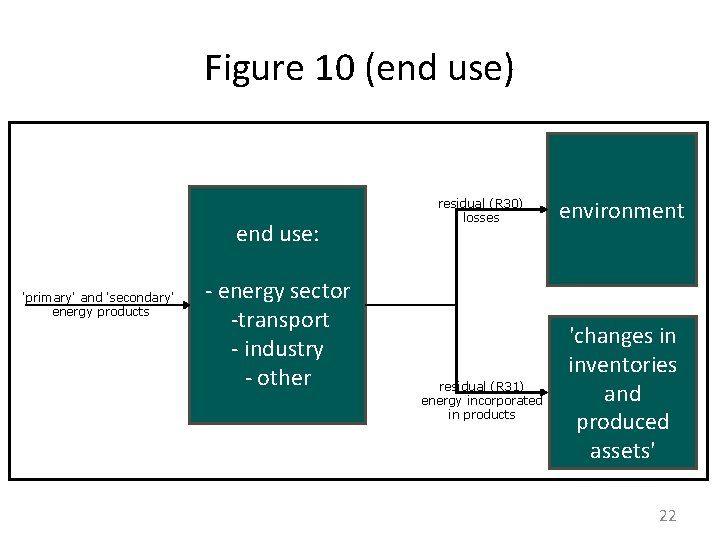
• 4. 5 End uses of energy products • …and corresponding residuals (losses) 21
Figure 10 (end use) end use: 'primary' and 'secondary' energy products - energy sector -transport - industry - other residual (R 30) losses residual (R 31) energy incorporated in products environment 'changes in inventories and produced assets' 22
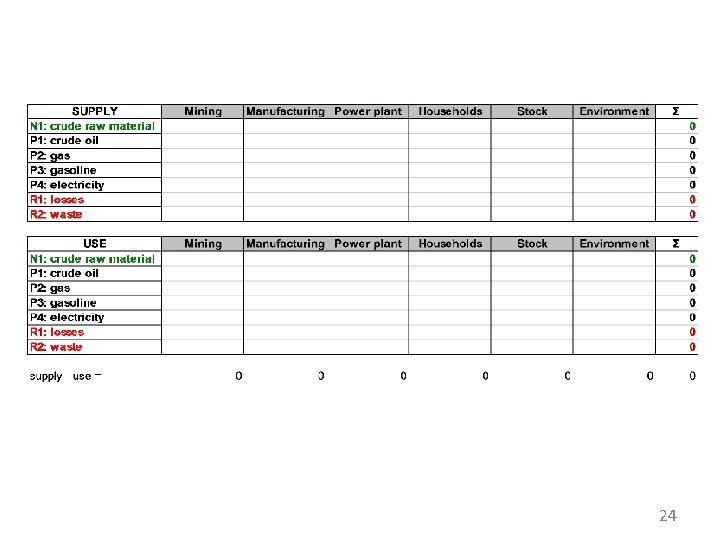
Excercise: advanced flowsystem 23
24
25