PEARLS from San Antonio 2016 Daniele Generali Professore


-positive, HER 2 -breast")
 MAP 2 K 4 mutation")
")


 Probability of progression-free survival, % Bubarlisib +")
 n=321 PIK 3")


 Disease-free survival 84. 7% HR=0.")


, Median PFS 10. 4")
, Median OS 24. 8")

 Pertuzumab + Trastuzumab Postmenopausal patients with HER 2")
 Events, n (%) Median, months Event-free probability")
 Median, months (95% CI) Trastuzumab + AI (n=69)")


")


- Slides: 44
PEARLS from San Antonio 2016 Daniele Generali Professore Associato in Oncologia Medica Dipartimento Universitario Clinico di Scienze Mediche, Chirurgiche e della Salute Università degli Studi di Trieste U. O. Multidisciplinare di Patologia Mammaria Azienda Socio-Sanitaria Territoriale di Cremona
SABCS 2016 TOPICS: • Role of Surrogate Markers in Clinic • Therapeutical Management of Breast Cancer • Gene Expression in Breast Cancer
SABCS 2016 TOPICS: • Role of Surrogate Markers in Clinic • Therapeutical Management of Breast Cancer • Gene Expression in Breast Cancer
Clinical implications of somatic mutations in post-menopausal early-stage estrogen receptor (ER)-positive, HER 2 -breast cancer: Results from the BIG 1 -98 study Serene Loi, et al. Loi S, et al. SABCS 2016. Abstract S 1 -10
Univariate prognostic associations in whole cohort HR (95% CI) MAP 2 K 4 mutation 0. 17 (0. 02 -1. 19) MAP 3 K 1 mutation 0. 54 (0. 26 -1. 12) PIK 3 CA mutation* 0. 57 (0. 38 -0. 85) SPEN mutation 0. 53 (0. 38 -0. 85) PTPN 11 mutation 0. 87 (0. 38 -1. 96) ERBB 2 amplification 0. 94 (0. 38 -2. 36) GATA 3 mutation 1. 21 (0. 68 -2. 14) CDH 1 mutation 1. 37 (0. 76 -2. 47) AKT 1 mutation 1. 49 (0. 55 -4. 04) MYC amplification 1. 63 (0. 93 -2. 86) PTEN mutation 1. 67 (0. 69 -4. 06) 20 g 13 amplification 1. 71 (0. 82 -3. 58) TP 53 mutation* 1. 92 (1. 21 -3. 04) 11 q 13 amplification* 2. 14 (1. 36 -3. 37) ERBB 2 mutation 2. 19 (0. 77 -6. 24) 8 p 11 amplification* 3. 02 (1. 88 -4. 84) Number of alterations* 1. 18 (1. 11 -1. 25) 20 q 13 (ZNF 217, GNAS); 11 q 13 (CCND 1, FGF 19, FGF 3, FGF 4, EMSY); 8 p 11 (FGFR 1, ZNF 703, MYST 3). Number of alterations analyzed as a continous variable. *P value <0. 05 Mod. da Loi S, et al. SABCS 2016. Abstract S 1 -10
PIK 3 CA genotype and interaction with treatment letrozole vs tamoxifen monotherapy (no chemo) PIK 3 CA mt PIK 3 CA wt Number Events 5 year DRF (95% CI) Letrozole 55 8 98% (97 -99) Tamoxifen 79 20 93% (91 -95) Years since randomisation (yrs) % distant recurrence-free Pinteraction = 0. 08 Number Events 5 year DRF (95% CI) Letrozole 80 21 92% (90 -93) Tamoxifen 81 22 89% (87 -91) Years since randomisation (yrs) Mod. da Loi S, et al. SABCS 2016. Abstract S 1 -10
Whole exome and transcriptome sequencing of resistant ER+ metastatic breast cancer Ofir Cohen, et al. Cohen O, et al. SABCS 2016. Abstract S 1 -01
Tumor characteristics RECEPTOR STATUS AT DIAGNOSIS RECEPTOR STATUS OF MET BIOPSY SITE OF MET BIOPSY ER+ HER 2 - → 77% ER+ HER 2 - → 80% Liver → 58% ER+ HER 2+ → 9% ER+ HER 2+ → 7% Bone → 10% ER+ HER 2 Unknown → 9% ER- HER 2 - → 6% Breast → 9% ER- HER 2 - → 2% ER- HER 2+ → 1% Other → 7% ER- HER 2+ → 0% Unknown→ 6% Skin → 5% Unknown → 3% Node → 4% Chest Wall → 3% ER/HER 2 Receptor Changes: • 6 ER+ to ER • 7 HER 2+ to HER 2 • 5 HER 2 - to HER 2+ Unknown → 3% Pleural → 1% Mod. da Cohen O, et al. SABCS 2016. Abstract S 1 -01
Acquired mutation in MBC ESR 1 37 ESR 1 mutations in 23% 22 1 93% of ESR 1 mutations (14/15) in metastatic samples with matched primaries were acquired 14 Acquired Shared ESR 1 Unknown Other ERBB 2 6 12 1 5 ERBB 2 mutations in 7% 83% of ERBB 2 mutations (5/6) in metastatic samples with matched primaries were acquired Acquired Shared Unknown Mod. da Cohen O, et al. SABCS 2016. Abstract S 1 -01
Acquired mutation in MBC 2/14 acquired 2/3 acquired PIK 3 CA PTEN 56 70 12 5 8 1 2 2 RB 1 3/5 acquired 3 8 2 3 Mod. da Cohen O, et al. SABCS 2016. Abstract S 1 -01
BELLE-3: A phase III study of buparlisib and fulvestrant in postmenopausal women with HR+, HER 2 -, Al-treated, locally advanced or metastatic breast cancer, who progressed on or after m. TOR inhibitor-based treatment Angelo Di Leo, et al.
BELLE-3: Study design and endpoints • Postmenopausal women with HR+/HER-, AI-pretreated, locally advanced or metastatic breast cancer • Progression on or after an m. TOR inhibitor as last line or treatment Buparlisib (100 mg/day) + Fulvestrant (500 mg) Randomization (2: 1) Stratified by visceral disease status • n=432 n=289 Placebo + Fulvestrant (500 mg) n=143 Primary endpoint • PFS (locally assessed per RECIST v 1. 1) Key secondary endpoint • OS Other secondary endpoints • PFS by PIK 3 CA status (ct. DNA) • ORR and CBR in the full population and by PIK 3 CA status (ct DNA) • Safety, pharmacokinetics, quality of life Tumor assessment were performed every 6 weeks 90% power to detect a 33% risk reduction in PFS (disease progression or death) at one-sided α=0. 025, based on the observation of 313 PFS events Mod. da Di Leo A, et al. SABCS 2016. Abstract S 4 -07
Progression-free survival per investigator assessment (primary endpoint) Probability of progression-free survival, % Bubarlisib + Fulvestrant Placebo + Fulvestrant 6 -month PFS rate: 31% vs 20% Full Population (n=432) Buparlisib + Fulvestrant n=289 Placebo + Fulvestrant n=143 Median PFS, months (95% CI) 3. 9 (2. 8 -4. 2) 1. 8 (1. 5 -2. 8) HR (95% CI) 0. 67 (0. 53 -0. 84) One-sided p-value PFS results by independent central review were consistent with local assessment: ‑ HR 0. 57 (95% CI: 0. 44 -0. 74; one-sided p<0. 001) <0. 001 Time, months Objective response rate and clinical benefit rate Buparlisib + Fulvestrant n=289 Placebo + Fulvestrant n=143 7. 6 (4. 8 -11. 3) 2. 1 (0. 4 -6. 0) CR, % 0. 3 0 PR, % 7. 3 2. 1 24. 6 (19. 7 -29. 9) 15. 4 (9. 9 -22. 4) ORR, % (95% CI) CBR, % (95% CI) Mod. da Di Leo A, et al. SABCS 2016. Abstract S 4 -07
Progression-free survival by PIK 3 CA status Primary tumor tissue (PCR) n=321 PIK 3 CA mutant: 34% Probability of PFS, % Mutant Wild-type Tissue (mutant) Buparlisib + Fulvestrant Placebo + Fulvestrant Tissue (WT) Buparlisib + Fulvestrant Placebo + Fulvestrant Median PFS, months (95% CI) 4. 7 (2. 9 -6. 7) 1. 4 (1. 4 -2. 2) Median PFS, months (95% CI) 2. 8 (2. 0 -3. 7) 2. 7 (1. 4 -2. 9) HR (95% CI) 0. 39 (0. 23 -0. 65); p<0. 001 HR (95% CI) ct. DNA samples at study entry (BEAMing) n=348 PIK 3 CA mutant: 39% Probability of PFS, % Time, months 0. 83 (0. 60 -1. 14); p=0. 117 Time, months ct. DNA (mutant) Buparlisib + Fulvestrant Placebo + Fulvestrant ct. DNA (WT) Buparlisib + Fulvestrant Placebo + Fulvestrant Median PFS, months (95% CI) 4. 2 (2. 8 -6. 7) 1. 6 (1. 4 -2. 8) Median PFS, months (95% CI) 3. 9 (2. 8 -4. 3) 2. 7 (1. 5 -3. 6) HR (95% CI) Time, months PCR: polymerase chain reaction: WT: wild-type. P-value are one-sided 0. 46 (0. 29 -0. 73); p<0. 001 HR (95% CI) 0. 73 (0. 53 -1. 00); p=0. 026 Time, months Mod. da Di Leo A, et al. SABCS 2016. Abstract S 4 -07
Plasma micro. RNA levels for predicting therapeutic response to neoadjuvant treatment in HER 2 -positive breast cancer. Results from Neo. ALTTO Serena Di Cosimo, et al.
Longitudinale blood sampling for circulating biomarkers in Neo. ALTTO INT Departments Neo. ALTTO Consortium Treatment Pathological complete response FOLLOW-UP NEOADJUVANT THERAPY Baseline Biological window T 0 Week 2 T 1 Pre-surgery (week 18) T 2 At relapse Plasma samples received by INT p. CR rate Event-free survival Mod. da Di Cosimo S, et al. SABCS 2016. Abstract S 3 -02
ct-mi. RNA signatures associated with p. CR in training set and confirmed in testing Set of analysis # of pts. Lapatinib at baseline Train=54 Test=42 Final multivariate model Trastuzumab at week 2 Train=47 Test=59 Lapatinib + Trastuzumab at baseline Train=54 Test=59 5 mi. RNAs mi. R-376 c-3 p; mi. R-874 -3 p; mi. R-197 -3 p; mi. R-320 c; mi. R-100 -5 p 3 mi. RNAs mi. R-144 -3 p; mi. R-362 -3 p; mi. R-100 -5 p 2 mi. RNAs mi. R-143 -3 p; mi. R-96 -5 p 5 mi. RNAs mi. R-374 a-5 p; mi. R-574 -3 p; mi. R-140 -5 p; mi. R-328 -3 p; mi. R-145 -5 p 2 mi. RNAs mi. R-126 -3 p; mi. R-133 b Lapatinib + Trastuzumab at week 2 Train=48 Test=47 3 mi. RNAs mi. R-34 a-5 p; mi. R-98 -5 p; mi. R-100 -5 p Train=61 Test=66 Train=41 Test=57 Lapatinibe at week 2 Trastuzumab at baseline AUC (95% CI) TRAINING AUC (95% CI) TESTING 0. 81 (0. 69 -0. 93) 0. 86 (0. 73 -0. 98) 0. 75 (0. 62 -0. 88) 0. 79 (0. 64 -0. 94) 0. 71 (0. 55 -0. 86) 0. 47 (0. 30 -0. 65) 0. 89 (0. 79 -0. 99) 0. 81 (0. 70 -0. 92) 0. 79 (0. 67 -0. 92) 0. 55 (0. 40 -0. 70) 0. 76 (0. 62 -0. 90) 0. 67 (0. 51 -0. 83) Survival probability ct-mi. RNA 140 -5 p is associated with EFS HR: 0. 40 95% CI: 0. 18 -0. 89 p=0. 021 Time Mod. da Di Cosimo S, et al. SABCS 2016. Abstract S 3 -02
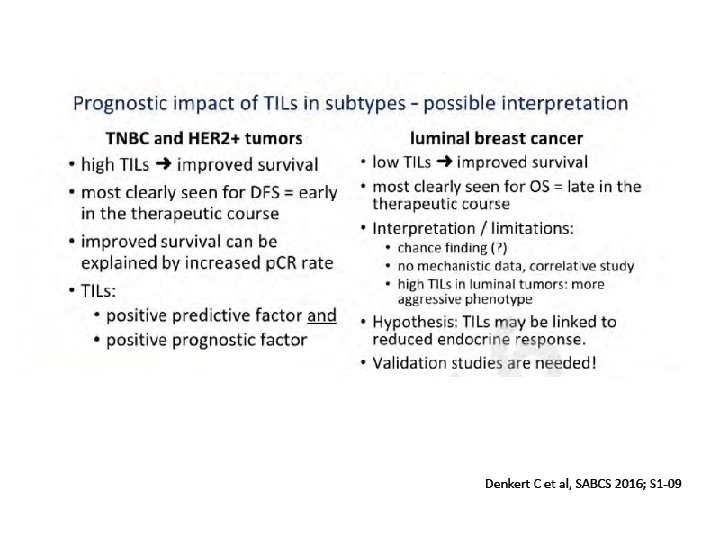
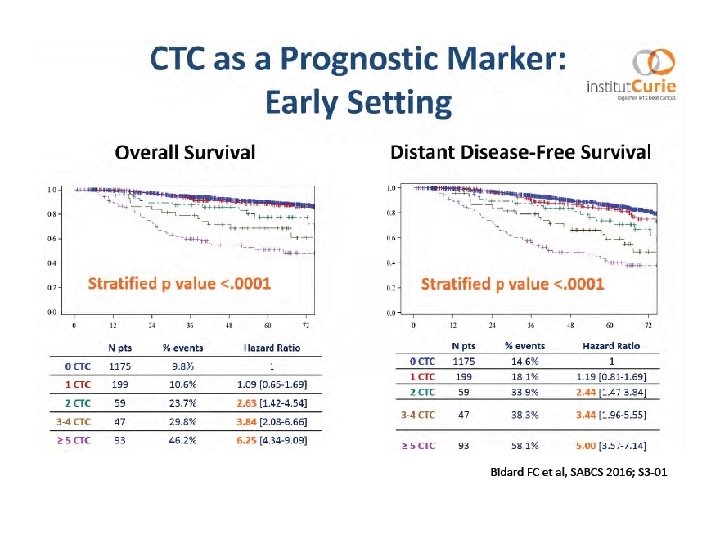
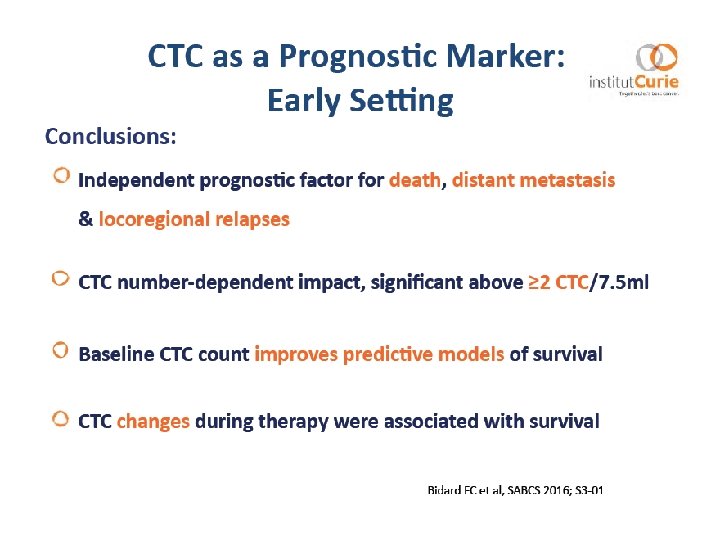
Role of Surrogate Markers in Clinic - TILS : strong marker of outcome in TN and HER 2 BC: ready to use in IHC - CTCs are still a solid predictive and prognostic surrogate marker in BC - Potential Role of s. PI 3 KCAmut (tissue/cf. DNA) in BC and response to HT - Less positive impact of mi. RNAs in Clinic - Investigation in MBC (tissue/cf. DNA) with regards to the HT and TKIs of - ERS 1 - Rb 1
SABCS 2016 TOPICS: • Role of Surrogate Markers in Clinic • Therapeutical Management of Breast Cancer • Gene Expression in Breast Cancer
Trial in extended adjuvant therapy Abstract S 1 -03 Tjan-Heijnen VC, et al. First results from the multicenter phase III DATA study comparing 3 versus 6 years of anastrozole after 2 -3 years of tamoxifen in postmenopausal women with hormone receptorpositive early breast cancer. Abstract S 1 -04 Blok EJ, et al. Optimal duration of extended letrozole treatment after 5 years of adjuvant endocrine therapy; results of the randomized phase III IDEAL trial (BOOG 2006 -05). Abstract S 1 -05 Mamounas EP, et al. A randomized, double-blinded, placebo-controlled clinical trial to evaluate extended adjuvant endocrine therapy (5 years of letrozole) in postmenopausal women with hormonereceptor positive breast cancer who have completed previous adjuvant endocrine therapy: Initial results of NRG oncology/NSABP B-42.
Trial in extended adjuvant therapy 0 1 2 3 4 5 5 MA-17 Tam R NSABP-B 33 Tam R ABCSG-6 a Tam R NSABP-B 42 MA-17 R ABCSG-16 DATA IDEAL SOLE Al Tam Tam Al Tam 10 Exe 0. 68 Placebo Ana 0. 62 nl Let 0. 85 Placebo Let R Placebo Ana 0. 79 Al Let R R 0. 80 Ana Al HR DFS 0. 57 Ana R Al Tam 9 Placebo R Al 8 Let Al Tam 7 R Al Tam 6 0. 88 Let Let Mod. da SABCS 2016. Abstract S 1 -03, 04, 05
Disease-free survival DATA NSABP-B 42 81. 3% Patients (%) Disease-free survival 84. 7% HR=0. 85 (0. 73 -0. 999); p=0. 048* HR= 0. 79, P=0. 07 6 yrs 3 yrs Letrozole (#events: 292) Placebo (#events: 339) Years after randomization Percent survival *P-value did not reach statistical significance level of 0. 0418 IDEAL HR= 0. 88, P=0. 43 5 yrs 2. 5 yrs Years Mod. da SABCS 2016. Abstract S 1 -03, 04, 05
Pr. ECOG 0102: A randomized, double-blind phase II trial of fulvestrant plus everolimus or placebo in post-menopausal women with hormonereceptor positive, HER 2 -negative metastatic breast cancer resistant to aromatase inhibitor therapy Noah S Kornblum, et al. Kornblum NS, et al. SABCS 2016. Abstract S 1 -02
Methods: Study Schema INDUCTION PHASE CONTINUATION PHASE Arm A 1: 1 Randomization Stratify: ECOG PS: 0 vs 1 Measurable disease (y/n) Prior chemo for mets (y/n) Fulvestrant 500 mg day 1 and 15 of cycle 1, then day 1 of cycles 2 -12 (28 d cycles) Everolimus 10 mg PO QD Arm A & B (week 48) Unblind and continue Fulvestrant ± Everolimus Arm B Fulvestrant 500 mg day 1 and 15 of cycle 1, then day 1 of cycles 2 -12 (28 d cycles) Placebo PO QD • Induction Phase: Treat until evidence of progressive disease or unacceptable toxicity for a maximum of 12 cycles (48 weeks) • Continuation Phase: If no disease progression or unacceptable toxicity after 12 cycles, unblind and continue fulvestrant ± everolimus • Treatment Plan: Tumor measurements every 12 weeks (± 1 week) by local treating physician • Supportive Care: Corticosteroid mouthwash prophylaxis was not used Mod. da Kornblum NS, et al. SABCS 2016. Abstract S 1 -02
Progression-free survival Proportion alive and progression-free Everolimus (45 events/66 pts), Median PFS 10. 4 mos Placebo (56 events/65 pts), Median PFS 5. 1 mos Hazard Ratio 0. 60, 95% CI 0. 40 -0. 92 Stratified Log rank p=0. 02 Time, months Mod. da Kornblum NS, et al. SABCS 2016. Abstract S 1 -02
Proportion alive and progression-free Overall survival Everolimus (17 deaths/66 pts), Median OS 24. 8 mos Placebo (13 events/65 pts), Median OS NR Hazard Ratio 1. 11, 95% CI 0. 50 -2. 51 Stratified Log rank p=0. 79 Time, months Mod. da Kornblum NS, et al. SABCS 2016. Abstract S 1 -02
Primary analysis of PERTAIN: A randomized, two-arm, open-label, multi center phase II trial assessing the efficacy and safety of pertuzumab given in combination with trastuzumab plus an aromatase inhibitor in first-line patients with HER 2 -positive and hormone receptor-positive metastatic or locally advanced breast cancer Mothaffar F. Rimawi, et al. Rimawi MF, et al. SABCS 2016. Abstract S 3 -04
PERTAIN Study Design (Phase II Trial) Pertuzumab + Trastuzumab Postmenopausal patients with HER 2 -positive and hormone receptor-positive LA/MBC, not previously treated with systemic nonhormonal anticancer therapy in the advanced setting + Choice of chemotherapy must be specified before randomization Aromatase Inhibitor R OR Docetaxel or Paclitaxel → Aromatase Inhibitor (18 -24 weeks) (N=258)* Trastuzumab + Stratification factors • Chemotherapy (yes/no) • Time since adjuvant hormone therapy (<12 months/>12 months/no prior therapy) *165 events to detect significant improvement in PFS from 7 months to 10. 8 months (i. e. HR 0. 645) with 80% power and a 2 -sided log-rank test at an alpha level of 0. 05. †Choice of chemotherapy must be specified before randomization; administered per product labelling. LA, locally advanced. Aromatase Inhibitor OR Docetaxel or Paclitaxel → Aromatase Inhibitor (18 -24 weeks †) Mod. Da Arpino G, et al. SABCS 2016. Abstract S 3 -04
Primary progression-free survival analysis (Stratified, ITT population) Events, n (%) Median, months Event-free probability (%) (95% CI) Pertuzumab + Trastuzumab + AI (n=129) 74 (57. 4) 92 (71. 3) 18. 89 15. 80 (14. 09 -27. 66) (11. 04 -18. 56) ∆, months 3. 09 HR (95% CI) 0. 65 (0. 48 -0. 89) P-value 0. 0070 Median Pertuzumab + Trastuzumab + AI Time, months Analysis based upon Kaplan-Meier approach including stratification factors from IXRS. HR from a stratified Cox proportional hazards model including stratification factors from IXRS. Median time of follow-up: 31 months. Mod. da Rimawi MF, et al. SABCS 2016. Abstract S 3 -04
Duration of response (Unstratified, ITT responders) Median, months (95% CI) Trastuzumab + AI (n=69) 27. 10 15. 11 (14. 13, -) (12. 09 -20. 96) ∆, months 11. 99 HR (95% CI) 0. 57 (0. 36 -0. 91) P-value Event-free probability (%) Pertuzumab + Trastuzumab + AI (n=69) 0. 0181 Median Pertuzumab + Trastuzumab + AI Time, months Mod. da Rimawi MF, et al. SABCS 2016. Abstract S 3 -04
SABCS 2016 Therapeutical Management of Breast Cancer: • Extended adjuvant therapy: not a real advantage, maybe only in the High Risk BC subset? • Everolimus based treatment is active in m. BC. With regards to the new treatments, patients’s selection based on surrogate markers would be interesting • HT + Trastuzumab and Pertuzumab is efficacious in ER+ m. BC
SABCS 2016 TOPICS: • Role of Surrogate Markers in Clinic • Therapeutical Management of Breast Cancer • Gene Expression in BC
Comprehensive comparison of prognostic signatures for breast cancer recurrence in Trans. ATAC Ivana Sestak, et al. Signature Information included Clinical Treatment Score (CTS) Nodal status, grade, tumor size, age, treatment Immunohistochemical markers (IHC 4) ER, Pg. R, Ki 67, HER 2 Oncotype Recurrence Score (RS) 21 genes (oestrogen, proliferation, invasion, HER 2 genes) Breast Cancer Index (BCI) H/I and 5 proliferation genes (Molecular Grade Index) Prosigna (ROR) 46 genes, proliferation score, tumour size (EU cut-offs from trans. ATAC for N- and N+) Endo. Predict (EPclin) 12 genes (proliferation, differentiation, oestrogen); nodal status and tumor size Mod. da Sestak I, et al. SABCS 2016. Abstract S 6 -05
PROGNOSTIC VALUE YEARS 0 -10 Prognostic performance of the signatures in predicting the overall risk of distant recurrence according to lymph-nodal status Node negative CTS 31. 8 IHC 4 30. 6 % improvement 43. 8 BCI 22. 8 RS ROR 50. 8 40. 6 EPclin IHC 4 31. 8 BCI 31. 8 RS 31. 8 ROR 31. 8 EPclin 31. 8 IHC 4 Node positive BCI RS ROR EPclin 22. 5 10. 6 9. 6 6. 4 15. 5 35. 6 Likelihood Ratio x 2 33. 3% 23. 7 15. 2 74. 5% 47. 8% % improvement 40. 2 6. 3 70. 8% Likelihood Ratio ∆x 2 Likelihood Ratio x 2 CTS 53. 8% 17. 1 IHC 4 40. 2 4. 8 11. 9% BCI 40. 2 5. 2 12. 9% RS 40. 2 5. 0 12. 3% ROR 40. 2 6. 0 14. 9% EPclin 40. 2 8. 5 21. 1% Likelihood Ratio ∆x 2 Mod. da Sestak I, et al. SABCS 2016. Abstract S 6 -05
Prognostic performance of the signatures in predicting the risk of late (years 5 -10) distant recurrence according to lymph-nodal status PROGNOSTIC VALUE YEARS 5 -10 IHC 4 Node negative IHC 4 16. 6 BCI RS % improvement 16. 6 CTS 19. 5 3. 4 31. 3 ROR 24. 0 EPclin Likelihood Ratio x 2 CTS Node positive 11. 2 BCI 16. 6 RS 16. 6 20. 0% 3. 3 1. 9 ROR 16. 6 11. 4% 18. 4 EPclin 16. 6 67. 5% 10. 3 111. 0% 62. 0% Likelihood Ratio ∆x 2 % improvement 16. 0 IHC 4 16. 0 1. 2 7. 5% BCI 3. 1 BCI 16. 0 1. 8 11. 3% RS 1. 1 RS 16. 0 1. 1 6. 9% ROR 16. 0 4. 1 25. 6% EPclin 16. 0 4. 4 27. 5% ROR EPclin 7. 3 14. 9 Likelihood Ratio x 2 Likelihood Ratio ∆x 2 Mod. da Sestak, et al. SABCS 2016. Abstract S 6 -05
10 -year risk of distant metastases according to multigene-expression signatures 10 -year RISK by signature result Signature Node negative Node Positive Low Medium High BCI 3. 9% 19. 3% 27. 3% 23. 8% 33. 1% 50. 6% RS 5. 9% 16. 7% 27. 2% 26. 2% 34. 7% 48. 8% ROR 3. 0% 14. 1% 33. 4% 0% 20. 7% 39. 1% EP-Clin 6. 6% - 22. 1% 5. 6% - 37. 2% 5 -10 year RISK by signature result Low Medium High BCI 2. 5% 14. 4% 15. 9% 14. 3% 19. 7% 36. 5% RS 4. 8% 9. 6% 16. 1% 17. 9% 19. 5% 27. 5% ROR 1. 4% 10. 0% 23. 2% 0% 13. 0% 25. 0% Ep. Clin 4. 3% - 14. 6% 3. 3% - 23. 6% Mod. da Sestak I, et al. SABCS 2016. Abstract S 6 -05
SABCS 2016 Gene Expression in BC: - Gene signature useful in node negative - Gene signature in node positive is still controversial; PAM 50 and Endopredict maybe useful but only combined with clinical andpathological parameters
Conslusioni ARRIVEDERCI AL PROSSIMO BJClub 2018