Peanut Outlook September 25 2018 Southern Agricultural Outlook

Peanut Outlook September 25, 2018 Southern Agricultural Outlook Conference Presented by Adam N. Rabinowitz, Ph. D. Assistant Professor and Extension Economist Agricultural and Applied Economics

Overview • Supply – • there are still a lot of peanuts out there • Demand – • strong but overall becoming stagnant • Trade – • minimal impact from retaliatory tariffs • Policy – • status quo in House and Senate versions • Prices – • little upward movement expected

Peanut Supply

Peanut Acreage State 2013 2014 2015 2016 2017 2018 P % Change 195 30 195 840 44 1, 304 9 21 275 305 120 125 27 272 1, 881 165 17 155 665 25 1, 027 6 16 155 177 102 87 24 213 1, 427 -15. 4% -43. 3% -20. 5% -20. 8% -43. 2% -21. 2% -33. 3% -23. 8% -43. 6% -42. 0% -15. 0% -30. 4% -11. 1% -21. 7% -24. 1% 1, 000 acres AL AR FL GA MS SE NM OK TX SW NC SC VA VC US 140 430 34 744 7 17 120 144 82 81 16 179 1, 067 175 10. 5 175 600 32 982 5 12 130 147 94 112 19 225 1, 354 200 16. 3 190 785 44 1, 219 5 10 170 185 90 112 19 221 1, 625 175 24 155 720 39 1, 113 8 13 305 326 101 110 21 232 1, 671 Source: USDA NASS Crop Production Reports – Last updated 9/12/18
 2018 Projected (lbs) Record Yield AL FL GA")
Peanut Yields State 2017 Actual (lbs) 2018 Projected (lbs) Record Yield AL FL GA MS NC OK SC TX VA AR&NM Total 3, 650 3, 550 4, 380 4, 100 3, 700 4, 000 3, 600 4, 550 4, 768 4, 074 4, 000 4, 100 4, 500 4, 000 3, 900 3, 000 3, 800 3, 200 4, 100 4, 738 4, 151 4, 000 (‘ 12) 4, 000 (‘ 14) 4, 580 (‘ 12) 4, 400 (‘ 12) 4, 320 (‘ 14) 4, 000 (‘ 17) 3, 750 (‘ 05) 4, 550 (‘ 17) 4, 768 (‘ 17) 4, 211 (‘ 12) Data Source: USDA-NASS – Last updated 9/12/18

Data Source: USDA-NASS

Peanut Production State AL FL GA MS NC OK SC TX VA AR&NM Total 2017 Actual (tons) 352, 225 330, 150 1, 806, 750 88, 150 239, 850 37, 000 236, 000 378, 000 61, 425 87, 250 3, 616, 800 2018 Projection (tons) 326, 000 299, 300 1, 473, 750 48, 000 195, 000 22, 500 159, 600 232, 000 49, 200 74, 625 2, 879, 975 U. S. Record 4 th Highest on Record Data Source: USDA-NASS – Last updated 9/12/18 % Change -7. 4% -9. 3% -18. 4% -45. 5% -18. 7% -39. 2% -32. 4% -38. 6% -19. 9% -14. 5% -20. 4%

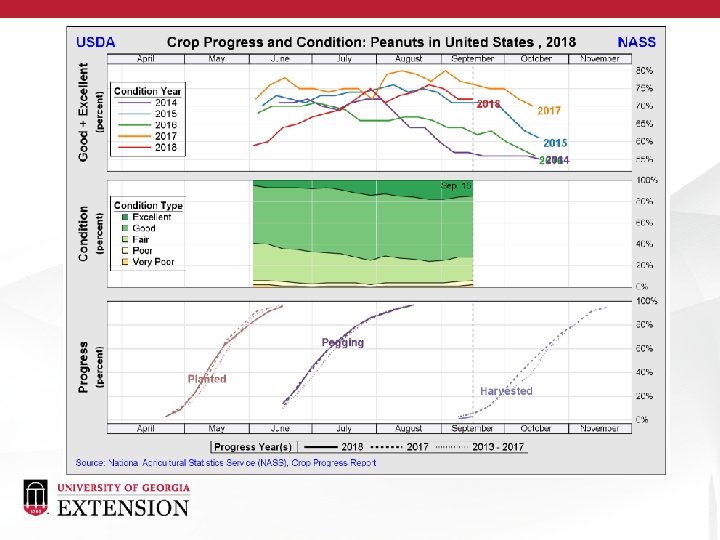
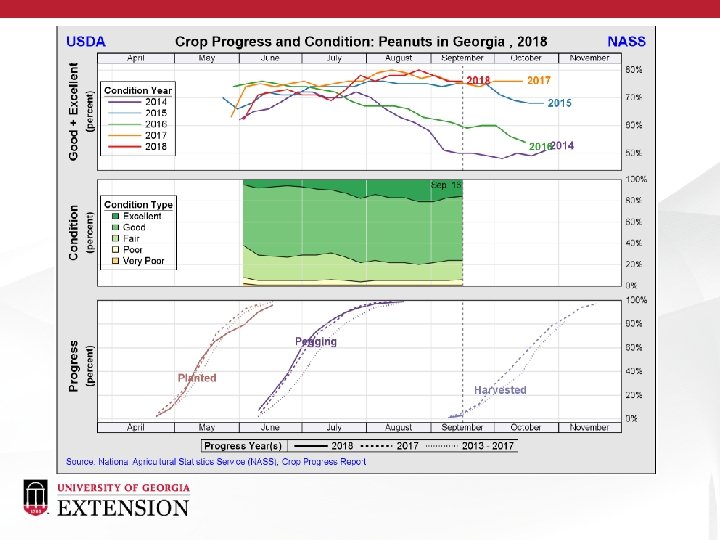
Peanut Supply Summary • Acreage down 24% but with good yields in places, especially Georgia, production is projected down only 20%. • Likely will see some loss in Carolina’s that will drop production estimates, but still end up as top 5 production year. • 2017 crop is still in the warehouses. Sheller’s expect to finish that crop about March. • No warehouse issues, but still a lot of peanuts out there.

Peanut Demand

Data Source: USDA-ERS as of 9/12/18

Shelled and In Shell Peanut Products Data Source: USDA NASS as of 9/12/18

Peanut Demand Summary • U. S. food demand for peanuts has been slowly but steadily increasing. • Industry focus has been on: • Peanut allergy education including early introduction of peanut butter • Peanut healthfulness – low cost protein, good for diabetes, heart friendly, and weight loss. • Overall demand has grown over the last decade but fairly stagnant for about last 4 years.

Peanut Trade

U. S. Peanut Trade: Production, Exports, and Imports Exports range from 15%-26% of U. S. production – average 22%. Imports range from 1%-7% of U. S. production. 2017 exports valued at $677 million. Data Source: USDA-ERS as of 9/12/18

Trade Disputes • U. S. placed tariffs on steel and aluminum national security concerns • U. S. placed tariffs on goods from China intellectual property concerns • NAFTA • A deal with Mexico has been reached but negotiations with Canada are ongoing. No impact on peanuts at this point. • EU • Retaliatory tariffs on peanut butter of 25% additional. • China • Retaliatory tariffs on soybeans and other agricultural products, but no peanut impact until September 18 (effective September 24) when 5%/10% was added.

U. S. Peanuts and Peanut Products Exported to World Market $677 M +3% YOY Data Source: U. S. Department of Commerce, Bureau of Census as Collected by American Peanut Council through June 2018

U. S. Peanuts and Peanut Products Exported to Canada $177 M -12% YOY Data Source: U. S. Department of Commerce, Bureau of Census as Collected by American Peanut Council through June 2018

U. S. Peanuts and Peanut Products Exported to Mexico $134 M -5% YOY Data Source: U. S. Department of Commerce, Bureau of Census as Collected by American Peanut Council through June 2018

U. S. Peanuts and Peanut Products Exported to China $58 M +24% YOY Data Source: U. S. Department of Commerce, Bureau of Census as Collected by American Peanut Council through June 2018

U. S. Peanuts and Peanut Products Exported to Netherlands $70 M +2% YOY Data Source: U. S. Department of Commerce, Bureau of Census as Collected by American Peanut Council through June 2018

U. S. Peanuts and Peanut Products Exported to Germany $36 M -7% YOY Data Source: U. S. Department of Commerce, Bureau of Census as Collected by American Peanut Council through June 2018

U. S. Government Response to Retaliatory Tariffs • $12 billion in aid to farmers of selected crops through the Market Facilitation Program • Nothing for peanuts • Up to $1. 2 billion of commodities purchased through the Food Purchase and Distribution Program • This includes $12. 3 million for peanut butter • $200 million to develop export markets through the Trade Promotion Program

Peanut Trade Summary • Exports worth $677 Million in 2017 represents about 18% of 2017 production. • Almost half of the U. S. peanut exports go to Canada and Mexico. • China has become a big buyer but is currently priced out of the market, even without retaliatory tariffs. • Retaliatory tariffs from China could become deal breaker for future exports to China if price is otherwise acceptable.

Peanut Policy

2018 Farm Bill: Peanut Update • House and Senate versions offer no change to peanut specific policy. • Maintains $355 marketing loan rate. • Maintains $535 reference price. • Maintains separate payment limits. • Maintains storage and handling provisions.
 • lesser")
2018 Farm Bill: Peanut Update • House version Effective Reference Price (ERP) • lesser of 115% of RP or • greater of (RP or 85% of 5 yr Olympic average price) • • For peanuts this means…. 115% of RP = $615. 25 5 yr Olympic average price > $629 for ERP > $535 5 yr Olympic average price = $723. 82 to reach $615. 25 ERP

Price Loss Coverage Marketing Year Payment Rate Pay Date 2014/15 $0. 0475/lb or $95/ton October 2015/16 $0. 0745/lb or $149/ton October 2016/17 $0. 0705/lb or $141/ton October 2017/18 $0. 0385/lb or $77/ton October 2018/19 Projected: $0. 0550/lb or $110/ton October 2019 Data Source: USDA-FSA

Peanut Policy Summary • No changes at this point but still uncertainty until the bill is signed. • PLC payment rate for October 2018 payment lowest in four years but expected to increase again next year.

Peanut Prices

Peanut Prices with Forecasts Data Source: USDA-NASS and FAPRI

Thank You! Questions? Contact Info: Adam N. Rabinowitz, Ph. D. Assistant Professor and Extension Economist Department of Agricultural and Applied Economics The University of Georgia – Tifton Campus 2360 Rainwater Rd. , Tifton, GA 31793 Phone: (229) 386 -3512 E-mail: adam. rabinowitz@uga. edu Webpage: http: //agecon. uga. edu
- Slides: 36