PCR From Basics to Implementation Dr Surojit Das

PCR: From Basics to Implementation Dr. Surojit Das, Ph. D. Assistant Professor Bio-Medical Laboratory Science & Management Vidyasagar University Midnapore

PCR, polymerase chain reaction, is an in-vitro molecular technique for selective amplification of a region of DNA (or RNA) even in samples containing only minute quantities of DNA or RNA whose sequence is known or which lies between two regions of known sequence.

Background ü 1966, Thomas Brock discovers Thermus aquaticus, a thermostable bacteria in the hot springs of Yellowstone National Park ü 1970 s : Replication of single-stranded DNA using synthetic primers & DNA polymerase ü 1983, Kary Mullis postulated the concept of PCR ( Nobel Prize in 1993) ü 1993, Roche introduced commercial PCR ü 1997, Real-time machine [Light. Cycler, ABI Prism 7700] ü 2006, Fluidigm launched Digital PCR

Up-gradation

Lab Space Allocation for PCR MM Specimen PCR_Detection
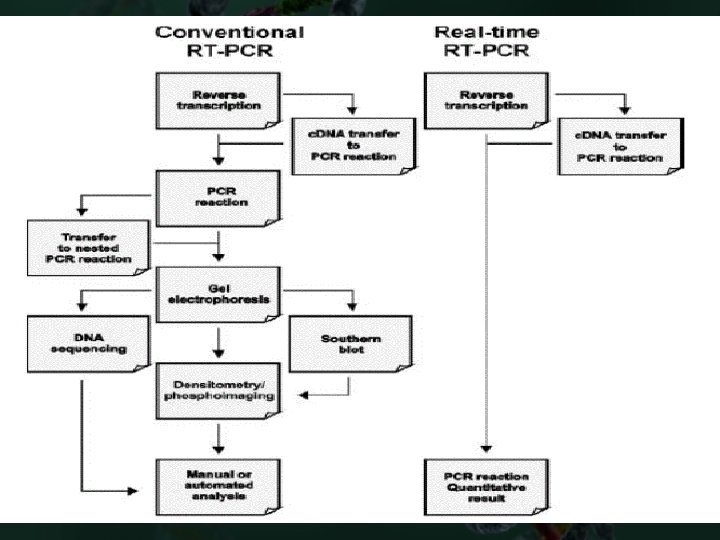

Different Types of PCR

Essential Components of PCR 1. A thermostable DNA polymerase: Catalyze template dependent synthesis of DNA üVary in fidelity, efficiency & ability to synthesize large DNA products üRoutine PCR contains 0. 5 -2. 5 U of Taq pol/ 25 -50µl reaction üEfficiency declines towards the end of PCR cycles 2. A pair of synthetic oligonucleotide: Prime the DNA systnesis üPCR efficiency & specificity depends on good design of primers üStandard PCR contains 0. 1 -0. 5µM of each primers sufficient for 30 cycles & 1 kb amplification üDifferent PCR demands variations in primer design
")
Essential Components of PCR 3. d. NTPs üStandard PCR contain equimolar amounts (200 -250µM) of d. ATP, d. TTP, d. GTP & d. CTP with 1. 5 m. M Mg. Cl 2 for synthesis of ~6µg of DNA (even also multiplex PCR) 4. Divalent Cations (Mg 2+) üCofactor of DNA pol üBinding of primer to template by stabilizing negative charges ü 1. 5 m. M Mg 2+ routinely used, while 4. 5 -6. 0 used in special purposes 5. Buffer to maintain p. H üTris-Cl used at a p. H range of 8. 3 -8. 8 at RT at conc. 10 m. M üPCR mix p. H become ~7. 2 at 72°C

Essential Components of PCR 6. Monovalent Cations üStandard PCR buffer>>>50 m. M KCl>>>amplification of DNA >500 bp üRaising conc. (70 -100 m. M)>>>improves of yield of shorter DNA fragments 7. Template DNA üMay be ss or ds DNA üHigh m. w DNA (>10 kb) is needed to be digest üRecommended initial quantity: mammalian g. DNA (1µg), yeast (10 ng), bacteria (1 ng) & plasmid (1 pg)
 ü Probe-based Taq. Man, Molecular")
Real-Time PCR: Chemistry of Foster Resonance Energy Transfer (FRET) ü Probe-based Taq. Man, Molecular beacons, Scorpions ü Non-Probe based SYBR Stokes shift is the diff. (in wavelength or frequency units) b/t positions of the band maxima of the absorption & emission spectra of the same electronic transition (e. g. , fluorescence & Raman spectra)
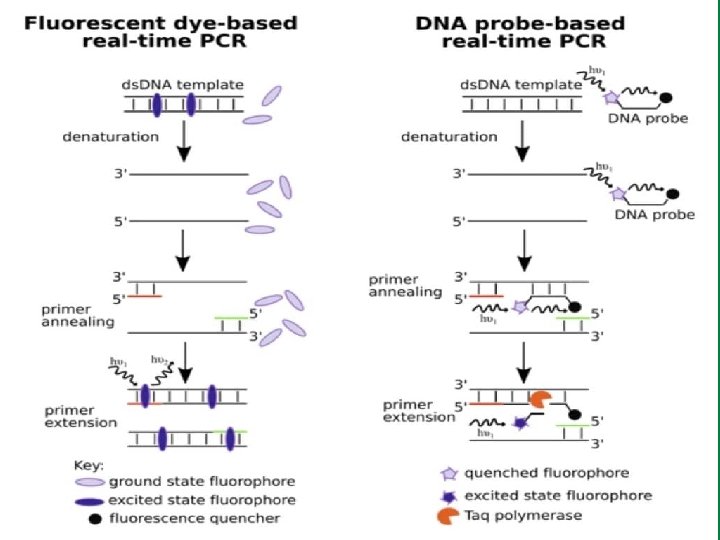

Thermal Cycling Steps Probe annealing No. of Cycles=25 -35

Exponential/logarithmic Amplification

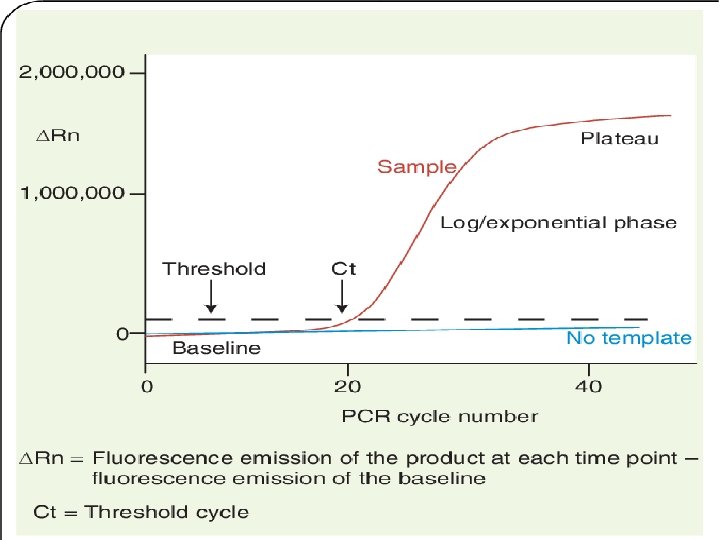
Amplification Curve: Reaction Dynamic of PCR

Visualizing Results: Gel electrophoresis & Documentation Gel running

Visualizing Results: Gel electrophoresis & Documentation Pre or Post staining of Gels with Et. Br

Melt Curve when Using SYBR Peaks in the melt curve indicate the Tm of the target or can identify non-specific PCR amplification

Quantification in q. RT-PCR üAmplification plot: Display of data collected during cycling stage of PCR amplification üBaseline: A line fit to the fluorescence levels during the initial stages üThreshold: Level of fluorescence above the baseline & within exponential phase üCycle threshold: PCR cycle no. at which fluorescence meets the threshold

Quantification in q. RT-PCR Linear Amplification Curve Standard curve w eq Standards of 5 logs (105 -fold) 10 -fold dilution >>> 3 Ct changes

Quantification in q. RT-PCR log Amplification Curve

Quantification in q. RT-PCR üStandard curve: best-fit line in a plot of Ct values from the standards plotted against standard quantities üRegression line: best-fit line from the standard curve üRegression coefficient (R 2): Indicates the closeness of fit b/w standard curve regression line & individual Ct from the standard reactions Ct= m [log(Qty)] + c m=slope= a slope of -3. 32 indicates 100% PCR efficiency

Quantification in q. RT-PCR Slope=-3. 345 R 2= 0. 995 Y-intercept=40. 645 Eff=99. 1%

Quantification in q. RT-PCR Slope=-3. 345 R 2= 0. 995 Y-intercept=40. 645 Eff=99. 1%
")
Assay Validation Performance factors üIntended use of the test (target gene, sequences & mutations) üTarget population üTest methodology üSample type

Assay Validation Sample selection guidelines üIrrespective of the prevalence of the disease/mutations/variation üAll expected sample types üSamples with all possible results üControls & calibrators

Assay Validation Laboratory/Analytical Performances üPrecision: Determines the closeness of results from multiple replicates of a sample üAccuracy: Determines the closeness of results from two different tests üReproducibility: Ability to produce same result even though under different assay condition üAnalytical specificity: To rule out non-specific amplification üAnalytical sensitivity: The lower limit of detection (Lo. D) to generate an accurate result
/Internal Positive Control (IPC) Level")
Controls: To Monitor the Performance of Test üExtraction Control (EC)/Internal Positive Control (IPC) Level of amplification ensures the sample quality üNo Template Control (NTC) Checking of contamination in PCR reagents üNegative Control (NC) Checking of non-specificity of PCR assay especially the performance of primers üPositive Control (PC) Specific amplification of target gene as well as efficiency of the PCR
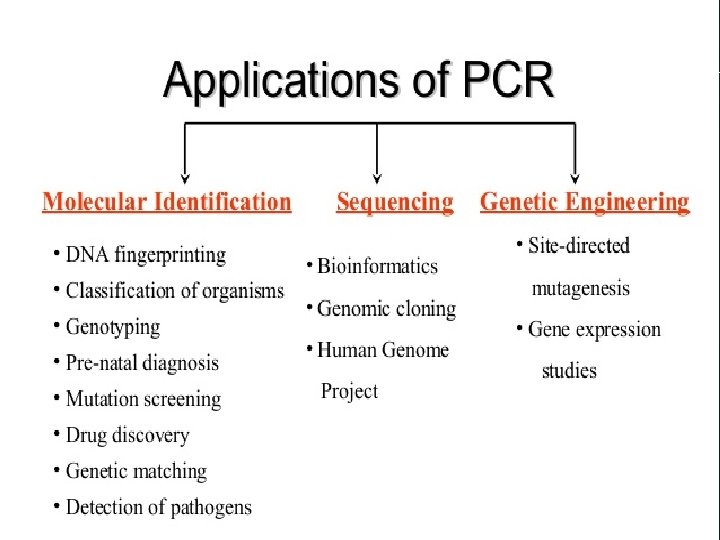

Application of PCR in Molecular Typing

Troubleshooting

Troubleshooting

Thanks…
- Slides: 34