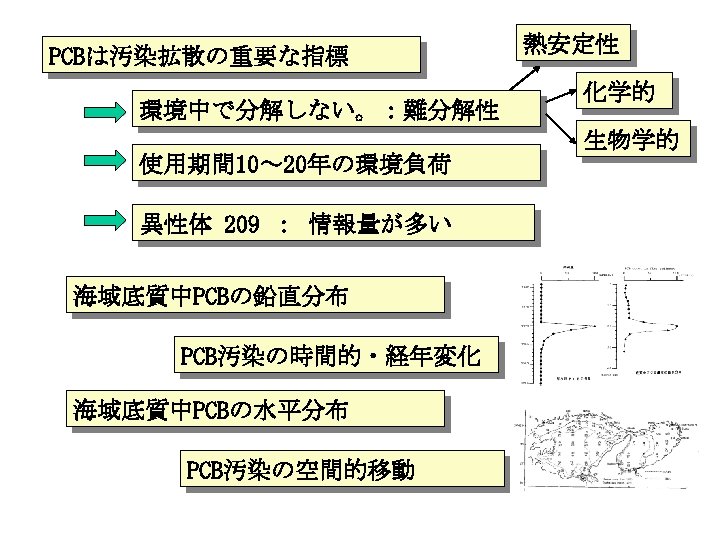
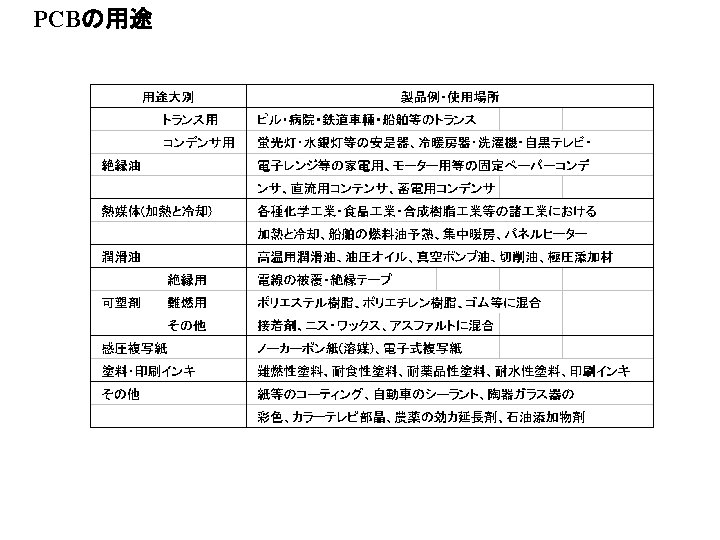
PCB PCB important index for Pollutant dispersion Stable
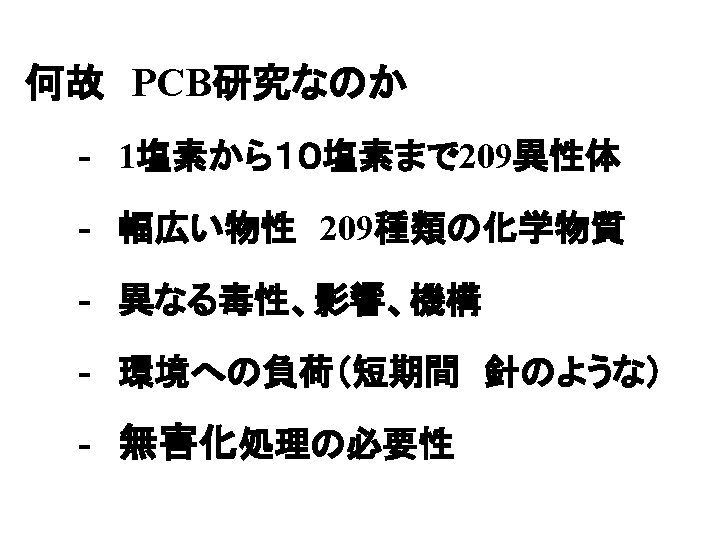

PCBは汚染拡散の重要な指標 PCB: important index for Pollutant dispersion 環境中で分解しない。:難分解性 Stable in environment : persistent 使用期間 10~ 20年の環境負荷 Environmental loading : 10 -20 years 209 congeners information 異性体 209 :: much 情報量が多い 海域底質中PCBの鉛直分布 Vertical distribution of PCB in sediment core PCB汚染の時間的・経年変化 Historical trend of PCB pollution 海域底質中PCBの水平分布 Horizontal distribution of PCB in sediment PCB汚染の空間的移動 Spatial migration of PCB Thermal 熱安定性 化学的 chemical 生物学的 biological

Production of N. C. P Annual production PCB concentration Sediment core Annual production and Vertical distribution in sediment

Production of N. C. P Annual production PCB concentration Sediment core Annual production and Vertical distribution in sediment

Horizontal distribution in sea sediment 播磨灘 nada Harima 大阪湾Bay Osaka スープ皿のような地形 like a soup dish Independent area 東半分:陸、西半分:海 western and eastern part Sea海底の地形・水深 bottom and water depth

Horizontal distribution in sea sediment Channel : fast stream sand silt sand Central part: slow stream Particle size in sea sediment

海域底質の粒度分布を考慮しない場合 Before normalization by particle size distribution coast High Low Inmost part channel High 濃度の単調減少 Harima nada Central part : High 鳴門 Low Osaka Bay NAKANO (1979) Horizontal distribution in sea sediment

海域底質の粒度分布を考慮した場合 After normalization by particle size distribution Constant恒流図と濃度分布 flow map and PCB distribution 粒径・微細粒子・比表面積で規格化 海域底質中PCBの水平分布 Horizontal distribution in sea sediment

Horizontal distribution in sea sediment 海域底質の水平分布 神戸港周辺 Around Kobe port Osaka bay 大阪湾 PCB濃度の距離減衰 PCB concentration and Distance from source
")
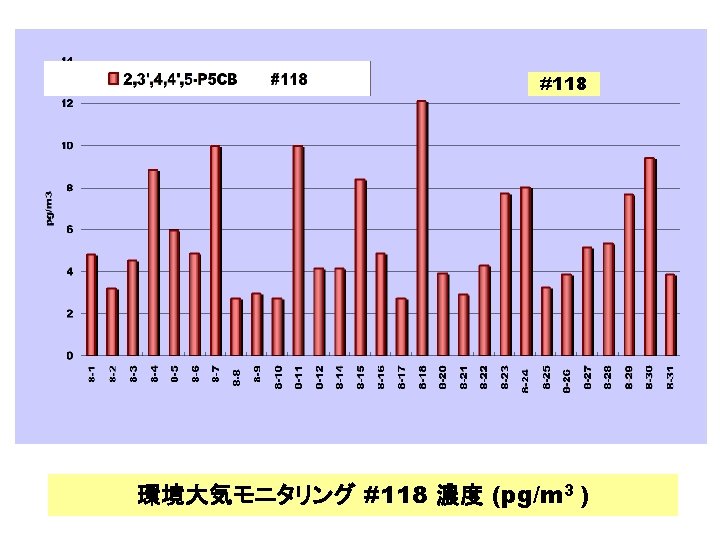
#118 Low Vol. High Vol. #105 #77 環境大気モニタリング(High Vol. ; Low Vol. )

#28 Tri-CBs #31 Tetra-CBs #74 #80 Penta-CBs #118 #99 #153 Hexa-CBs #163/ #164 Hepta-CBs #182/187 #138 #180 #170 健常人PCB血液クロマトグラム(3~7塩素)

KC-300, 400, 500, 600 equivalent mixture Pooled blood sample #28 #31 Retention Time (min. ) Congeners pattan of Tri. CBs

KC-300, 400, 500, 600 equivalent mixture Pooled blood sample #74 #80 #81 Retention Time (min. ) Congeners pattan of Tetra. CBs #77

KC-300, 400, 500, 600 equivalent mixture Pooled blood sample #118 #99 #123 #114 #105 Retention Time (min. ) Congeners pattan of Penta. CBs #126

KC-300, 400, 500, 600 equivalent mixture Pooled blood sample #153 #164 #138 #167 #156 #157 Retention Time (min. ) Congeners pattan of Hexa. CBs #169

KC-300, 400, 500, 600 equivalent mixture Pooled blood sample #182, 187 #180 #170 #189 Retention Time (min. ) Congeners pattan of Hepta. CBs

The Detected Number of PCB Congeners in Pooled Blood
 Existence Ratio")
Homologue Distribution of PCBs in Kanechlor and Pooled Blood Existence Ratio (%) Existence Ratio (%)
 Congeners Mean± 2 S.")
Levels of the predominant PCB congeners in human blood (n=24) Congeners Mean± 2 S. D. Existence Ratio* (BZ#) (ng /g-lipid) (%) #153 #180 #138 #182, 187 #118 #163, 164 #99 #74 #146 #170 #156 Sum 28. 0± 28. 0 14. 9± 16. 6 10. 4± 9. 2 8. 3± 8. 5 6. 9± 5. 9 6. 4± 6. 2 4. 7± 4. 2 4. 6± 2. 6 4. 1± 3. 7 3. 8± 4. 1 2. 8± 3. 0 22. 3 11. 8 8. 3 6. 6 5. 5 5. 1 3. 8 3. 6 3. 3 3. 0 2. 3 75. 6 * Mean is compare to total PCBs level


Trends of PCB isomeric patterns in Japanese environmental media, food, breast milk and blood in view of risk assessment Takeshi Nakano 1, Yoshimasa Konishi 2, Rie Masho 3 and Chiharu Tohyama 4

Trend of PCB Use in Japan Total 58, 000 t Amount of PCB use (t)

PCB product use in Japan 1969 -1971 KC-300 400 Ar-1242 1248 500 600 1254 1260

KC 300 Japan KC 400 Homologue pattern reflects product use KC 500 KC 600 Japan

PCB Homologue Distribution and Source Estimation

Source estimation KC300 N. C. P. KC500 Insulator capacitor Sediment A Sediment B KC400 KC600 Insulator Ship paint capacitor

To evaluate environmental risk

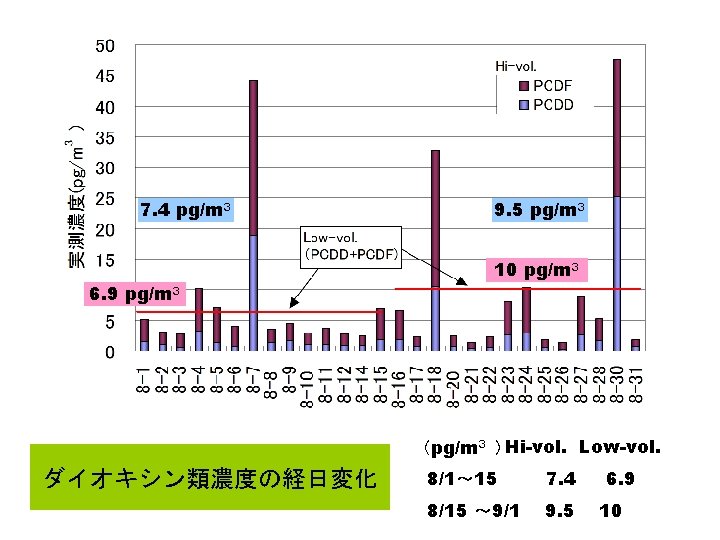
Daily variation of PCDD/Fs and PCBs in ambient air

Daily variation of Dioxin Concentration

Time trend of PCDD/F levels in ambient air
 Dioxin Emission Reduction Plan Matsumura et al, symposium of J.")
Time trend of PCDDs/PCDFs(TEQ) Dioxin Emission Reduction Plan Matsumura et al, symposium of J. Env. Chem, 2003. 6

0. 50 1997 0. 40 1998 0. 30 1999 0. 20 2000 0. 10 2001 Emission inventry (g-TEQ/year) Matsumura et al, symposium of J. Env. Chem, 2003. 6 0 1000 2000 3000 4000 5000 6000 7000 0. 00 8000 PCDDs/PCDFs(pg-TEQ/m 3) Emission inventry vs Level in air
 Matsumura et al, symposium of J. Env. Chem, 2003. 6")
Time trend of Co-PCBs(TEQ) Matsumura et al, symposium of J. Env. Chem, 2003. 6
")
Time trend of Co-PCBs(TEQ)
")
Time trend of PCB levels in ambient air (log scale)
) 1000 Ambient air 100 10 1 0. 01 1970 1975")
33 (ng/m (pg/m )) 1000 Ambient air 100 10 1 0. 01 1970 1975 1980 1985 1990 1995 2000 2005 33 Time trend of PCBs concentration in ambient air (ng/m Time trend of PCBs concentration in ambient air (pg/m ))

Time trend of PCB levels in breast milk

Time trend of breast milk levels µg / g-fat µg g-fat 0. 3 0. 2 PCB 0. 1 0 pg TEQ/g-fat 6060 pg TEQ/g-fat 40 40 Dioxins 20 20 0 0 Konishi etetal. al (2003)Organohalogen compds Konishi Year(1973 -2000)

Development of congener specific analysis for PCBs using HT 8 -PCB

Congener mono di tri tetra penta hexa hepta octa nona deca total number of isomer 3 12 24 42 46 42 24 12 3 1 209 number of peak 3 10 23 39 38 40 23 12 3 1 192
 PCB product 13 C-Tr. CB Matsumura")
GC/MS-SIM chromatogram of Tr. CB (HT 8 -PCB) PCB product 13 C-Tr. CB Matsumura et al, J. Env. Chem. (2002)
 Intensity P 5 CB 800000 PCB")
GC/MS-SIM chromatogram of Pe. CB (HT 8 -PCB) Intensity P 5 CB 800000 PCB product 400000 0 20 22 24 26 28 30 Retention Time (min) 32 34 36 38 #104 #96 #103 #100 #94 #102 #93 #98 #95 #88 #91 #121 #92 #84 #89 #90 #101 #113 #99 #112 #119 #83 #108 #86 #117 #97 #125 #116 #87 #115 #111 #85 #120 #110 #82 #124 #109 #107 #123 #106 #118 #114 #122 #105 #127 #126 Calculated Retention Time Intensity 13 C-P 5 CB 50000 13 C-Pe. CB 0 20 22 24 26 28 30 Retention Time (min) 32 Matsumura et al, J. Env. Chem. (2002) 34 36 38

Congener profiles of PCBs in environmental samples
 in environmental samples")
Congener profiles of PCBs(Di-, Tri-) in environmental samples

Congener profiles of PCBs in environmental and human samples
 in environmental and human samples")
Congener profiles of PCBs(Hexa-) in environmental and human samples
 in environmental and human samples")
Congener profiles of PCBs(Hepta-) in environmental and human samples
")
Congener profiles of PCBs in human samples (breast milk)

PCB product 25 -25 #52 25 -23 #44 #70 #66 25 -34 245 -4 #74 23 -34 #56 #60 mother milk 245 -4 #74 24 -34 #66 234 -4 #60 Isomer profiles of Te. CB

236 -25 #95 245 -25 #101 PCB product 236 -34 #110 #118 245 -24 #99 mother milk 245 -24 #99 Isomer profiles of Pe. CB #105 245 -34 #118 234 -34 #105

236 -245 PCB product #149 mother milk #153 245 -245 234 -245 #138 Isomer profiles of Hx. CB

PCB product 245 -2356 #187 #180 245 -2345 234 -2345 #170 breast milk 245 -2356 #187 Isomer profiles of Hp. CB #180 245 -2345 234 -2345 #170
")
Congener profiles of PCBs in human samples (pooled blood)

#28 #28 Tri-CBs 24 -4 #31 Tetra-CBs 245 -4 #74 #74 #80 Penta-CBs #99 #118 245 -34 #118 #99 245 -24 Hexa-CBs #153 #153 245 -245 #163/ #164 Hepta-CBs #187 #187 245 -2356 245 -234 #138 #138 245 -2345 #180 #180 #170 Chromatogram of PCB in human blood (3~7 Cl) Hirai et al, (2003) Organohalogen compounds
 Congeners Mean± 2 S.")
Levels of the predominant PCB congeners in human blood (n=24) Congeners Mean± 2 S. D. Existence Ratio* 245 -245 245 -234 245 -2356 245 -34 245 -24 245 -235 2345 -234 2345 -34 (BZ#) (ng /g-lipid) (%) #153 #180 #138 #187 #118 #163, 164 #99 #74 #146 #170 #156 Sum 28. 0± 28. 0 14. 9± 16. 6 10. 4± 9. 2 8. 3± 8. 5 6. 9± 5. 9 6. 4± 6. 2 4. 7± 4. 2 4. 6± 2. 6 4. 1± 3. 7 3. 8± 4. 1 2. 8± 3. 0 22. 3 11. 8 8. 3 6. 6 5. 5 5. 1 3. 8 3. 6 3. 3 3. 0 2. 3 75. 6 * Mean is compare to total PCBs level Hirai et al, (2003) Organohalogen compounds cumulative (%) 22. 3 34. 1 42. 4 49. 0 54. 5 59. 6 63. 4 67. 0 70. 3 73. 3 75. 6
 #99 (2, 2’, 4, 4',")
human milk/adipose tissue #74 (2, 4, 4', 5 -) #99 (2, 2’, 4, 4', 5 -) #118 (2, 3’, 4, 4', 5 -) #153 (2, 2', 4, 4', 5, 5'-) #138 (2, 2', 3, 4, 4', 5'-) #187 (2, 2', 3, 4’, 5, 5’, 6 -) PCB congeners predominant in human samples

PCB levels and Homologue profiles in Environmental samples

0. 1 -10 ng/m 3 0. 1 -10 ng/L Air Water Sediment 0. 05 -800 ng/g-dry 0. 1 -800 ng/g-wet Biota PCB levels in air, water, sediment and biota (2002, MOE Japan)

Homologue profiles of PCBs in human samples
 Air 50 45 40 35 30 25 20 15 10 5 0 Human")
abundance(%) Air 50 45 40 35 30 25 20 15 10 5 0 Human blood Water Breast milk Bird
")
Congener profiles of Tr. CB, Te. CB in human and combustion sample (A)

PCB product Combustion Breast milk PCB congeners predominant in human samples (Tr. CB, Te. CB)
")
Congener profiles of Tr. CB, Te. CB in combustion sample (B)
 #47 Tr. CB 24 -24 #51 #68 24 -26 24 -35 Te.")
(stack gas) #47 Tr. CB 24 -24 #51 #68 24 -26 24 -35 Te. CB

Congener profiles of PCB in human sample
+di-ortho-PCB Predominant PCB in product Contribution of DL-PCBs in breast milk")
12 DL-PCB(TEF)+di-ortho-PCB Predominant PCB in product Contribution of DL-PCBs in breast milk

Congener profiles of PCB in food sample
")
ng/day 1982 ng/day 2001 PCB congener profiles in food sample (Konishi et al )

Congener profiles of PCB in human sample

#153 #138 #118 #74 #180 #99 1973 #187 PCB congener composition in human breast milk #153 2000 #74 #99 #118 #138 #187 #180 PCB congener composition in human breast milk

#153 Salmon #101 #138 #118 #66 #187 #180 PCB congener composition in salmon #153 Breast milk #74 #99 #118 #138 #187 #180 PCB congener composition in human breast milk

product human #74 < #66 245 -4 24 -34 #74 > #66 245 -4 24 -34 #99 < #101 245 -24 245 -25 #99 > #101 245 -24 245 -25 #146 < #149 245 -235 245 -236 #146 > #149 245 -235 245 -236
2 -PCB, Me. SO 2 -PCB")
PCB metabolite OH-PCB, (OH)2 -PCB, Me. SO 2 -PCB

Thyroxine 4 -OH-3, 3’, 4’, 5 -tetrachlorobiphenyl Thyroxine & TTR binding OH-PCB
2 -PCB")
Aromatic epoxidation Epoxide hydrolase Formation mechanism of OH-PCB (OH)2 -PCB
 OH-Tr. CB OH-Te. CB 4 -OH-CB-107 ? OH-Tr. CB OH-Pe. CB")
Fish (Sea Bass) OH-Tr. CB OH-Te. CB 4 -OH-CB-107 ? OH-Tr. CB OH-Pe. CB Sediment OH-Te. CB OH-Pe. CB Chromatogram of PCB-OH by methylation (Sakiyama et al. J. Env. Chem. )

To All participants from Funky Japanese guy with camera. You can see your pictures soon. http: //ee-net. ne. jp/illinois/
")
Time trend of Co-PCBs(TEQ)
) 1000 Ambient air 100 10 1 0. 01 1970 1975")
33 (ng/m (pg/m )) 1000 Ambient air 100 10 1 0. 01 1970 1975 1980 1985 1990 1995 2000 2005 33 Time trend of PCBs concentration in ambient air (ng/m Time trend of PCBs concentration in ambient air (pg/m ))

Time trend of breast milk levels µg / g-fat µg g-fat 0. 3 0. 2 PCB 0. 1 0 pg TEQ/g-fat 6060 pg TEQ/g-fat 40 40 Dioxins 20 20 0 0 Konishi etetal. al (2003)Organohalogen compds Konishi Year(1973 -2000)
2 Guillemot eggs Stora Karlsö, Sweden 1 Log")
Lake trout, Lake Superior (Canada-U. S. )2 Guillemot eggs Stora Karlsö, Sweden 1 Log ΣPCBs, ng/g wet wt. Some successes. . . 78 1. Swedish Environmental Protection Agency, 2012. National Implementation Plan for the Stockholm Convention, Report 6298. 2. Bhavsar, S. P. et al. , 2007. J. Great Lakes Res. 33, 592 -605. 82 86 90 94 98 02 06
2 Some successes. . . but further to")
Lake trout, Lake Superior (Canada-U. S. )2 Some successes. . . but further to go 1. Swedish Environmental Protection Agency, 2012. National Implementation Plan for the Stockholm Convention, Report 6298. Log ΣPCBs, ng/g wet wt. Guillemot eggs Stora Karlsö, Sweden 1 78 82 86 90 94 98 02 06 2. Bhavsar, S. P. et al. , 2007. J. Great Lakes Res. 33, 592 -605. 90 92 94 96 98 00 02 04 06

POPs Enantioselective analysis
: the property of having")
Enantiomers: Mirror-Image Molecules Chirality (from the Greek word for “hand”): the property of having a non-superimposable mirror image. Cl Cl Cl Cl trans-chlordane

Enantiomers: Mirror-Image Molecules § Most chiral compounds are produced with a 1: 1 proportion of enantiomers (racemic). § Enantiomer fraction, EF = (+)/[(+) + (−)] = 0. 500. § Enantiomer proportions are not changed by physical processes (deposition, volatilisation, leaching) or abiotic reactions (hydrolysis, photolysis, OH radical attack). § Enzymes are chiral and react preferentially with one enantiomer. Non-racemic enantiomer proportions (EF ≠ 0. 500) mark biological degradation/metabolism in soil, water, organisms.

Target Analytes Technical compounds trans – cis – Chlordane Heptachlor o, p’ - DDT a - HCH Metabolites o, p’ - DDD Oxychlordane Heptachlor epoxide o, p’ - DDE
 Column : BGB-172*(BGB Analytik) 30 m, 0. 25")
HRGC/HRMS GC Device : HP-6890 N(HP) Column : BGB-172*(BGB Analytik) 30 m, 0. 25 mm i. d. film thickness 0. 25μm Carrier Gas : He 1. 5 m. L/min Temperature Program : 120℃ (2 min) → 2℃/min → 250℃ (3 min) Injector temperature : 230℃ Injection Volume: 2μL MS Device :JMS-800 D (JEOL) Ionization:EI Ion source temperature: 260℃ Resolution : >10, 000 *BGB-172(20% tert-butyldimethylsilyl-b-cyclodextrin dissolved in 15% diphenylpolysiloxane and 85% dimethylpolysiloxane)
exo endo standard P 19 -2 North Atlantic Ocean exo EF=0. 68")
Heptachlor epoxide (+)exo endo standard P 19 -2 North Atlantic Ocean exo EF=0. 68 Japan Sea P 19 -JⅡF exo EF=0. 67 (-)exo
trans (-)trans (+)cis (-)cis Technical chlordane MC-4 P 19 -2 trans EF=0.")
Chlordane MC-5 (+)trans (-)trans (+)cis (-)cis Technical chlordane MC-4 P 19 -2 trans EF=0. 49 cis EF=0. 54 North Atlantic Ocean trans EF=0. 46 cis EF=0. 50 Japan Sea P 19 -JⅢF
 (+) g a (-) (+) α EF=0. 45 P 19 -8")
HCH a (-) (+) g a (-) (+) α EF=0. 45 P 19 -8 standard North Atlantic Ocean b g Japan Sea P 19 -JⅡ a (-) (+) α EF=0. 42 g b b
")
Separation of chlordanes on achiral and chiral GC columns TC CC TN DB-5 (achiral) TC = trans-chlordane (chiral) CC = cis-chlordane (chiral) TN = trans-nonachlor (achiral) Ion 410 Ion 444 TN TC (+) (–) CC (+) (–) Betadex-120 (chiral) Ion 410 Ion 444

Identifying “chemical fossils” Ø Racemic: freshly released or protected from microbial degradation Ø Nonracemic: microbially degraded. emission of racemic chemical emission of degraded residues mix in air soil, water Bidleman, T. F. , Falconer, R. L. 1999. Environ. Sci. Technol. 33, 206 A-209 A.

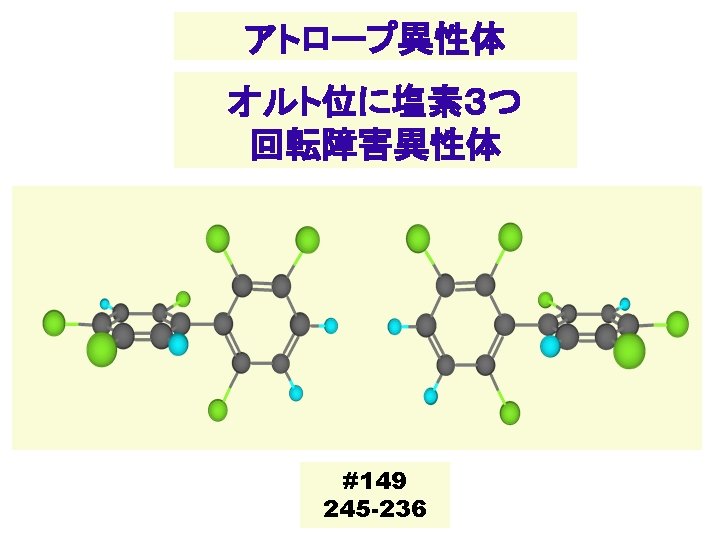
Chiral PCBs Toda, M. , Matsumura, C. , Tsurukawa, M. , Okuno, T. , Nakano, T. , Inoue, Y. , Mori, T. 2012. Absolute configuration of atropisomeric PCB 183 enantiomerically enriched in human samples. J. Phys. Chem. A. , in press. Ø 19 PCB congeners contain 3 or 4 ortho-substituted chlorines and have high energy barriers that prevent rotation of the two rings. ØTechnically called atropisomers instead of enantiomers. ØSelective metabolism in humans, wildlife, soils, sediments.
")
Background Global Technical HCH usage Japan (Yi-Fan Li etc)
 China")
Background POPs usage in Japan and China Japan Chlordane 16, 000 (~ 1986) China 9, 000 (1950~) Toxaphene - 20, 660 (1970~ 1985) HCB - 79, 278 (1958~ 2004) DDT 53, 000 (1948~ 1970) 400, 000 (1950~) 20% of the total world usage HCH 389, 000 (1948~ 1971) 49, 000 (~ 1983) 33% of the total world usage
 2009 Oct")
HCHs level and profile in sea water (Kunugi) 2009 Oct
 2009 Oct 2009 Mar 2009 Aug 2007")
HCHs conc. in sea water (Japan sea) 2009 Oct 2009 Mar 2009 Aug 2007 Dec

HCHs isomer profile 2009 Oct 3 2 1 Pg/m 3 HCHs in sea water HCHs in air

Enantiomer of POPs Some POPs are chiral and present as racemates in the technical product. Cl Cl Cl Cl o. p’-DDT H Cl H H Cl Cl Cl H Cl trans-chlordane Cl Cl Cl H H Cl Cl Cl C* C* Cl Cl H H Cl Cl Cl H Atropisomer of PCB alpha-HCH 2, 2’, 3, 3’, 4, 6’-Hx. CB(#132) Cl
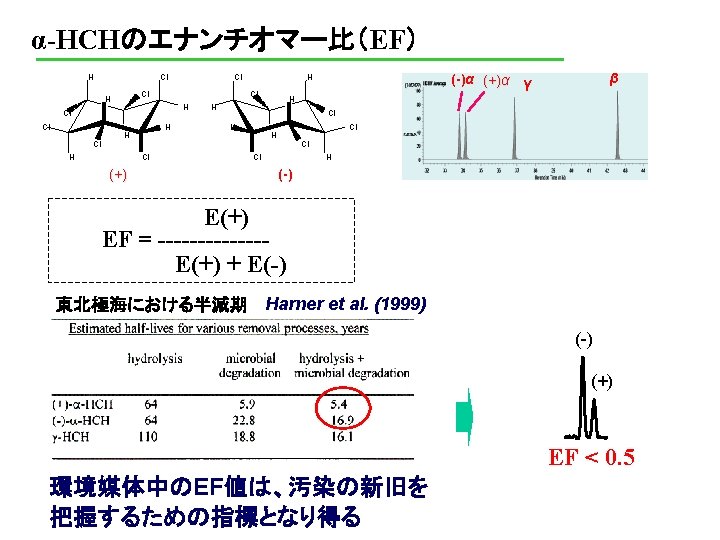
 EF= E(+) or E(+) + E(-) E(+): amount of (+)enantiomer E(-) :")
Enantiomer Fraction(EF) EF= E(+) or E(+) + E(-) E(+): amount of (+)enantiomer E(-) : amount of (-)enantiomer EF= (-) (+) E 1 + E 2 E 1: amount of the first enantiomer E 2: amount of the second enantiomer (+)(-) E 1 (+) (-)
 Ave. 2300")
Distribution of HCHs concentration in surface sea water (2010) Ave. 2300

chiral PCB Enantioselective analysis

Toda, Matsumura, Tsurukawa, Okuno, Nakano, Inoue, Mori, Journal of Physical Chemistry A. DOI: http: //dx. doi. org/10. 1021/jp 306363 n

38℃ 30℃ PCB-139 1mL/min 40 cm カラム温度 RT-1 RT-2 10 C 9. 522 10. 696 15 C 9. 065 10. 079 20 C 8. 701 9. 58 25 C 8. 367 9. 142 30 C 8. 023 8. 699 35 C 7. 679 8. 271 38 C 7. 56 8. 11 40 C 7. 401 7. 924 25℃ 15℃ Fig. 3 HPLCカラム温度とキラル分離 (PCB-139)

Toda, Matsumura, Tsurukawa, Okuno, Nakano, Inoue, Mori, Journal of Physical Chemistry A. DOI: http: //dx. doi. org/10. 1021/jp 306363 n
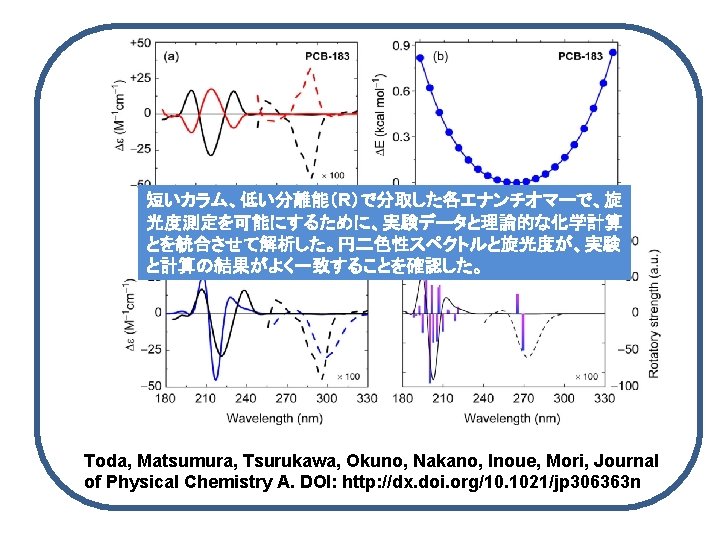
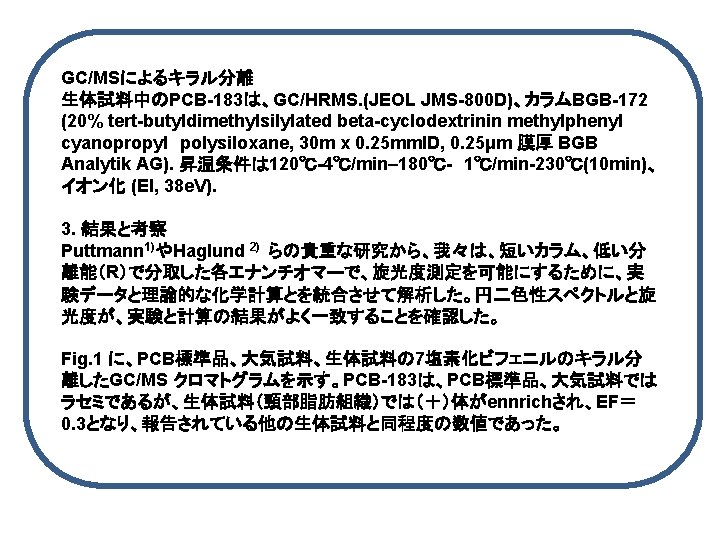
と(+)を同定し、EF( Enantiomeric Fraction)値を示した。 enantioselectiveな毒性評価や各種実験に使用できる体制が 構築された i + Fig. 1 GC/MS chromatogram for")
i + 初めて、生体試料中のPCB-183の(-)と(+)を同定し、EF( Enantiomeric Fraction)値を示した。 enantioselectiveな毒性評価や各種実験に使用できる体制が 構築された i + Fig. 1 GC/MS chromatogram for enantioselective analysis

Table 1. Parameters of HPLC and GC for Enantiomer Separation of PCBs 183, 171, 132, 135, 84. a HPLC GC-MS PCBs τ0, (min) τ1, (min) τ2, (min) W 1 W 2 α Rs 183 4. 04 7. 58 8. 03 0. 25 0. 27 1. 13 1. 72 171 4. 04 6. 46 7. 04 0. 23 0. 28 1. 24 2. 25 132 4. 04 7. 28 7. 54 0. 27 0. 32 1. 08 0. 878 135 4. 04 6. 47 7. 04 0. 21 0. 27 1. 23 2. 36 84 4. 04 8. 44 8. 92 0. 29 0. 35 1. 11 1. 51 183 2. 00 41. 4 41. 6 0. 15 0. 18 1. 00 1. 21 171 2. 00 45. 4 45. 7 0. 16 0. 19 1. 01 1. 51 132 2. 00 37. 5 37. 8 0. 12 0. 13 1. 01 2. 36 135 2. 00 32. 3 32. 5 0. 12 1. 01 1. 53 84 2. 00 29. 1 0. 09 0. 10 1. 01 1. 70 aα = (τ2 - τ0) / (τ1 - τ0). Rs=2 (τ2 - τ1) / (W 1 + W 2).

Fig. 2 HPLC traces for the optical resolution of PCB-135.

Toda, Matsumura, Tsurukawa, Okuno, Nakano, Inoue, Mori, Journal of Physical Chemistry A. DOI: http: //dx. doi. org/10. 1021/jp 306363 n

Toda, Matsumura, Tsurukawa, Okuno, Nakano, Inoue, Mori, Journal of Physical Chemistry A. DOI: http: //dx. doi. org/10. 1021/jp 306363 n

What is enantiomer? enantiomer is one of two stereoisomers that are mirror images of each other that are not identical, much as one's left and right hands are "the same" but opposite.
 racemates metabolism technical products (+) (-) POPs in the oceans non-racemic")
Enantiomer Fraction (EF) racemates metabolism technical products (+) (-) POPs in the oceans non-racemic residues (-) (+) (-) EF = 0. 5 E(+) EF = -------E(+)+ E(-) (+) EF < 0. 5 EF > 0. 5 E(+) : (+) enantiomer peak area E(-) : (-) enantiomer peak area The EF variation may distinguish POPs transfer of current use and that of past applications.

To identify the behavior of POPs Enantiomeric compositions of POPs in seawater were investigated The results of Enantioselective analysis were shown using Enantiomer Fraction (EF). for tracking and apportioning chemical movement between environmental compartments for investigating microbial degradation processes.
 Changes in physicochemical process, the EF value does not change. Changes in")
Enantiomer Fraction(EF) Changes in physicochemical process, the EF value does not change. Changes in metabolic process, the EF value changes. It is possible to distinguish between newly caused pollution and old pollution by monitoring EF

Enantioselective determination of chiral PCBs in Spanish breast milk samples by heart-cut MDGC, Luisa R Bordajandi, Maria Jose Gonzalez (2005 ) : Organohalogen Compounds. 67, 1361 -

Enantiomeric fraction of PCB 91, 95 and 149 in tissues and blood from soil extracttreated animals PCB-91 PCB-95 PCB-149 Chlorofen n. d. 0. 5 soil 0. 46 0. 5 Adipose 0. 73, n=1 0. 66, n=2 0. 50± 0. 04 (0. 62, n=1) (0. 53, n=1) (0. 48, n=2) Brain n. d. Heart n. d. (0. 53, n=1) Kidney n. d. 0. 52± 0. 04 0. 47, n=1 0. 52± 0. 04 (0. 55, n=2) Liver n. d. (0. 54, n=2) Lung n. d. 0. 47, n=2 Skin n. d. 0. 54, n=1 0. 49± 0. 04 (0. 41, n=1) Spleen n. d. 0. 51, n=2 0. 54± 0. 03 (0. 56, n=1) (0. 54± 0. 04) Whole. Blood n. d. 0. 52, n=1 Serum n. d. 0. 06, n=2 DISTRIBUTION OF CHIRAL PCBs IN SELECTED TISSUES IN THE LABORATORY RAT , Hans-Joachim Lehmler, et al (2004): Organohalogen Compounds. 66, 443 -

PFCs Ca代謝
 6 5 4 3 2 1")
Initial 1 day 7 Plasma Ca conc. (mg/dl) 6 5 4 3 2 1 0 PFOA PFHx. A

媒体別 異性体比率 human shell #153/#138 ratio water

 included in 15 type of standard mixture solutions")
Table 2 PCB congeners (IUPAC number) included in 15 type of standard mixture solutions
 in (a) KC-300,")
Fig. 1 -2 Average Mass Chromatogram of dichlorinatedbiphenyl (D 2 CB) in (a) KC-300, 400, 500, 600 equivalent mixture solution and (b) all 209 PCB standard mixture solution. 環境化学, 12(4), (2002) 印刷中
 in (a) KC-300,")
Fig. 1 -3 Average Mass Chromatogram of trichlorinatedbiphenyl (T 3 CB) in (a) KC-300, 400, 500, 600 equivalent mixture solution and (b) all 209 PCB standard mixture solution. 環境化学, 12(4), (2002) 印刷中
 in (a) KC-300,")
Fig. 1 -4 Average Mass Chromatogram of tetrachlorinatedbiphenyl (T 4 CB) in (a) KC-300, 400, 500, 600 equivalent mixture solution and (b) all 209 PCB standard mixture solution. 環境化学, 12(4), (2002) 印刷中
 in (a) KC-300,")
Fig. 1 -5 Average Mass Chromatogram of pentachlorinatedbiphenyl (P 5 CB) in (a) KC-300, 400, 500, 600 equivalent mixture solution and (b) all 209 PCB standard mixture solution. 環境化学, 12(4), (2002) 印刷中
 #99 (2, 2’, 4, 4',")
human milk/adipose tissue #74 (2, 4, 4', 5 -) #99 (2, 2’, 4, 4', 5 -) #118 (2, 3’, 4, 4', 5 -) #153 (2, 2', 4, 4', 5, 5'-) #138 (2, 2', 3, 4, 4', 5'-) #187 (2, 2', 3, 4’, 5, 5’, 6 -) PCB congeners predominant in biological samples
- Slides: 154