
PC Industry Overview and Outlook Buckeye Actuarial Continuing
P/C Industry Overview and Outlook Buckeye Actuarial Continuing Education October 19, 2018 James Lynch, FCAS MAAA, chief actuary Insurance Information Institute 110 William Street New York, NY 10038 212. 346. 5533 jamesl@iii. org www. iii. org

I. I. I. Mission Statement Improving public understanding of insurance. . . …what it does and how it works 2
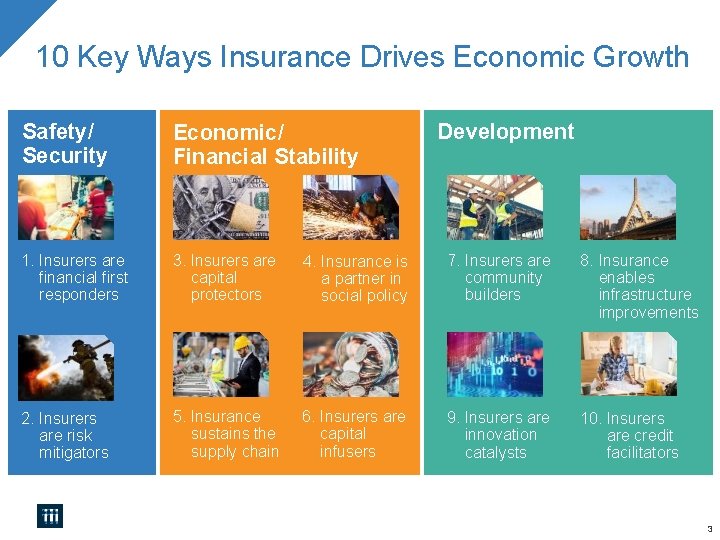
10 Key Ways Insurance Drives Economic Growth Safety/ Security Economic/ Financial Stability 1. Insurers are financial first responders 3. Insurers are capital protectors 4. Insurance is a partner in social policy 7. Insurers are community builders 8. Insurance enables infrastructure improvements 2. Insurers are risk mitigators 5. Insurance sustains the supply chain 6. Insurers are capital infusers 9. Insurers are innovation catalysts 10. Insurers are credit facilitators Development 3

Financial Results Light, Favorable Winds Buoy Results
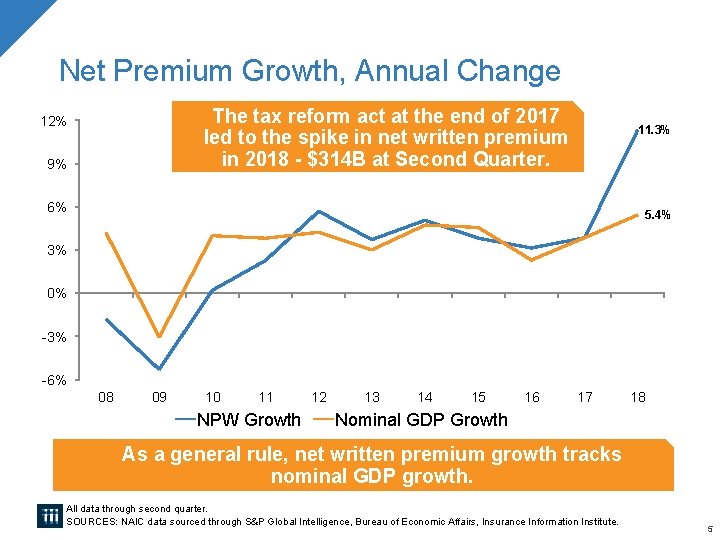
Net Premium Growth, Annual Change The tax reform act at the end of 2017 12% 11. 3% led to the spike in net written premium in 2018 - $314 B at Second Quarter. 9% 6% 5. 4% 3% 0% -3% -6% 08 09 10 11 NPW Growth 12 13 14 15 16 17 18 Nominal GDP Growth As a general rule, net written premium growth tracks nominal GDP growth. All data through second quarter. SOURCES: NAIC data sourced through S&P Global Intelligence, Bureau of Economic Affairs, Insurance Information Institute. 5
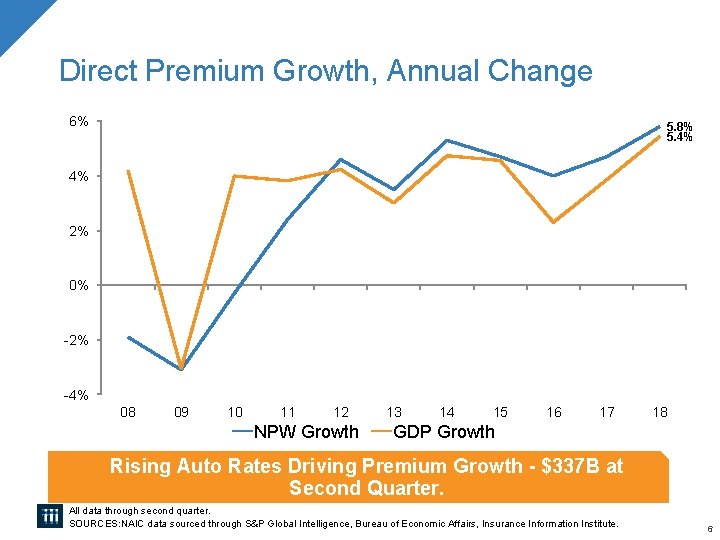
Direct Premium Growth, Annual Change 6% 5. 8% 5. 4% 4% 2% 0% -2% -4% 08 09 10 11 12 NPW Growth 13 14 15 16 17 18 GDP Growth Rising Auto Rates Driving Premium Growth - $337 B at Second Quarter. All data through second quarter. SOURCES: NAIC data sourced through S&P Global Intelligence, Bureau of Economic Affairs, Insurance Information Institute. 6
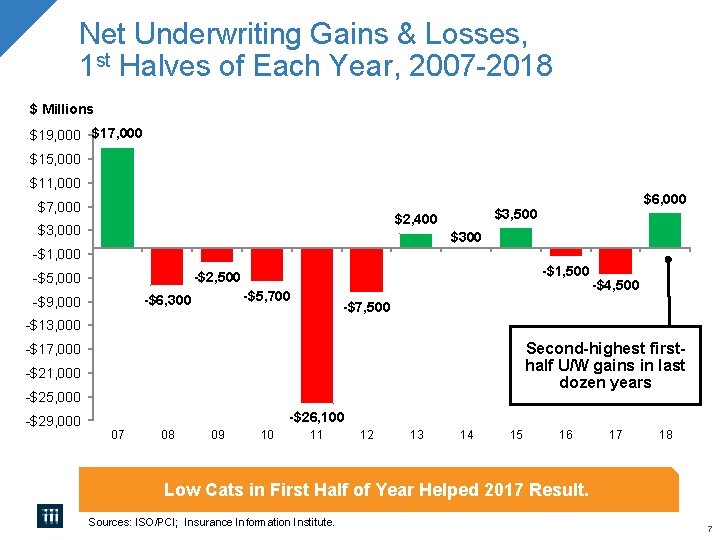
Net Underwriting Gains & Losses, 1 st Halves of Each Year, 2007 -2018 $ Millions $19, 000 $17, 000 $15, 000 $11, 000 $7, 000 $3, 500 $2, 400 $3, 000 $6, 000 $300 -$1, 000 -$1, 500 -$2, 500 -$5, 000 -$5, 700 -$6, 300 -$9, 000 -$4, 500 -$7, 500 -$13, 000 Second-highest firsthalf U/W gains in last dozen years -$17, 000 -$21, 000 -$25, 000 -$29, 000 -$26, 100 07 08 09 10 11 12 13 14 15 16 17 18 Low Cats in First Half of Year Helped 2017 Result. Sources: ISO/PCI; Insurance Information Institute. 7
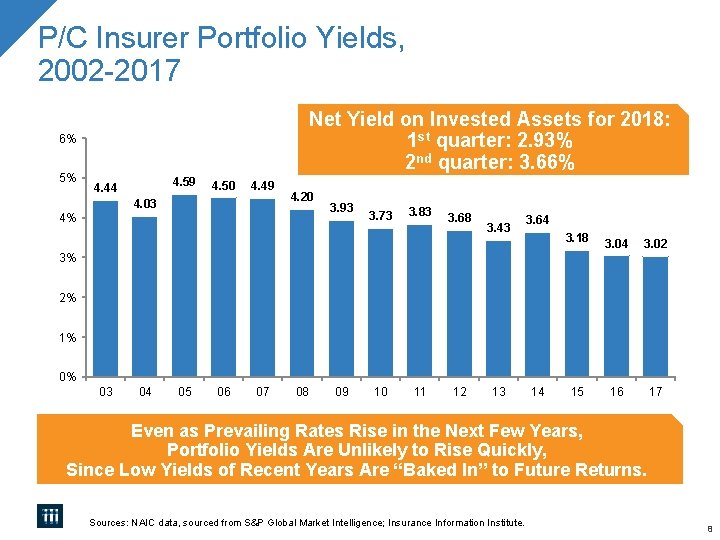
P/C Insurer Portfolio Yields, 2002 -2017 Net Yield on Invested Assets for 2018: 1 st quarter: 2. 93% 2 nd quarter: 3. 66% 6% 5% 4. 59 4. 44 4. 50 4. 49 4. 03 4. 20 4% 3. 93 3. 73 3. 83 3. 68 3. 43 3. 64 3. 18 3. 04 3. 02 15 16 17 3% 2% 1% 0% 03 04 05 06 07 08 09 10 11 12 13 14 Even as Prevailing Rates Rise in the Next Few Years, Portfolio Yields Are Unlikely to Rise Quickly, Since Low Yields of Recent Years Are “Baked In” to Future Returns. Sources: NAIC data, sourced from S&P Global Market Intelligence; Insurance Information Institute. 8
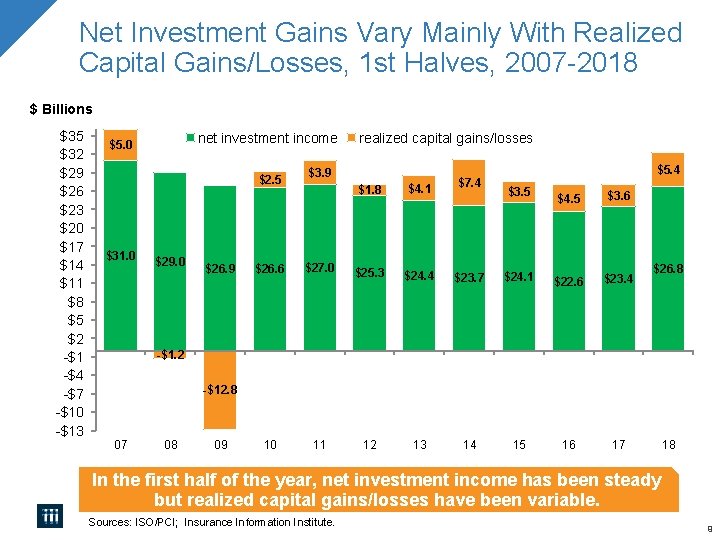
Net Investment Gains Vary Mainly With Realized Capital Gains/Losses, 1 st Halves, 2007 -2018 $ Billions $35 $32 $29 $26 $23 $20 $17 $14 $11 $8 $5 $2 -$1 -$4 -$7 -$10 -$13 net investment income $5. 0 $2. 5 $31. 0 $29. 0 $26. 9 realized capital gains/losses $3. 9 $26. 6 $27. 0 10 11 $1. 8 $4. 1 $7. 4 $25. 3 $24. 4 $23. 7 12 13 14 $5. 4 $3. 5 $4. 5 $3. 6 $24. 1 $22. 6 $23. 4 15 16 17 $26. 8 -$1. 2 -$12. 8 07 08 09 18 In the first half of the year, net investment income has been steady but realized capital gains/losses have been variable. Sources: ISO/PCI; Insurance Information Institute. 9
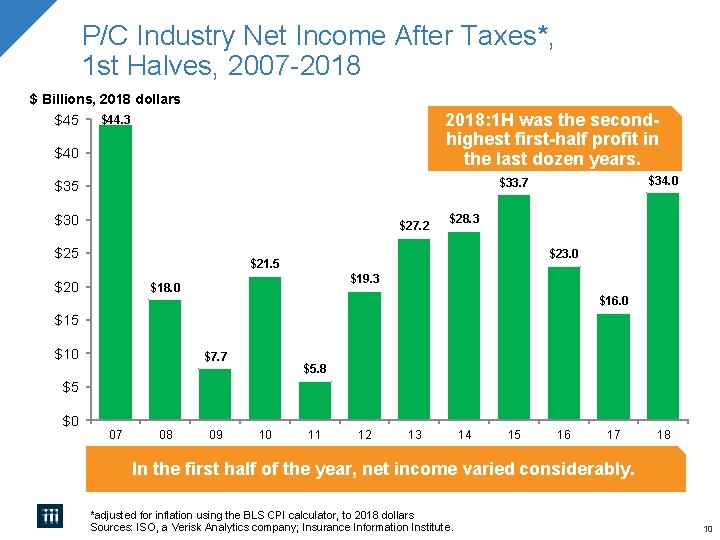
P/C Industry Net Income After Taxes*, 1 st Halves, 2007 -2018 $ Billions, 2018 dollars $45 2018: 1 H was the secondhighest first-half profit in the last dozen years. $44. 3 $40 $34. 0 $33. 7 $35 $30 $27. 2 $25 $28. 3 $23. 0 $21. 5 $20 $19. 3 $18. 0 $16. 0 $15 $10 $7. 7 $5. 8 $5 $0 07 08 09 10 11 12 13 14 15 16 17 18 In the first half of the year, net income varied considerably. *adjusted for inflation using the BLS CPI calculator, to 2018 dollars Sources: ISO, a Verisk Analytics company; Insurance Information Institute. 10
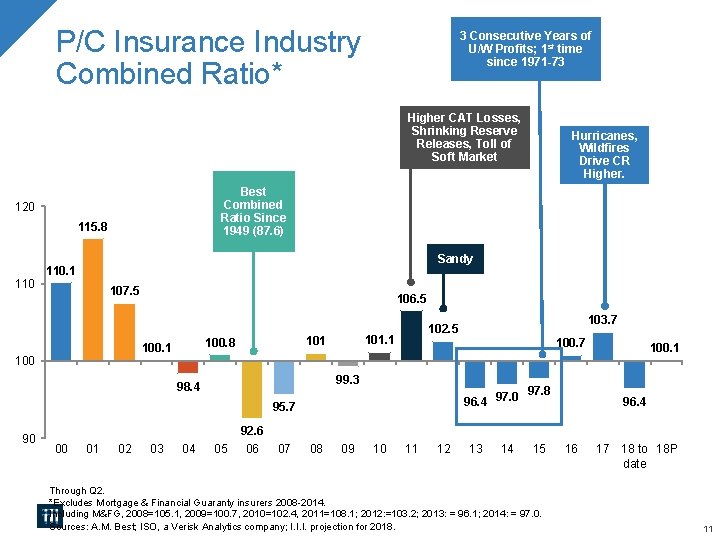
P/C Insurance Industry Combined Ratio* 3 Consecutive Years of U/W Profits; 1 st time since 1971 -73 Higher CAT Losses, Shrinking Reserve Releases, Toll of Soft Market Hurricanes, Wildfires Drive CR Higher. Best Combined Ratio Since 1949 (87. 6) 120 115. 8 Sandy 110. 1 110 107. 5 106. 5 101. 1 100. 8 100. 1 103. 7 102. 5 100. 7 100. 1 100 99. 3 98. 4 96. 4 97. 0 95. 7 90 97. 8 96. 4 92. 6 00 01 02 03 04 05 06 07 08 09 10 11 12 13 14 15 Through Q 2. *Excludes Mortgage & Financial Guaranty insurers 2008 -2014. Including M&FG, 2008=105. 1, 2009=100. 7, 2010=102. 4, 2011=108. 1; 2012: =103. 2; 2013: = 96. 1; 2014: = 97. 0. Sources: A. M. Best; ISO, a Verisk Analytics company; I. I. I. projection for 2018. 16 17 18 to 18 P date 11
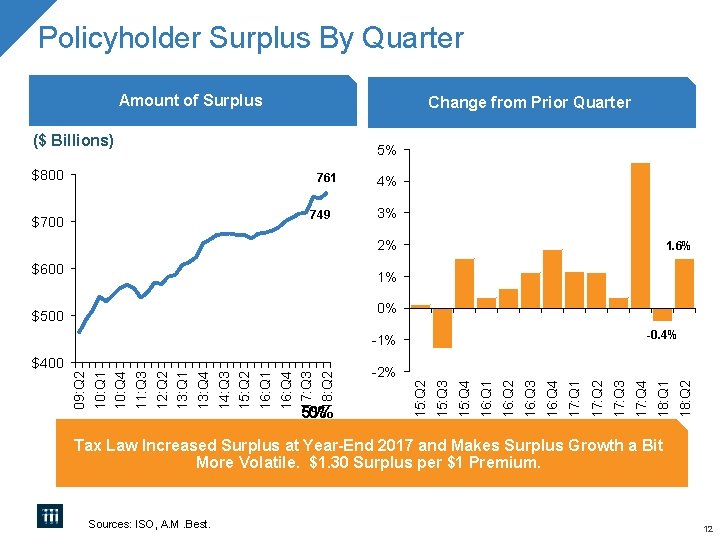
Policyholder Surplus By Quarter Amount of Surplus Change from Prior Quarter ($ Billions) $800 5% 761 749 $700 4% 3% 2% $600 1. 6% 1% 0% -0. 4% -1% 18: Q 2 18: Q 1 17: Q 3 17: Q 2 17: Q 1 16: Q 4 16: Q 3 16: Q 2 16: Q 1 15: Q 4 15: Q 3 5% 0% -2% 15: Q 2 09: Q 2 10: Q 1 10: Q 4 11: Q 3 12: Q 2 13: Q 1 13: Q 4 14: Q 3 15: Q 2 16: Q 1 16: Q 4 17: Q 3 18: Q 2 $400 17: Q 4 $500 Tax Law Increased Surplus at Year-End 2017 and Makes Surplus Growth a Bit 12 More Volatile. $1. 30 Surplus per $1 Premium. Sources: ISO, A. M. Best. 12

Ohio Results An Industry Prospers
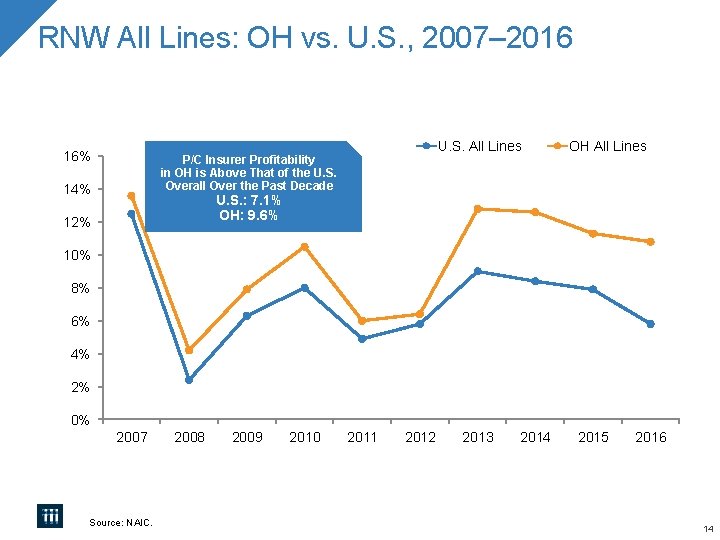
RNW All Lines: OH vs. U. S. , 2007– 2016 16% U. S. All Lines P/C Insurer Profitability in OH is Above That of the U. S. Overall Over the Past Decade 14% OH All Lines U. S. : 7. 1% OH: 9. 6% 12% 10% 8% 6% 4% 2% 0% 2007 Source: NAIC. 2008 2009 2010 2011 2012 2013 2014 2015 2016 14
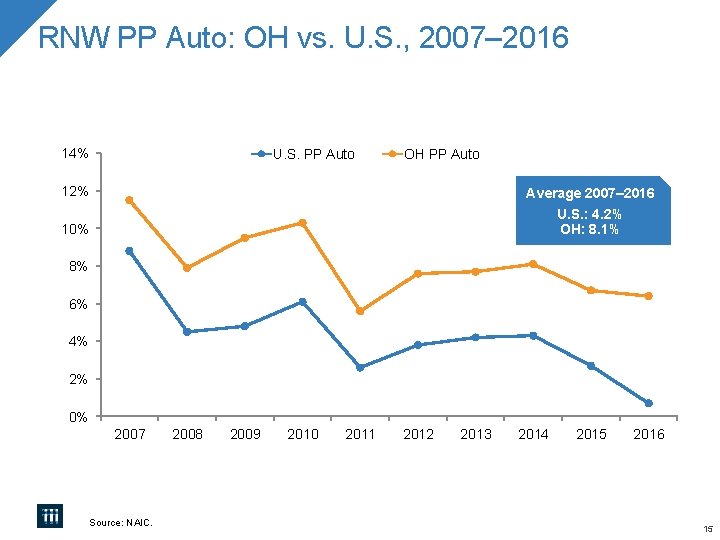
RNW PP Auto: OH vs. U. S. , 2007– 2016 14% U. S. PP Auto OH PP Auto 12% Average 2007– 2016 10% U. S. : 4. 2% OH: 8. 1% 8% 6% 4% 2% 0% 2007 Source: NAIC. 2008 2009 2010 2011 2012 2013 2014 2015 2016 15
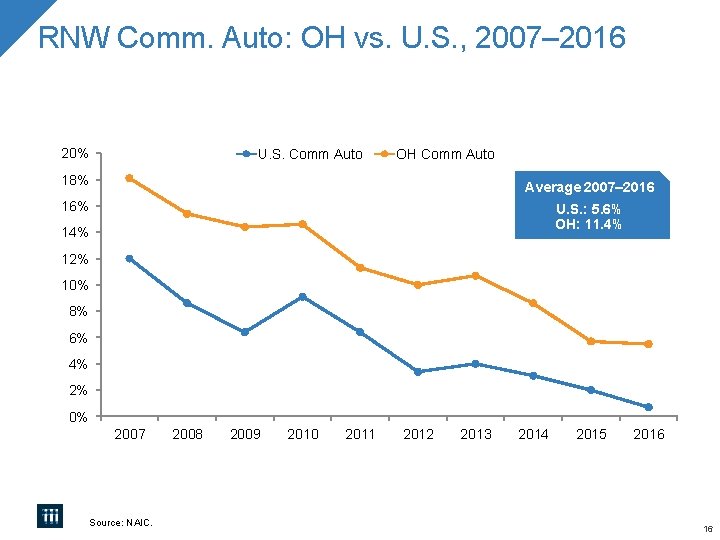
RNW Comm. Auto: OH vs. U. S. , 2007– 2016 20% U. S. Comm Auto OH Comm Auto 18% Average 2007– 2016 16% U. S. : 5. 6% OH: 11. 4% 12% 10% 8% 6% 4% 2% 0% 2007 Source: NAIC. 2008 2009 2010 2011 2012 2013 2014 2015 2016 16
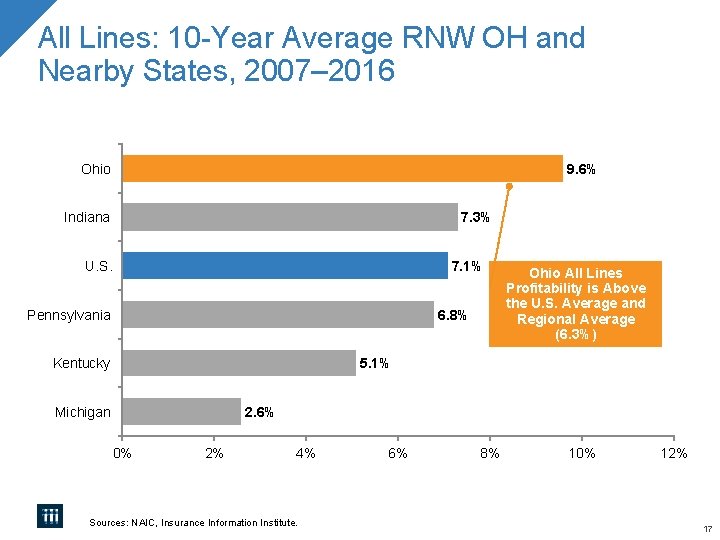
All Lines: 10 -Year Average RNW OH and Nearby States, 2007– 2016 Ohio 9. 6% Indiana 7. 3% U. S. 7. 1% Pennsylvania 6. 8% Kentucky Ohio All Lines Profitability is Above the U. S. Average and Regional Average (6. 3%) 5. 1% Michigan 2. 6% 0% 2% 4% Sources: NAIC, Insurance Information Institute. 6% 8% 10% 12% 17
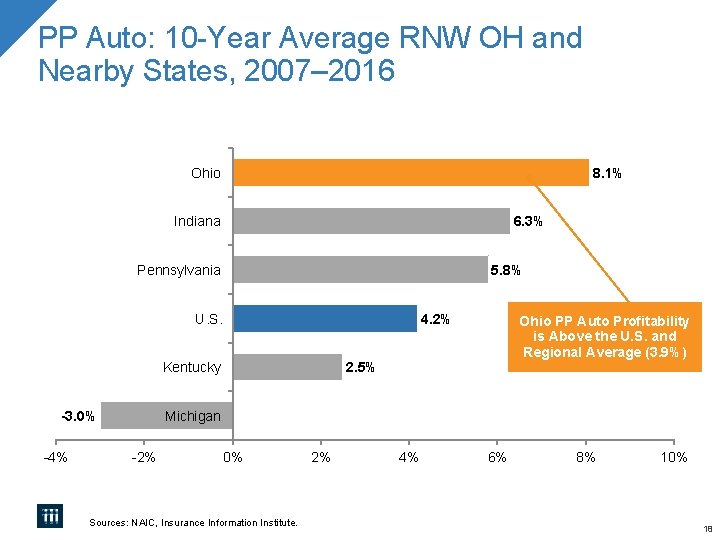
PP Auto: 10 -Year Average RNW OH and Nearby States, 2007– 2016 Ohio 8. 1% Indiana 6. 3% Pennsylvania 5. 8% U. S. 4. 2% Kentucky -3. 0% -4% Ohio PP Auto Profitability is Above the U. S. and Regional Average (3. 9%) 2. 5% Michigan -2% 0% Sources: NAIC, Insurance Information Institute. 2% 4% 6% 8% 10% 18
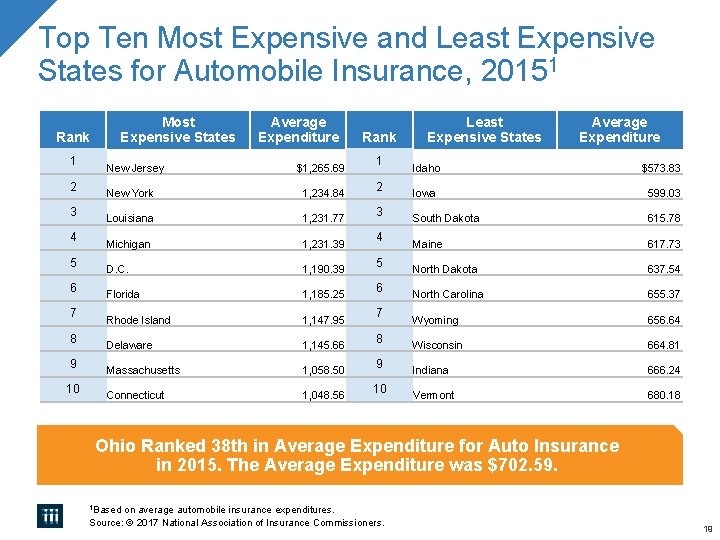
Top Ten Most Expensive and Least Expensive States for Automobile Insurance, 20151 Rank 1 2 3 4 5 6 7 8 9 10 Most Expensive States New Jersey Average Expenditure $1, 265. 69 New York 1, 234. 84 Louisiana 1, 231. 77 Michigan 1, 231. 39 D. C. 1, 190. 39 Florida 1, 185. 25 Rhode Island 1, 147. 95 Delaware 1, 145. 66 Massachusetts 1, 058. 50 Connecticut 1, 048. 56 Rank 1 2 3 4 5 6 7 8 9 10 Least Expensive States Average Expenditure Idaho $573. 83 Iowa 599. 03 South Dakota 615. 78 Maine 617. 73 North Dakota 637. 54 North Carolina 655. 37 Wyoming 656. 64 Wisconsin 664. 81 Indiana 666. 24 Vermont 680. 18 Ohio Ranked 38 th in Average Expenditure for Auto Insurance in 2015. The Average Expenditure was $702. 59. 1 Based on average automobile insurance expenditures. Source: © 2017 National Association of Insurance Commissioners. 19
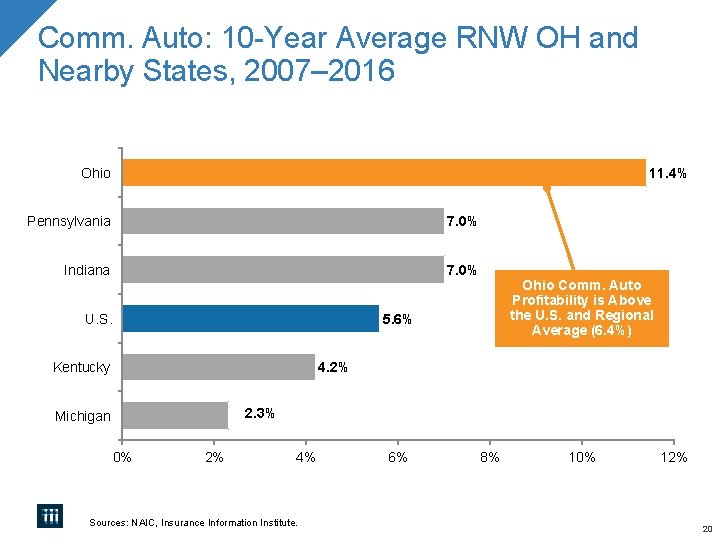
Comm. Auto: 10 -Year Average RNW OH and Nearby States, 2007– 2016 Ohio 11. 4% Pennsylvania 7. 0% Indiana 7. 0% U. S. Ohio Comm. Auto Profitability is Above the U. S. and Regional Average (6. 4%) 5. 6% Kentucky 4. 2% 2. 3% Michigan 0% 2% 4% Sources: NAIC, Insurance Information Institute. 6% 8% 10% 12% 20
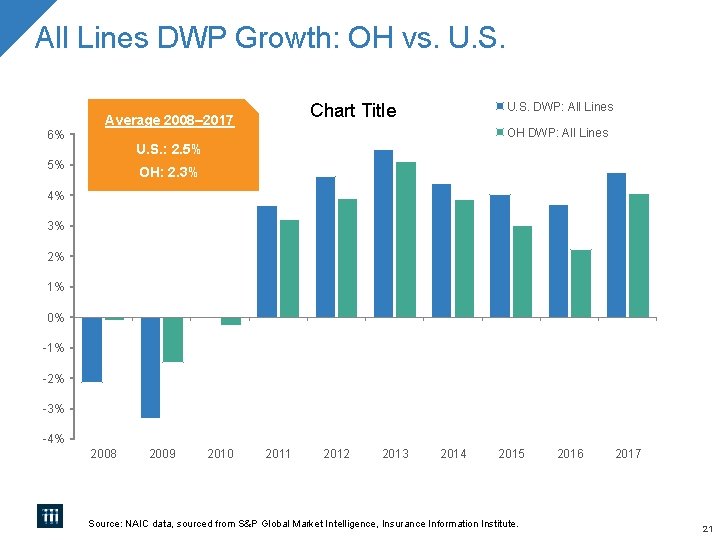
All Lines DWP Growth: OH vs. U. S. 6% U. S. DWP: All Lines Chart Title Average 2008– 2017 OH DWP: All Lines U. S. : 2. 5% 5% OH: 2. 3% 4% 3% 2% 1% 0% -1% -2% -3% -4% 2008 2009 2010 2011 2012 2013 2014 2015 Source: NAIC data, sourced from S&P Global Market Intelligence, Insurance Information Institute. 2016 2017 21
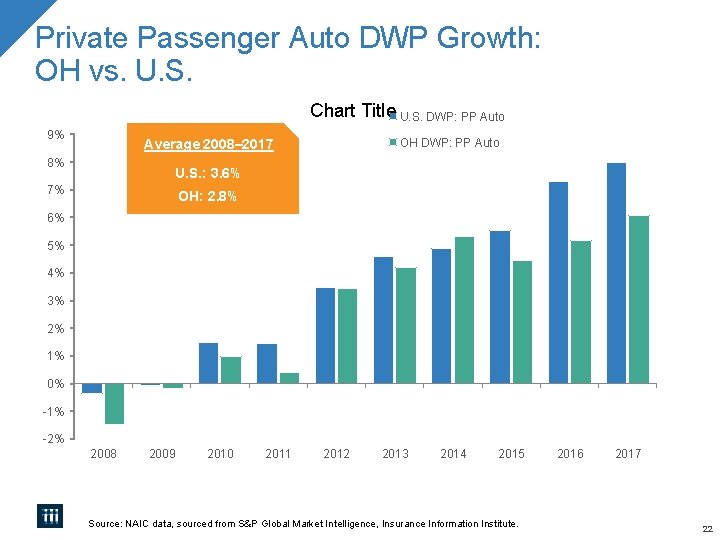
Private Passenger Auto DWP Growth: OH vs. U. S. Chart Title U. S. DWP: PP Auto 9% OH DWP: PP Auto Average 2008– 2017 8% U. S. : 3. 6% 7% OH: 2. 8% 6% 5% 4% 3% 2% 1% 0% -1% -2% 2008 2009 2010 2011 2012 2013 2014 2015 Source: NAIC data, sourced from S&P Global Market Intelligence, Insurance Information Institute. 2016 2017 22
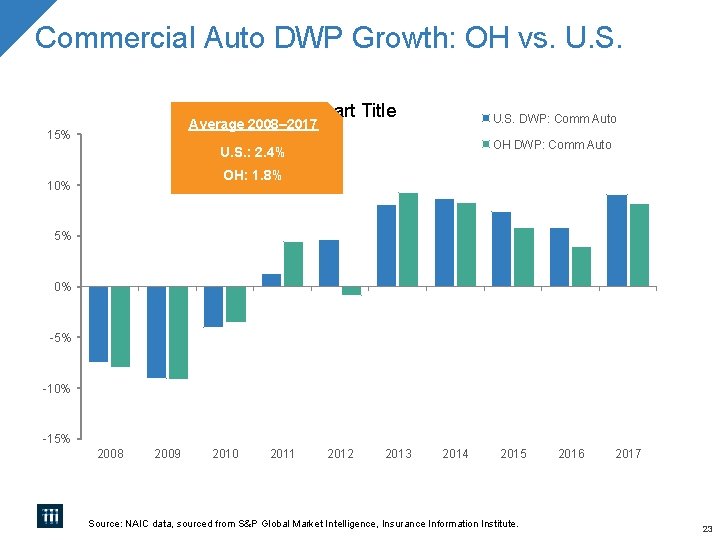
Commercial Auto DWP Growth: OH vs. U. S. Chart Title U. S. DWP: Comm Auto Average 2008– 2017 15% OH DWP: Comm Auto U. S. : 2. 4% OH: 1. 8% 10% 5% 0% -5% -10% -15% 2008 2009 2010 2011 2012 2013 2014 2015 Source: NAIC data, sourced from S&P Global Market Intelligence, Insurance Information Institute. 2016 2017 23

2017: Q 4 Scuttlebutt Is a hard market coming?
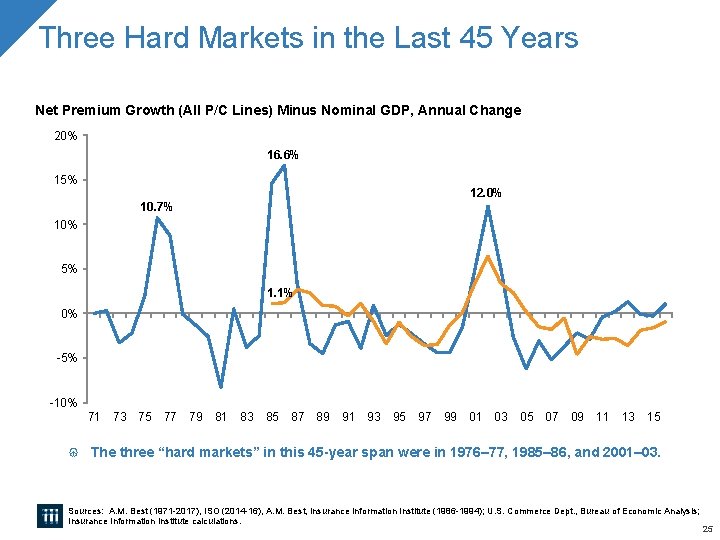
Three Hard Markets in the Last 45 Years Net Premium Growth (All P/C Lines) Minus Nominal GDP, Annual Change 20% 16. 6% 15% 12. 0% 10. 7% 10% 5% 1. 1% 0% -5% -10% 71 73 75 77 79 81 83 85 87 89 91 93 95 97 99 01 03 05 07 09 11 13 15 The three “hard markets” in this 45 -year span were in 1976– 77, 1985– 86, and 2001– 03. Sources: A. M. Best (1971 -2017), ISO (2014 -16), A. M. Best, Insurance Information Institute (1986 -1994); U. S. Commerce Dept. , Bureau of Economic Analysis; Insurance Information Institute calculations. 25
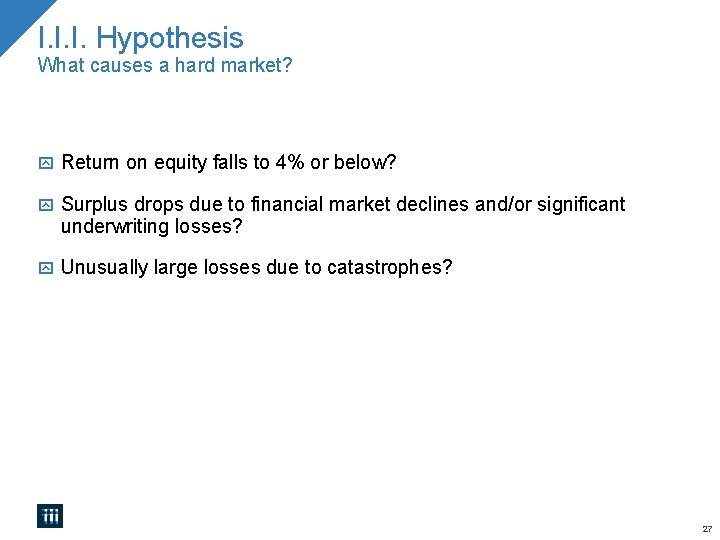
I. I. I. Hypothesis What causes a hard market? Return on equity falls to 4% or below? Surplus drops due to financial market declines and/or significant underwriting losses? Unusually large losses due to catastrophes? 27
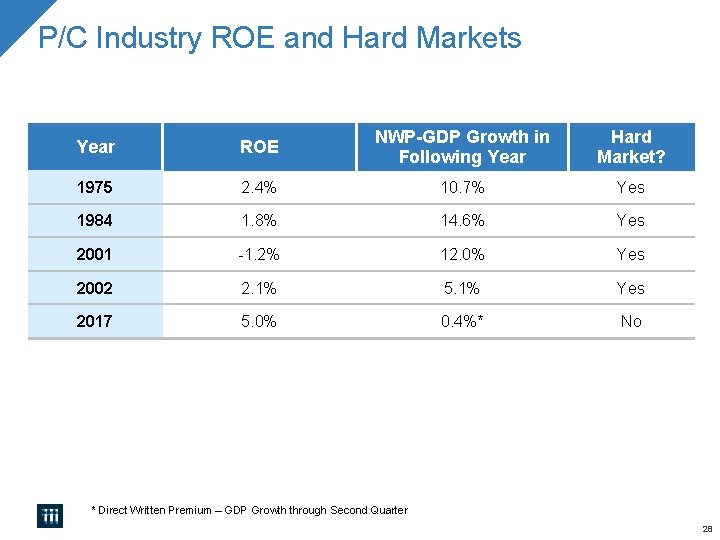
P/C Industry ROE and Hard Markets Year ROE NWP-GDP Growth in Following Year Hard Market? 1975 2. 4% 10. 7% Yes 1984 1. 8% 14. 6% Yes 2001 -1. 2% 12. 0% Yes 2002 2. 1% 5. 1% Yes 2017 5. 0% 0. 4%* No * Direct Written Premium – GDP Growth through Second Quarter 28
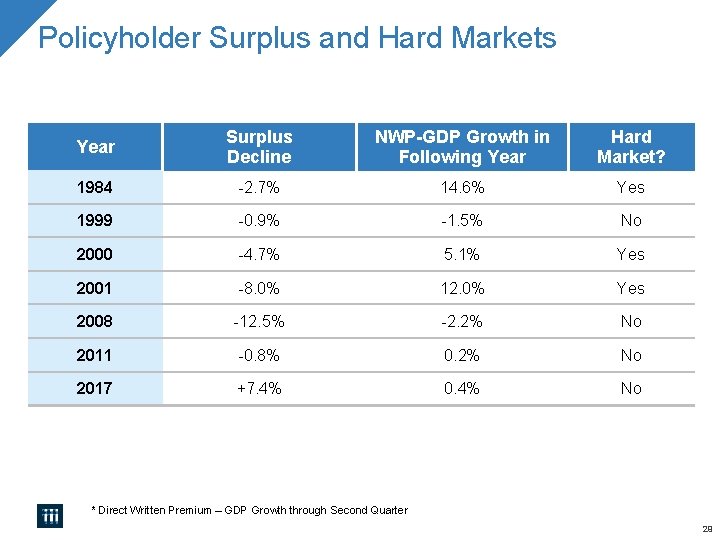
Policyholder Surplus and Hard Markets Year Surplus Decline NWP-GDP Growth in Following Year Hard Market? 1984 -2. 7% 14. 6% Yes 1999 -0. 9% -1. 5% No 2000 -4. 7% 5. 1% Yes 2001 -8. 0% 12. 0% Yes 2008 -12. 5% -2. 2% No 2011 -0. 8% 0. 2% No 2017 +7. 4% 0. 4% No * Direct Written Premium – GDP Growth through Second Quarter 29
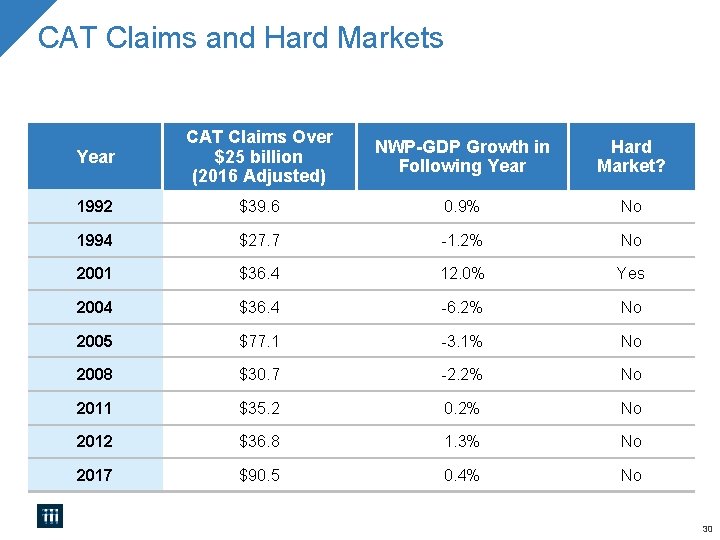
CAT Claims and Hard Markets Year CAT Claims Over $25 billion (2016 Adjusted) NWP-GDP Growth in Following Year Hard Market? 1992 $39. 6 0. 9% No 1994 $27. 7 -1. 2% No 2001 $36. 4 12. 0% Yes 2004 $36. 4 -6. 2% No 2005 $77. 1 -3. 1% No 2008 $30. 7 -2. 2% No 2011 $35. 2 0. 2% No 2012 $36. 8 1. 3% No 2017 $90. 5 0. 4% No 30
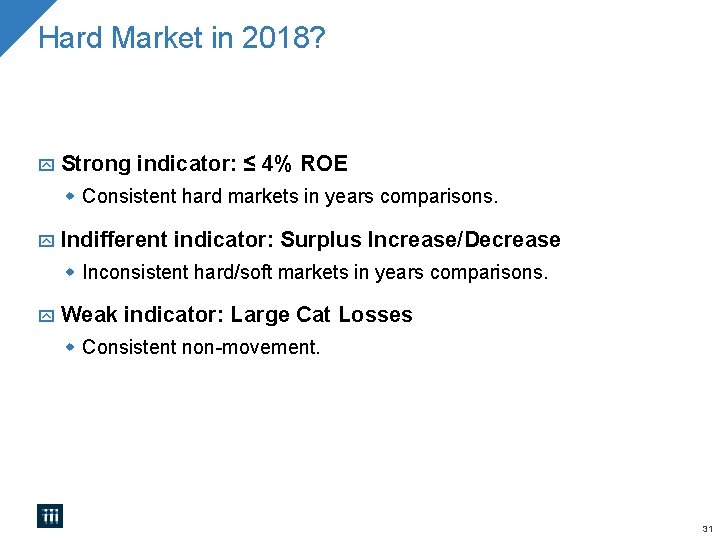
Hard Market in 2018? Strong indicator: ≤ 4% ROE Consistent hard markets in years comparisons. Indifferent indicator: Surplus Increase/Decrease Inconsistent hard/soft markets in years comparisons. Weak indicator: Large Cat Losses Consistent non-movement. 31
Commercial Rate Changes Commercial Auto. . . And Everything Else
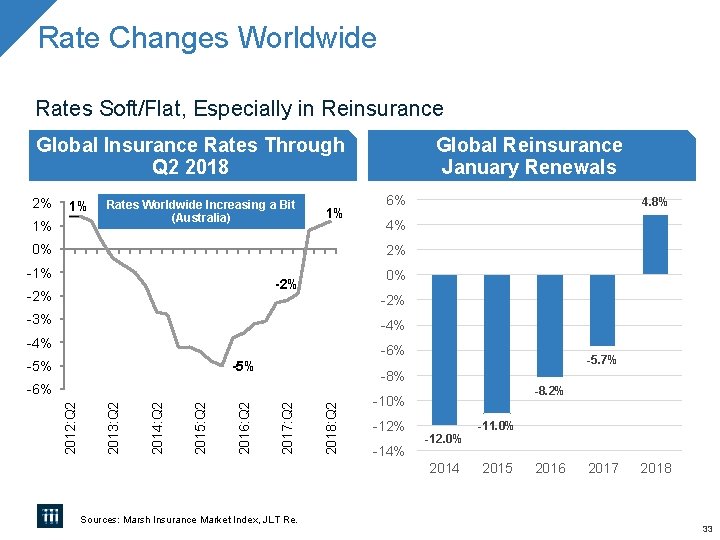
Rate Changes Worldwide Rates Soft/Flat, Especially in Reinsurance Global Insurance Rates Through Q 2 2018 2% 1% 1% Rates Worldwide Increasing a Bit (Australia) 1% 0% Global Reinsurance January Renewals 6% 4. 8% 4% 2% -1% 0% -2% -2% -3% -4% -5% -6% -5% -8% 2018: Q 2 2017: Q 2 2016: Q 2 2015: Q 2 2014: Q 2 2013: Q 2 -6% 2012: Q 2 -5. 7% -8. 2% -10% -12% -14% -12. 0% 2014 Sources: Marsh Insurance Market Index, JLT Re. -11. 0% 2015 2016 2017 2018 33
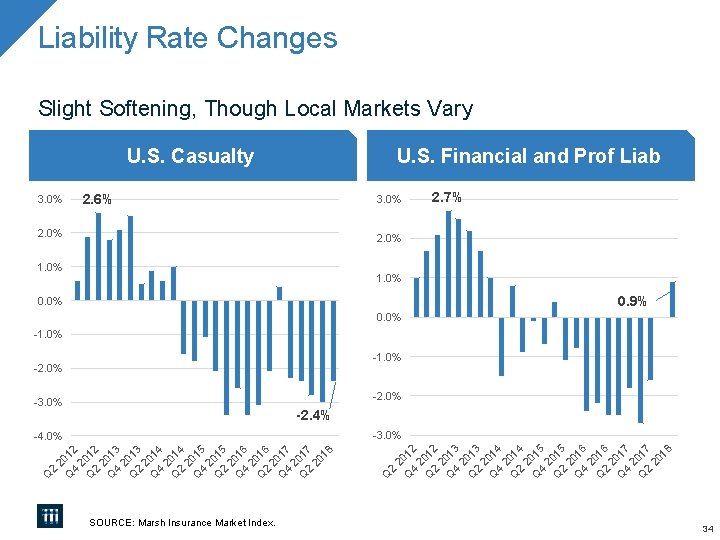
Liability Rate Changes Slight Softening, Though Local Markets Vary U. S. Casualty 3. 0% U. S. Financial and Prof Liab 2. 6% 3. 0% 2. 7% 2. 0% 1. 0% 0. 9% 0. 0% -1. 0% -2. 0% -3. 0% -2. 4% Q 2 2 Q 012 4 2 Q 012 2 2 Q 013 4 2 Q 013 2 2 Q 014 4 2 Q 014 2 2 Q 015 4 2 Q 015 2 2 Q 016 4 2 Q 016 2 2 Q 017 4 2 Q 017 2 20 18 SOURCE: Marsh Insurance Market Index. Q 2 2 Q 012 4 2 Q 012 2 2 Q 013 4 2 Q 013 2 2 Q 014 4 2 Q 014 2 2 Q 015 4 2 Q 015 2 2 Q 016 4 2 Q 016 2 2 Q 017 4 2 Q 017 2 20 18 -3. 0% -4. 0% 34
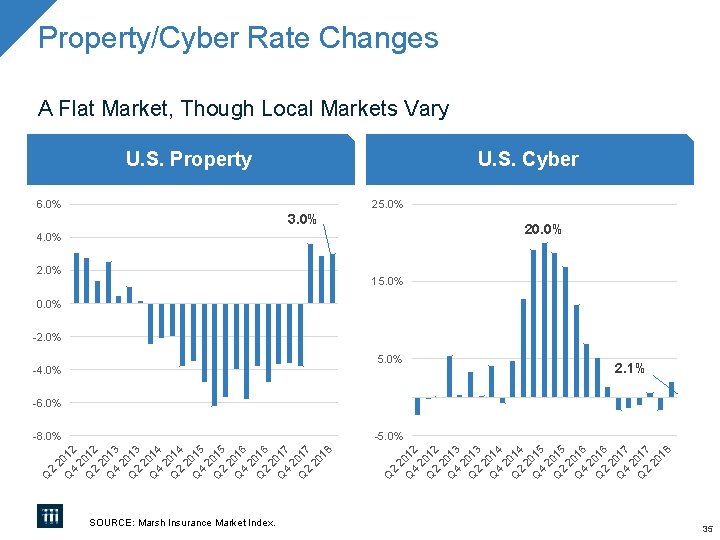
Property/Cyber Rate Changes A Flat Market, Though Local Markets Vary U. S. Property U. S. Cyber 6. 0% 25. 0% 3. 0% 20. 0% 4. 0% 2. 0% 15. 0% 0. 0% -2. 0% 5. 0% -4. 0% 2. 1% -6. 0% Q 2 2 Q 012 4 2 Q 012 2 2 Q 013 4 2 Q 013 2 2 Q 014 4 2 Q 014 2 2 Q 015 4 2 Q 015 2 2 Q 016 4 2 Q 016 2 2 Q 017 4 2 Q 017 2 20 18 SOURCE: Marsh Insurance Market Index. Q 2 2 Q 012 4 2 Q 012 2 2 Q 013 4 2 Q 013 2 2 Q 014 4 2 Q 014 2 2 Q 015 4 2 Q 015 2 2 Q 016 4 2 Q 016 2 2 Q 017 4 2 Q 017 2 20 18 -5. 0% -8. 0% 35
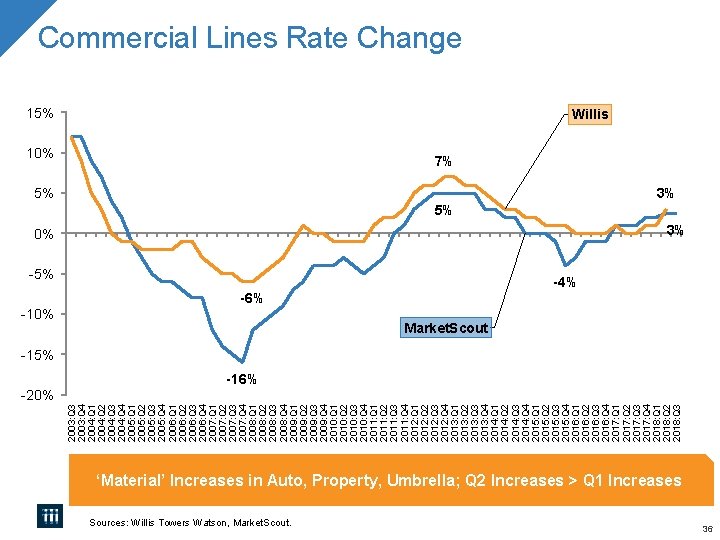
2003: Q 3 2003: Q 4 2004: Q 1 2004: Q 2 2004: Q 3 2004: Q 4 2005: Q 1 2005: Q 2 2005: Q 3 2005: Q 4 2006: Q 1 2006: Q 2 2006: Q 3 2006: Q 4 2007: Q 1 2007: Q 2 2007: Q 3 2007: Q 4 2008: Q 1 2008: Q 2 2008: Q 3 2008: Q 4 2009: Q 1 2009: Q 2 2009: Q 3 2009: Q 4 2010: Q 1 2010: Q 2 2010: Q 3 2010: Q 4 2011: Q 1 2011: Q 2 2011: Q 3 2011: Q 4 2012: Q 1 2012: Q 2 2012: Q 3 2012: Q 4 2013: Q 1 2013: Q 2 2013: Q 3 2013: Q 4 2014: Q 1 2014: Q 2 2014: Q 3 2014: Q 4 2015: Q 1 2015: Q 2 2015: Q 3 2015: Q 4 2016: Q 1 2016: Q 2 2016: Q 3 2016: Q 4 2017: Q 1 2017: Q 2 2017: Q 3 2017: Q 4 2018: Q 1 2018: Q 2 2018: Q 3 Commercial Lines Rate Change 15% Willis 10% 7% 5% 3% 5% 0% 3% -5% -4% -6% -10% Market. Scout -15% -20% -16% ‘Material’ Increases in Auto, Property, Umbrella; Q 2 Increases > Q 1 Increases Sources: Willis Towers Watson, Market. Scout. 36
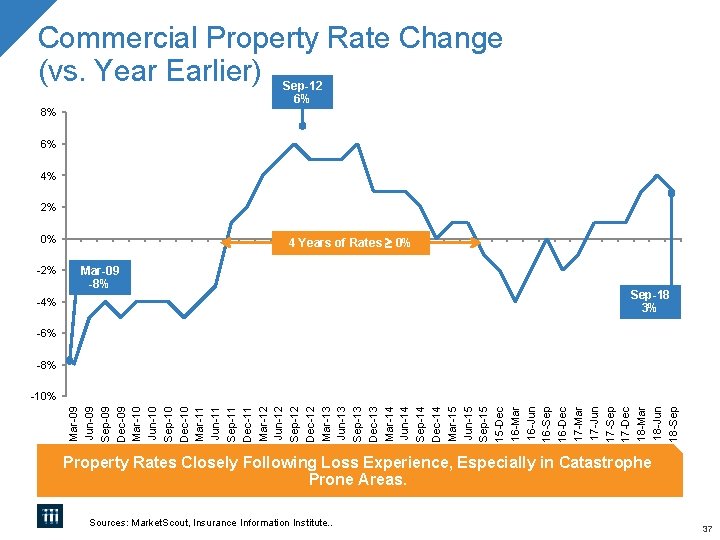
Commercial Property Rate Change (vs. Year Earlier) Sep-12 6% 8% 6% 4% 2% 0% -2% 4 Years of Rates 0% Mar-09 -8% -4% Sep-18 3% -6% -8% Mar-09 Jun-09 Sep-09 Dec-09 Mar-10 Jun-10 Sep-10 Dec-10 Mar-11 Jun-11 Sep-11 Dec-11 Mar-12 Jun-12 Sep-12 Dec-12 Mar-13 Jun-13 Sep-13 Dec-13 Mar-14 Jun-14 Sep-14 Dec-14 Mar-15 Jun-15 Sep-15 15 -Dec 16 -Mar 16 -Jun 16 -Sep 16 -Dec 17 -Mar 17 -Jun 17 -Sep 17 -Dec 18 -Mar 18 -Jun 18 -Sep -10% Property Rates Closely Following Loss Experience, Especially in Catastrophe Prone Areas. Sources: Market. Scout, Insurance Information Institute. . 37
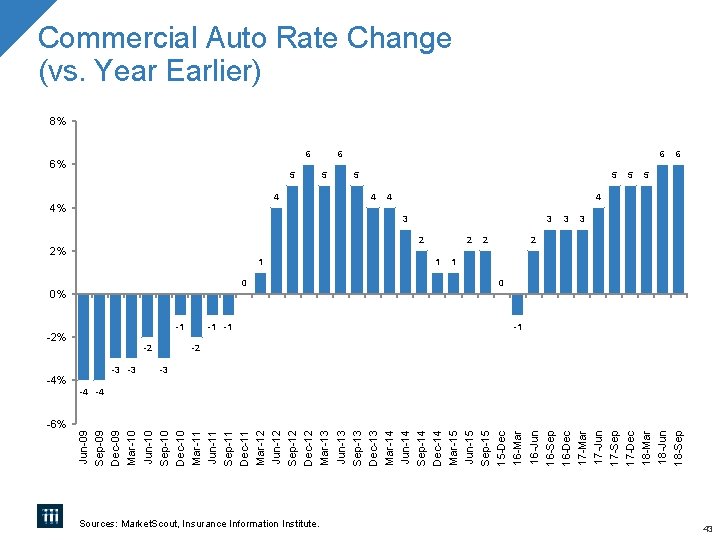
-4% -6% Jun-09 Sep-09 Dec-09 Mar-10 Jun-10 Sep-10 Dec-10 Mar-11 Jun-11 Sep-11 Dec-11 Mar-12 Jun-12 Sep-12 Dec-12 Mar-13 Jun-13 Sep-13 Dec-13 Mar-14 Jun-14 Sep-14 Dec-14 Mar-15 Jun-15 Sep-15 15 -Dec 16 -Mar 16 -Jun 16 -Sep 16 -Dec 17 -Mar 17 -Jun 17 -Sep 17 -Dec 18 -Mar 18 -Jun 18 -Sep Commercial Auto Rate Change (vs. Year Earlier) 8% 6% 6 5 4% 4 2% 1 0% 0 -2% -1 -2 -3 -3 -1 -1 Sources: Market. Scout, Insurance Information Institute. 6 5 5 4 4 3 3 2 2 1 2 3 5 6 5 4 3 2 1 0 -1 -2 -3 -4 -4 43
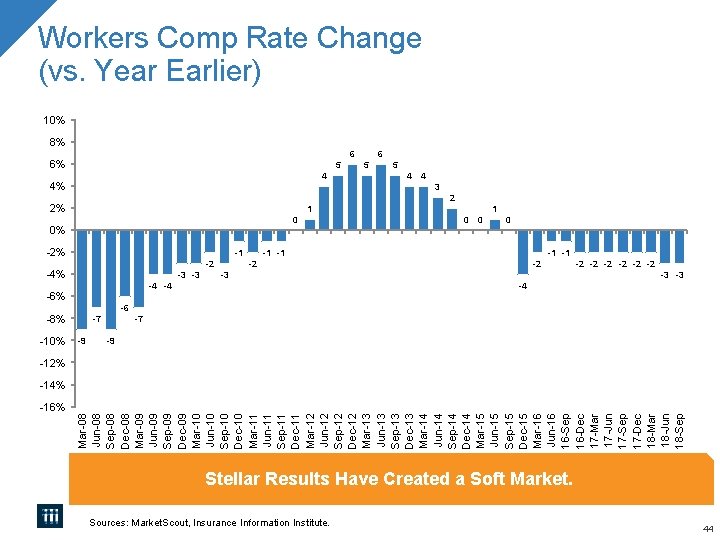
Workers Comp Rate Change (vs. Year Earlier) 10% 8% 6 6% 5 4 4 3 2 2% 1 0 0% -2% -1 -2 -4% -3 -3 1 0 0 0 -1 -1 -2 -2 -3 -4 -4 -6% -2 -2 -2 -3 -3 -4 -6 -8% -10% 6 5 -7 -9 -12% -16% Mar-08 Jun-08 Sep-08 Dec-08 Mar-09 Jun-09 Sep-09 Dec-09 Mar-10 Jun-10 Sep-10 Dec-10 Mar-11 Jun-11 Sep-11 Dec-11 Mar-12 Jun-12 Sep-12 Dec-12 Mar-13 Jun-13 Sep-13 Dec-13 Mar-14 Jun-14 Sep-14 Dec-14 Mar-15 Jun-15 Sep-15 Dec-15 Mar-16 Jun-16 16 -Sep 16 -Dec 17 -Mar 17 -Jun 17 -Sep 17 -Dec 18 -Mar 18 -Jun 18 -Sep -14% Stellar Results Have Created a Soft Market. Sources: Market. Scout, Insurance Information Institute. 44

Economic Outlook The Strength of the Economy Will Influence the Insurance Environment
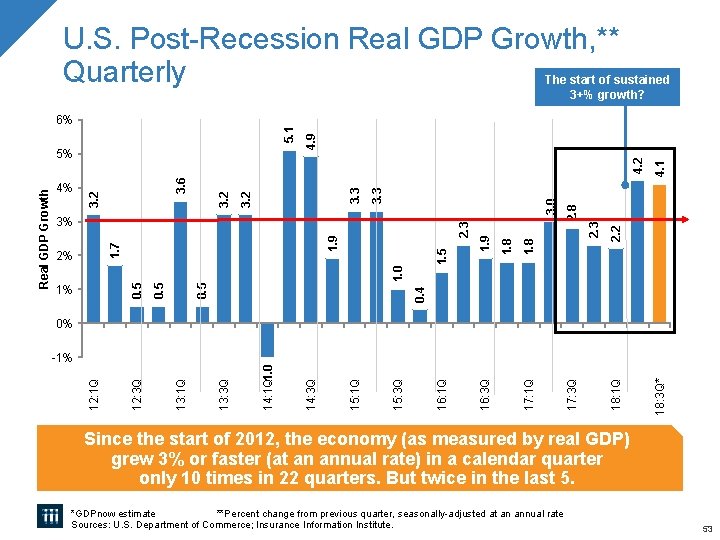
U. S. Post-Recession Real GDP Growth, ** Quarterly 4. 2 2. 3 2. 8 1. 8 0. 4 0. 5 1% 0. 5 1. 0 1. 5 1. 9 1. 7 2% 2. 3 3% 1. 9 3. 0 3. 3 3. 2 3. 6 3. 2 4% 18: 3 Q* 18: 1 Q 17: 3 Q 17: 1 Q 16: 3 Q 16: 1 Q 15: 3 Q 15: 1 Q 14: 3 Q 13: 1 Q 12: 3 Q -1% 14: 1 Q -1. 0 0% 12: 1 Q Real GDP Growth 5% 4. 1 5. 1 6% 4. 9 The start of sustained 3+% growth? Since the start of 2012, the economy (as measured by real GDP) grew 3% or faster (at an annual rate) in a calendar quarter only 10 times in 22 quarters. But twice in the last 5. *GDPnow estimate **Percent change from previous quarter, seasonally-adjusted at an annual rate Sources: U. S. Department of Commerce; Insurance Information Institute. 53
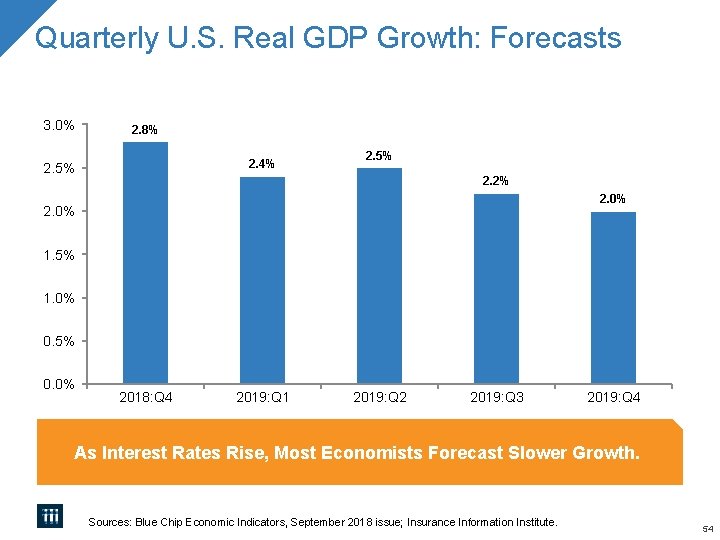
Quarterly U. S. Real GDP Growth: Forecasts 3. 0% 2. 8% 2. 4% 2. 5% 2. 2% 2. 0% 1. 5% 1. 0% 0. 5% 0. 0% 2018: Q 4 2019: Q 1 2019: Q 2 2019: Q 3 2019: Q 4 As Interest Rates Rise, Most Economists Forecast Slower Growth. Sources: Blue Chip Economic Indicators, September 2018 issue; Insurance Information Institute. 54
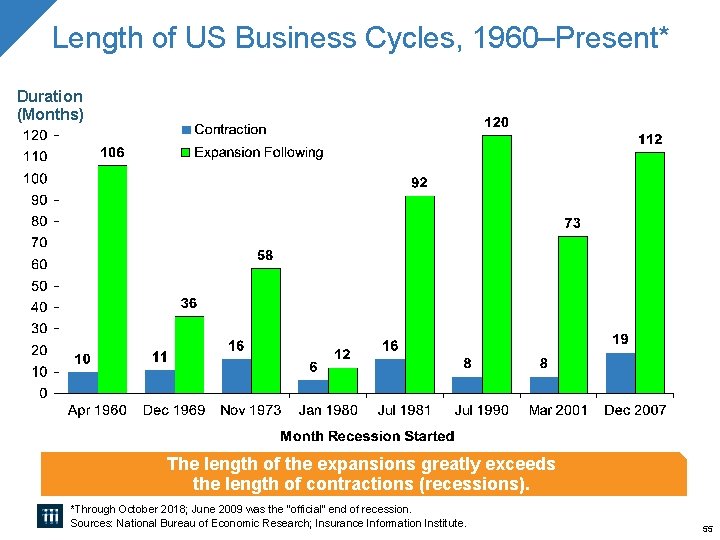
Length of US Business Cycles, 1960–Present* Duration (Months) The length of the expansions greatly exceeds the length of contractions (recessions). *Through October 2018; June 2009 was the “official” end of recession. Sources: National Bureau of Economic Research; Insurance Information Institute. 55
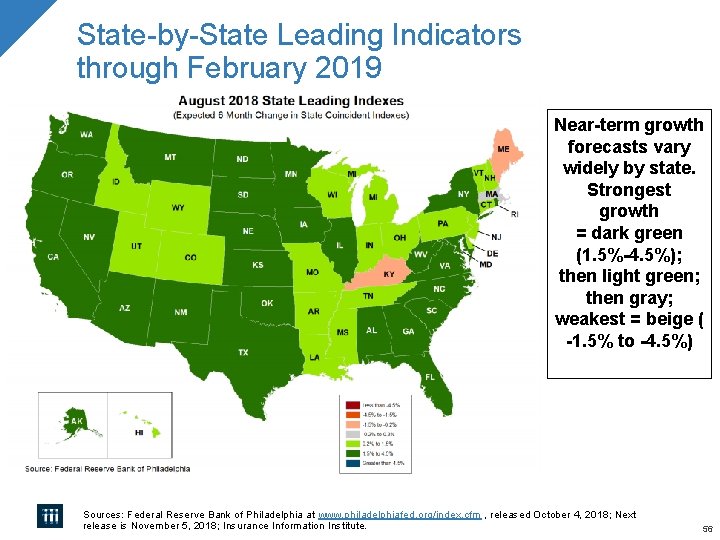
State-by-State Leading Indicators through February 2019 1. 77 3. 89 1. 69 1. 50 2. 62 4. 36 3. 57 1. 72 1. 60 1. 90 2. 24 1. 55 2. 15 3. 90 2. 81 3. 55 3. 43 2. 20 3. 25 3. 41 4. 28 1. 58 Near-term growth forecasts vary widely by state. Strongest growth = dark green (1. 5%-4. 5%); then light green; then gray; weakest = beige ( -1. 5% to -4. 5%) 1. 87 2. 47 Sources: Federal Reserve Bank of Philadelphia at www. philadelphiafed. org/index. cfm , released October 4, 2018; Next release is November 5, 2018; Insurance Information Institute. 56
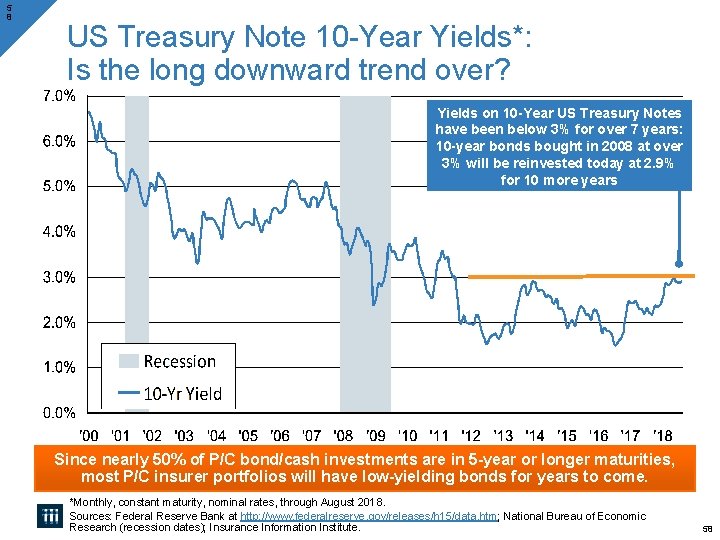
5 8 US Treasury Note 10 -Year Yields*: Is the long downward trend over? Yields on 10 -Year US Treasury Notes have been below 3% for over 7 years: 10 -year bonds bought in 2008 at over 3% will be reinvested today at 2. 9% for 10 more years Since nearly 50% of P/C bond/cash investments are in 5 -year or longer maturities, most P/C insurer portfolios will have low-yielding bonds for years to come. *Monthly, constant maturity, nominal rates, through August 2018. Sources: Federal Reserve Bank at http: //www. federalreserve. gov/releases/h 15/data. htm; National Bureau of Economic Research (recession dates); Insurance Information Institute. 58
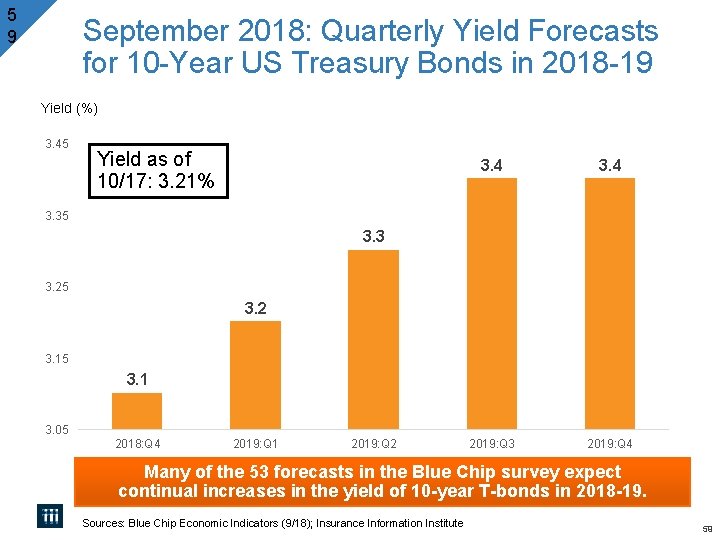
5 9 September 2018: Quarterly Yield Forecasts for 10 -Year US Treasury Bonds in 2018 -19 Yield (%) 3. 45 Yield as of 10/17: 3. 21% 3. 4 2019: Q 3 2019: Q 4 3. 35 3. 3 3. 25 3. 2 3. 15 3. 1 3. 05 2018: Q 4 2019: Q 1 2019: Q 2 Many of the 53 forecasts in the Blue Chip survey expect continual increases in the yield of 10 -year T-bonds in 2018 -19. Sources: Blue Chip Economic Indicators (9/18); Insurance Information Institute 59

Cannabis and Insurance A Sensitive Issue
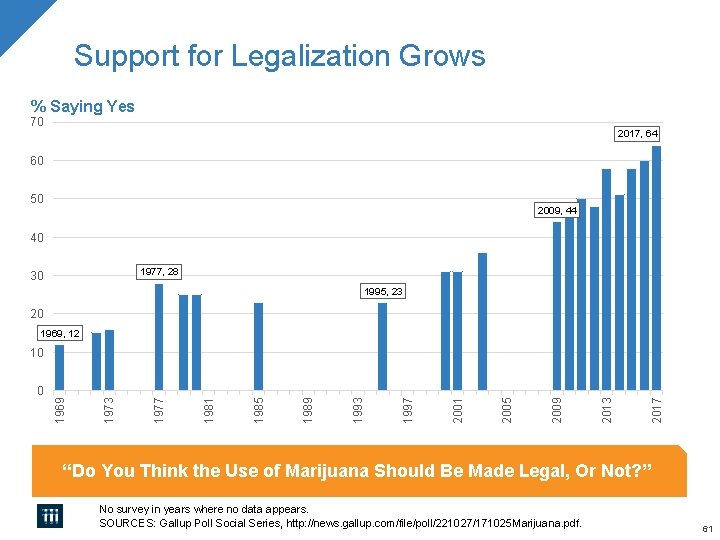
Support for Legalization Grows % Saying Yes 70 2017, 64 60 50 2009, 44 40 1977, 28 30 1995, 23 20 1969, 12 2017 2013 2009 2005 2001 1997 1993 1989 1985 1981 1977 1973 0 1969 10 “Do You Think the Use of Marijuana Should Be Made Legal, Or Not? ” No survey in years where no data appears. SOURCES: Gallup Poll Social Series, http: //news. gallup. com/file/poll/221027/171025 Marijuana. pdf. 61
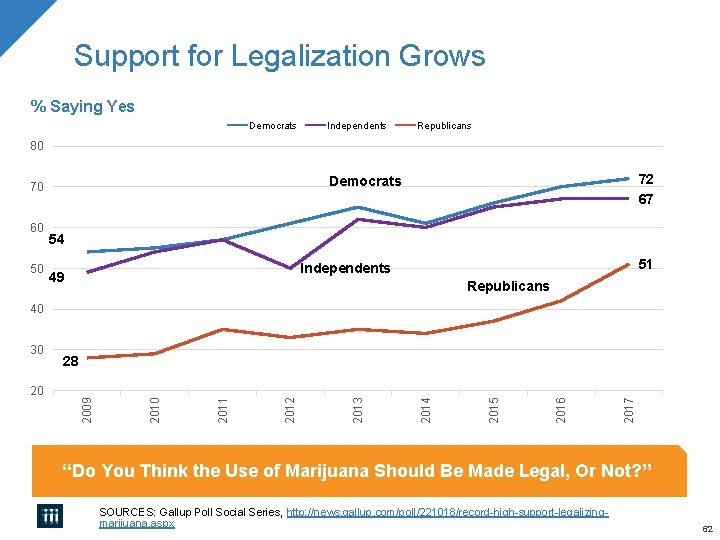
Support for Legalization Grows % Saying Yes Democrats Independents Republicans 80 60 50 72 67 Democrats 70 54 51 Independents 49 Republicans 40 2017 2016 2015 2014 2013 2012 2011 2010 20 28 2009 30 “Do You Think the Use of Marijuana Should Be Made Legal, Or Not? ” SOURCES: Gallup Poll Social Series, http: //news. gallup. com/poll/221018/record-high-support-legalizingmarijuana. aspx 62
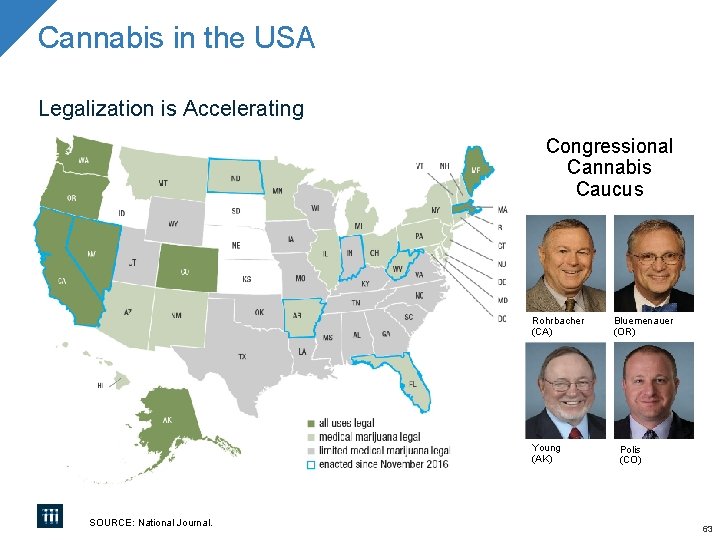
Cannabis in the USA Legalization is Accelerating Congressional Cannabis Caucus Rohrbacher (CA) Young (AK) SOURCE: National Journal. Bluemenauer (OR) Polis (CO) 63
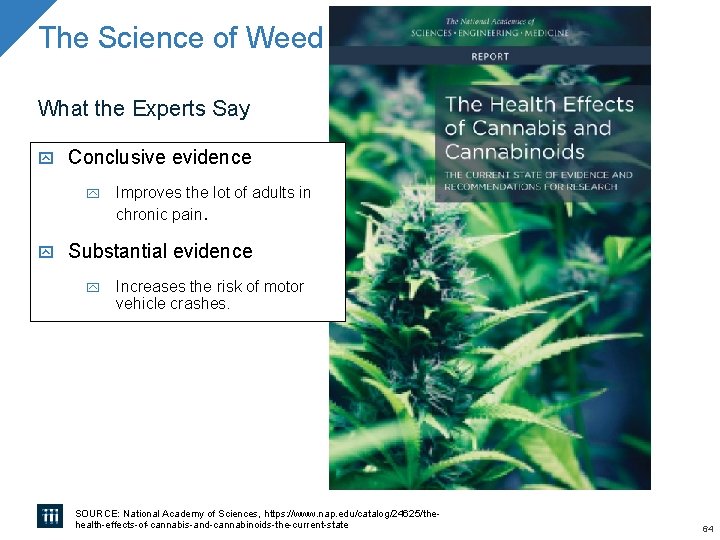
The Science of Weed What the Experts Say Conclusive evidence Improves the lot of adults in chronic pain. Substantial evidence Increases the risk of motor vehicle crashes. SOURCE: National Academy of Sciences, https: //www. nap. edu/catalog/24625/thehealth-effects-of-cannabis-and-cannabinoids-the-current-state 64
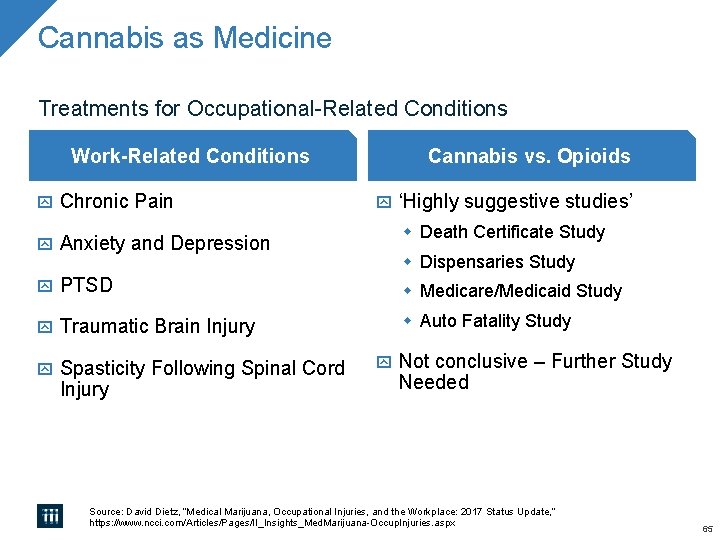
Cannabis as Medicine Treatments for Occupational-Related Conditions Work-Related Conditions Cannabis vs. Opioids Chronic Pain Anxiety and Depression PTSD Medicare/Medicaid Study Traumatic Brain Injury Auto Fatality Study Spasticity Following Spinal Cord Injury ‘Highly suggestive studies’ Death Certificate Study Dispensaries Study Not conclusive – Further Study Needed Source: David Dietz, “Medical Marijuana, Occupational Injuries, and the Workplace: 2017 Status Update, ” https: //www. ncci. com/Articles/Pages/II_Insights_Med. Marijuana-Occup. Injuries. aspx 65
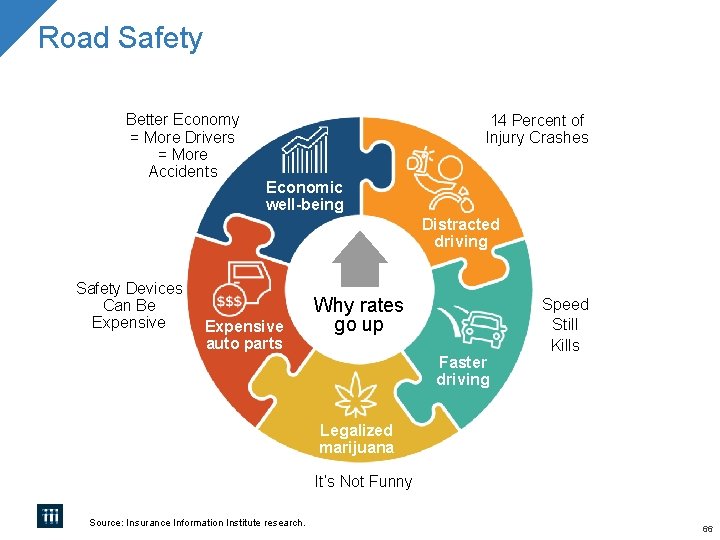
Road Safety Better Economy = More Drivers = More Accidents 14 Percent of Injury Crashes Economic well-being Distracted driving Safety Devices Can Be Expensive auto parts Why rates go up Faster driving Speed Still Kills Legalized marijuana It’s Not Funny Source: Insurance Information Institute research. 66
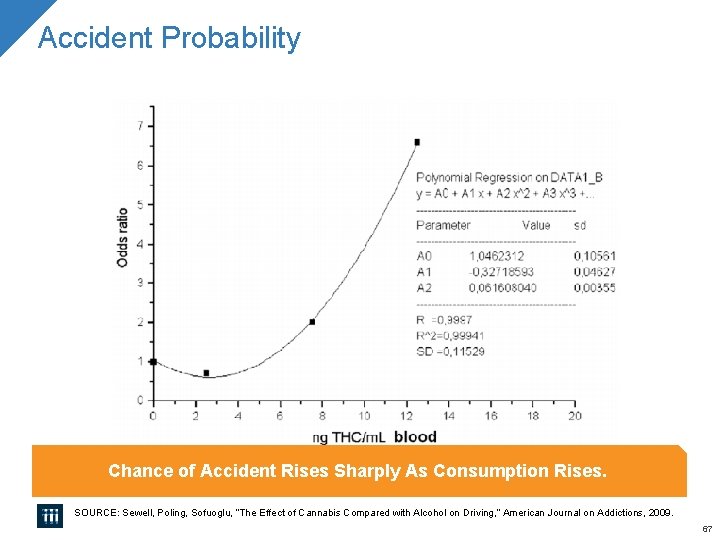
Accident Probability Chance of Accident Rises Sharply As Consumption Rises. SOURCE: Sewell, Poling, Sofuoglu, “The Effect of Cannabis Compared with Alcohol on Driving, ” American Journal on Addictions, 2009. 67
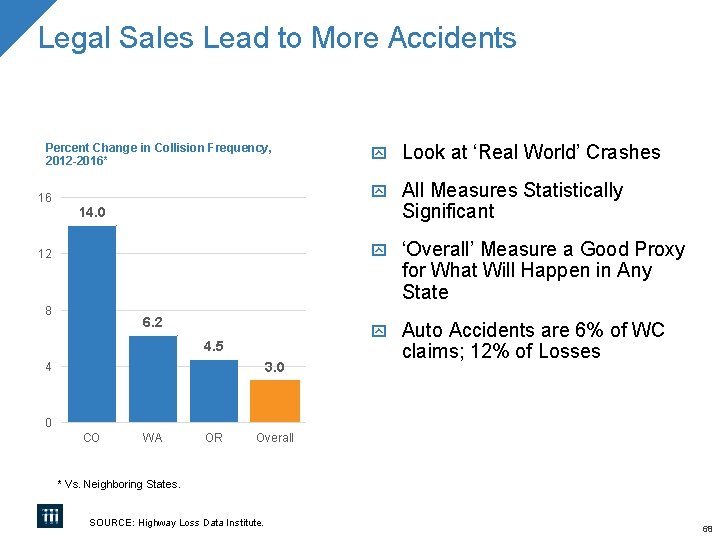
Legal Sales Lead to More Accidents Percent Change in Collision Frequency, 2012 -2016* 16 Look at ‘Real World’ Crashes All Measures Statistically Significant ‘Overall’ Measure a Good Proxy for What Will Happen in Any State Auto Accidents are 6% of WC claims; 12% of Losses 14. 0 12 8 6. 2 4. 5 3. 0 4 0 CO WA OR Overall * Vs. Neighboring States. SOURCE: Highway Loss Data Institute. 68
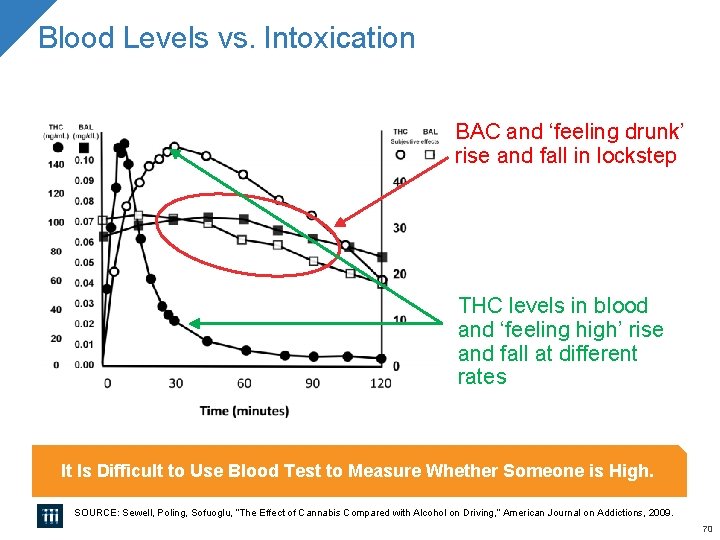
Blood Levels vs. Intoxication BAC and ‘feeling drunk’ rise and fall in lockstep THC levels in blood and ‘feeling high’ rise and fall at different rates It Is Difficult to Use Blood Test to Measure Whether Someone is High. SOURCE: Sewell, Poling, Sofuoglu, “The Effect of Cannabis Compared with Alcohol on Driving, ” American Journal on Addictions, 2009. 70
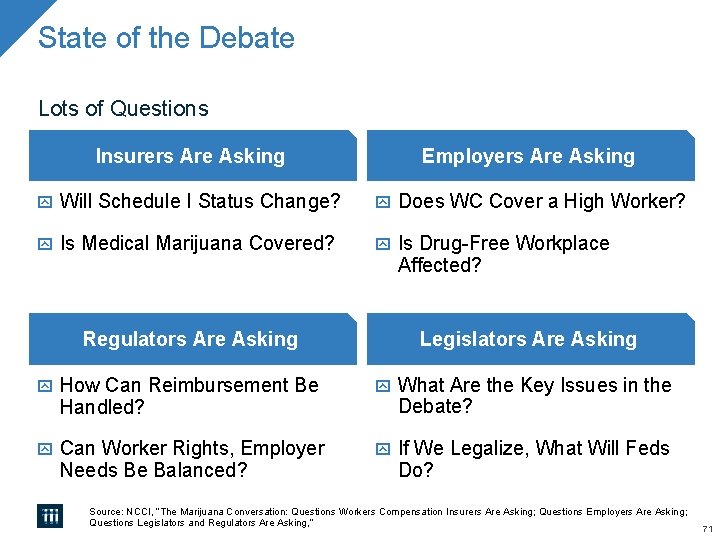
State of the Debate Lots of Questions Insurers Are Asking Employers Are Asking Will Schedule I Status Change? Does WC Cover a High Worker? Is Medical Marijuana Covered? Is Drug-Free Workplace Affected? Regulators Are Asking Legislators Are Asking How Can Reimbursement Be Handled? What Are the Key Issues in the Debate? Can Worker Rights, Employer Needs Be Balanced? If We Legalize, What Will Feds Do? Source: NCCI, “The Marijuana Conversation: Questions Workers Compensation Insurers Are Asking; Questions Employers Are Asking; Questions Legislators and Regulators Are Asking, ” 71

Questions?

Thank you! www. iii. org
- Slides: 58