PB 202 MACROECONOMICS CHAPTER 1 INTRODUCTION TO MACROECONOMICS

PB 202 MACROECONOMICS CHAPTER 1 INTRODUCTION TO MACROECONOMICS

Continuous Assessment CA Total Chapter % Quiz Minimum 3 Chapter 1, 6, 7 20 Test Minimum 1 Chapter 1 -4 20 Tutorial Minimum 2 Chapter 2&3 20 Case study Minimum 1 Chapter 4&5 20 Reflective journal Minimum 3 Chapter 1, 6, 7 15 Peer assessment Minimum 2 - 5

What is Reflective Journal?

Reflective Journal �Points that you found specially interesting in your reading, and would like to follow up in more detail. �Questions that came up in your mind, because of points made in material you read on this topic �Notes from other material you read as a result of the course - whether this was �Your reflections on this course, and how well it is meeting your needs �You may also want to include private thoughts in your journal

How to Study Economics? �Theory and facts To understand how economic works Facts without theory are useless Theory without facts is unsupported assertion �Economic data To help us think about an economic problem Two types: � Time series data � Cross-section data

How to Study Economics? �Index numbers is a statistical measure of changes in a representative group of individual data points These data may be derived from any number of sources, including company performance, prices, productivity, and employment Example : Consumer Price Index (CPI), Producer Price Index (PPI).

Why study macroeconomics? �Are you hope to make money? �Are you concerned to learn how budget deficits and inflation will affect you in future? �Are you curious to know why it is sometimes hard to find a job? �Why are some people rich and others poor? �Why foreign like Japan or Korea can produce goods so much cheaply than America? �Why countries like Russia and China are moving from plan to a market economy? �Are you curious to know how the global marketplace works?

What is macroeconomics?

What is macroeconomics? �Macroeconomics can be best understood in contrast to microeconomics �Macroeconomics considers the larger picture which is the sum of all decision �An understanding of microeconomics is crucial to understand macroeconomics �"Macroeconomics is the branch of economics concerned with aggregates, such as national income, consumption, and investment "

Microeconomics versus Macroeconomics Micro concept Macro equivalent Market National economy Demand Aggregate Demand Supply Aggregate Supply Price Level Quantity National output/income GDP Decrease in demand Recession and unemployment Decrease in supply Supply shock; stagflation Increase in supply Economic growth Subsidy Government spending

Micro and Macro aims Goals Microeconomic aims/goals Macroeconomic aims/goals • Firms aim to maximize profits • Full employment • Consumers aim to maximize utility • Economic growth • Efficient resource allocation in competitive markets • The correction of market failure through government intervention • Price stability • Income distribution

Macroeconomics Goal �Full employment Does NOT mean every single person has a job Means that most people who want to work are working �Price stability This refers NOT to the prices of individual products, BUT to the price level as a whole A RISE in the overall price level is called inflation, a FALL is called deflation

Macroeconomics Goal �Economic growth The most talked about macroeconomic goal Growth occurs when the total amount of goods and services an economy produces increases from year to year �Equitable distribution of income A nation’s income should be somewhat equally distributed between the upper and lower “classes” in society Some tax systems are designed to achieved more equitable income distribution

Macroeconomics Problems �Stagflation �Inflation �Deflation �Hyperinflation �Recession �Unemployment

STAGFLATION �Wikipedia - In economics, stagflation is the situation when both the inflation rate and the unemployment rate are persistently high.
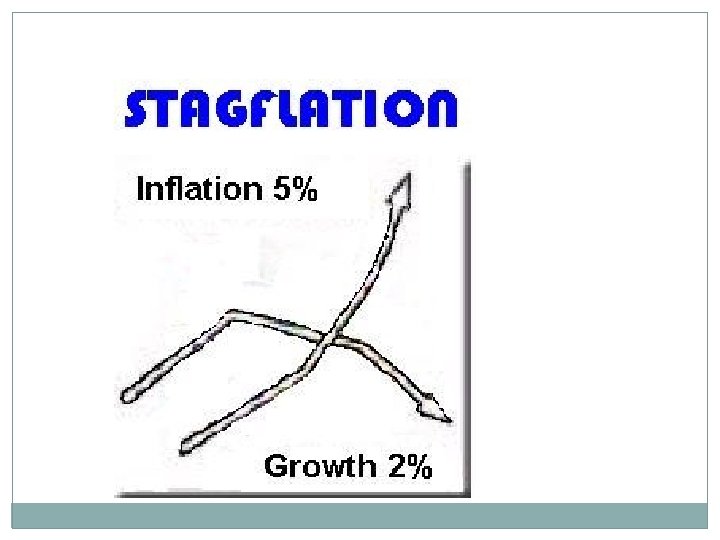

STAGFLATION

STAGFLATION � 1970’s – global stagflation Causes : � Yom Kippur war in 1973 � Iranian revolution of 1979

Crude Oil Prices 1947 -2009

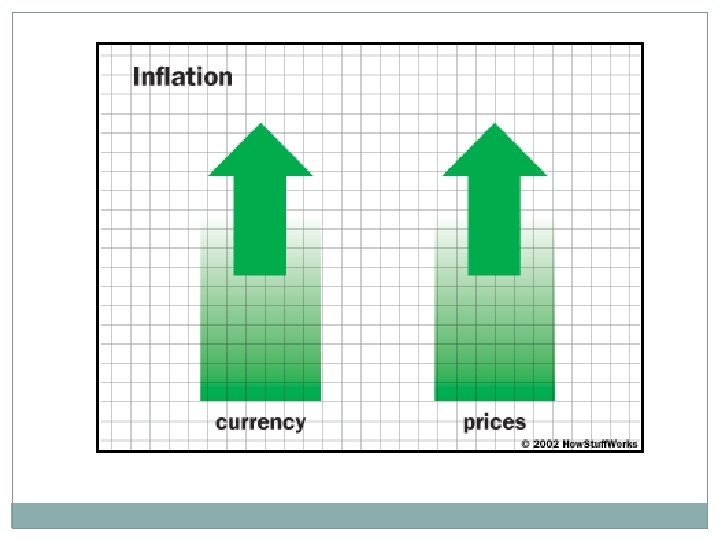
What is inflation?

Inflation �An increase in the price you pay for goods �The rate at which the general level of prices for goods and services is rising, and, subsequently, purchasing power is falling �How do we do when it is inflation? By using CPI �In Malaysia, Consumer Price Index (CPI) is measured by Dept of Statistic, Malaysia


Inflation in Malaysia 2011 �“Inflation is still a concern” – says Tan Sri Dr Zeti Akhtar Aziz (The Star; May 24) BNM estimate inflation 2. 5% to 3. 5% Fiscal policy – cut in government subsidy (gasoline and sugar) Monetary policy – � BNM increase Overnight Policy Rate (OPR) at 3% the rest of the year ; and increase statutory reserve requirement to 3%
, inflation is expected to")
Inflation 2011 �As reported by Malaysian Institute Economic Research (MIER), inflation is expected to trend upwards due to the effects of quantitative easing in the U. S. , geopolitical tensions in the Middle East and North Africa, and on the reconstruction of Japan.

Time Series Data Year Inflation rate % 1981 9. 7 1982 5. 8 1983 3. 7 1984 3. 9 1985 0. 3 1986 0. 7 1987 0. 3 1988 2. 6 1989 2. 8 1990 2. 6 1991 4. 4 1992 4. 8

Time Series Data Year Inflation rate % 1993 3. 5 1994 3. 7 1995 3. 5 1996 3. 5 1997 2. 7 1998 5. 3 1999 2. 7 2000 1. 5 2001 1. 4 2002 1. 8 2003 1. 0

Time Series Data Year Inflation rate % 2004 1. 5 2005 3. 0 2006 3. 5 2007 7. 4 2008 12. 3 2009 4. 0 Source: The World Bank Data

What is deflation?

Deflation �In general, deflation is when the average price of goods goes down �When the inflation rate falls below zero, showing negative inflation, we know that there has been deflation

What is hyperinflation?

Hyperinflation �Extremely rapid or out of control inflation �Germany – after World War I (inflation rate 322) �In Hungary after World War II - Between August 1945 and July 1946 the general level of prices rose at the astounding rate of more than 19, 000 percent per month, or 19 percent per day �Cause – war and increase in money supply

Hyperinflation in Hungary Sweeping up the banknotes from the street after the Hungarian pengő was replaced in 1946

Hyperinflation in Germany, 1923: banknotes had lost so much value that they were used as wallpaper.

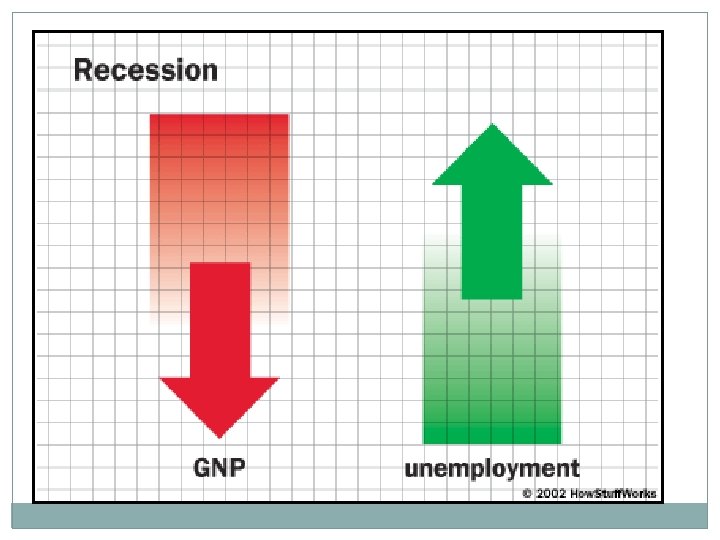
What is recession?

Recession �Period of general economic decline, defined usually as a contraction in the GDP for six months (two consecutive quarters) or longer. �In usual dictionary definition is “ a period of reduce economy activity” �The NBER define a recession as a “significant decline in economic activity lasting more than a few months. ”

Recession �Marked by high unemployment, stagnant wages, and fall in retail sales �a recession generally does not last longer than one year and is much milder than a depression

Causes of recession �Currency crisis �Energy crises �Financial crises
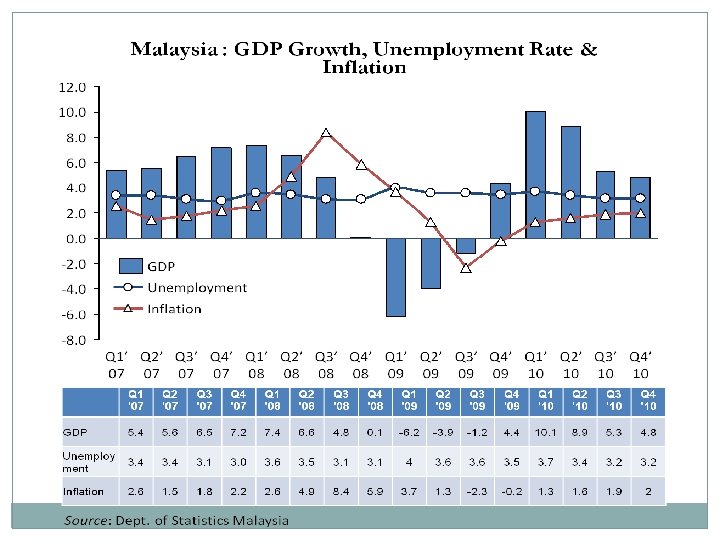
 GDP growth rate at constant price Unemployment rate 2008:")
Time Series Data Year (Quarterly) GDP growth rate at constant price Unemployment rate 2008: Q 1 7. 4 3. 6 2008: Q 2 6. 6 3. 7 2008: Q 3 4. 8 3. 1 2008: Q 4 0. 1 3. 1 2009: Q 1 -6. 2 4. 0 2010: Q 2 -3. 9 3. 6 2010: Q 3 -1. 2 3. 6

GDP – real growth rate

What is Unemployment?

Unemployment �The general economic definition of unemployment is defined as: a state in which there are qualified workers who are available for work at the current wage rate and who do not have jobs.
 occurs when people are without")
Unemployment �as defined by the International Labour Organization (ILO) occurs when people are without jobs and they have actively looked for work within the past four weeks

Unemployment Rate �The unemployment rate is a measure of the prevalence of unemployment �it is calculated as a percentage by dividing the number of unemployed individuals by all individuals currently in the labour force.
 Labor force rate (%)")
Malaysia Unemployment Rate 2001 -2007 Year Total Unemployment rate (%) Labor force rate (%) 2001 9357 3. 5 64. 9 2002 9543 3. 5 64. 4 2003 9870 3. 6 65. 2 2004 9980 3. 5 64. 4 2005 10, 045 3. 5 63. 3 2006 10, 275 3. 3 63. 1 2007 10, 538 3. 2 63. 2 Source: Dept of Statistics

The end
- Slides: 48