PB 102 MICROECONOMICS CHAPTER 7 MARKET STRUCTURE EQUILIBRIUM

PB 102 MICROECONOMICS CHAPTER 7 MARKET STRUCTURE EQUILIBRIUM

What is Market Equilibrium? A firm is in equilibrium when it earns maximum profit or when minimum losses occur

MARKET STRUCTURE EQUILIBRIUM SHORT – RUN EQUILIBRIUM Total Approach Marginal Approach SHUT – DOWN POINT LONG – RUN EQUILIBRIUM

Short-run Equilibrium �Short –run means a period in which at least one of the input is fixed �Is about how the industry or firms maximize their profits �Has two approaches to determine profit maximization �Total Approach �Marginal Approach

Perfect Competition Quantity Total Revenue Total Cost Profit/ Loss 0 0 60 -60 1 100 140 -40 2 200 210 -10 3 300 290 10 4 400 390 10 5 500 0 6 600 630 -30 7 700 800 -100

Perfect Competition �Total Approach TC TR

Perfect Competition Q TR MR TC MC Profit/Loss 0 0 - 60 - -60 1 100 140 80 -40 2 200 100 210 70 -10 3 300 100 290 80 10 4 400 100 390 10 5 500 100 500 110 0 6 600 100 630 130 -30 7 700 100 800 170 -100

Perfect Competition �Marginal Approach MC 100 MR 4

Short – run equilibrium �In the short run, perfect competition firm will enjoy THREE types of profit: �Supernormal profit � Profit earned when total revenue greater than total cost � TR > TC or P > ATC �Subnormal profit � Economic losses because total revenue less than total cost or price is lower than average total cost � TR < TC or P < ATC �Normal profit � Is a breakeven for the firm to stay in industry � Incurred when total revenue equal is to total cost � TR = TC

Supernormal Profit

Subnormal Profit MC P ATC MR

Normal Profit

Long-run Equilibrium �In the long run, firms has enough time to make changes and adjustments to production process �All inputs are variable in the long run �Perfect competition only earn economic profit/normal profit in the long run due to of free entry and exit in industry

Long run Equilibrium
, firms")
Shut Down Point �If the price is below than average total cost (AVC), firms have TWO possibilities either: �Continue the operation; �Shut down the operation �P < AVC

Shut Down Point

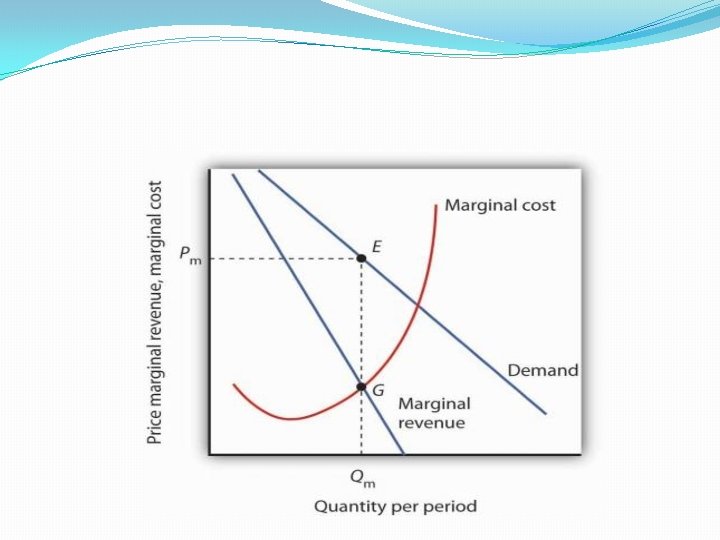
Short Run Equilibrium �In monopoly, the short run equilibrium can also be determined by two approaches: �Total Approach �Marginal Approach

Exhibit 5: Short-Run Revenues and Costs for the Monopolist Short-run Costs and Revenue for a Monopolist Diamonds per day (Q) (1) 0 1 2 3 4 5 6 7 8 9 10 11 12 13 14 15 16 17 Price Marginal (average Total Revenue revenue) revenue (MR = (p) (TR = Q x p) TR / Q) (2) (3) =(1) x (2) (4) $7, 750 7, 500 7, 250 7, 000 6, 750 6, 500 6, 250 6, 000 5, 750 5, 500 5, 250 5, 000 4, 750 4, 500 4, 250 4, 000 3, 750 3, 500 0 $7, 500 14, 500 21, 000 27, 000 32, 500 37, 500 42, 000 46, 000 49, 500 52, 500 55, 000 57, 000 58, 500 59, 500 60, 000 59, 500 $7, 500 7, 000 6, 500 6, 000 5, 500 5, 000 4, 500 4, 000 3, 500 3, 000 2, 500 2, 000 1, 500 1, 000 500 0 -500 Total Cost (TC) (5) Marginal Average Total Cost Profit or ( MC = (ACT = Loss = TC / Q) TC/Q) TR - TC (6) (7) (8) $15, 000 19, 750 23, 500 26, 500 29, 000 31, 000 32, 500 33, 750 35, 250 37, 250 40, 000 43, 250 48, 000 54, 500 64, 000 77, 500 96, 000 121, 000 4, 750 3, 000 2, 500 2, 000 1, 500 1, 250 1, 500 2, 000 2, 750 3, 250 4, 750 6, 500 9, 500 13, 500 18, 500 25, 000 -$15, 000 $19, 750 -12, 250 11, 750 9, 000 8, 830 -5, 500 7, 750 -2, 000 6, 200 1, 500 5, 420 5, 000 4, 820 8, 250 4, 410 10, 750 4, 140 12, 250 4, 000 12, 500 3, 930 11, 750 4, 000 9, 000 4, 190 4, 000 4, 570 -4, 500 5, 170 -7, 500 6, 000 -36, 000 7, 120 -61, 500 18
, the firm’s profit or loss")
Exhibit 6: Monopoly Costs and Revenue In panel (b), the firm’s profit or loss is measured by the vertical distance between the total revenue and total cost curves again profit is maximized where De Beers produces 10 diamonds per day (a) Per-Unit Cost and Revenue Marginal cost Dollars per unit Average total cost $5, 250 4, 000 a Profit b e MR 0 10 16 D = Average revenue 32 Diamonds per day (b) Total Cost and Revenue Maximum profit Total cost $52, 500 Total dollars The intersection of the two marginal curves at point e in panel (a) indicates that profit is maximized when 10 diamonds are sold. At this rate of output, we move up to the demand curve to find the profitmaximizing price of $5, 250. The average total cost of $4, 000 is identified by point b the average profit per diamond equals the price of $5, 250 minus the average total cost of $4, 000 $1, 250 economic profit is the equal to $1, 250 * 10 units sold $12, 500 as shown by the blue shaded area. 40, 000 Total revenue 15, 000 0 10 16 32 Diamonds per day 20

Monopolist’s Profit �In short run, monopolist earn THREE types of profit, same as perfect competition �Supernormal profit � TR > TC or P > ATC �Subnormal profit � TR < TC or P < ATC �Normal profit/ Breakeven profit � TR = TC

Supernormal Profit

Subnormal Profit

Normal profit

Long Run Equilibrium �In the long run, monopolist will only earn supernormal profits �This is because there are barriers to entry of new firms into the market

Long Run Profit

Monopolistic Short run Equilibrium Long run Equilibrium

Short Run Equilibrium �In the short run equilibrium, monopolist firms earn THREE types of profit �Supernormal profit � TR > TC or P > ATC �Subnormal profit � TR < TC or P < ATC �Normal profit � TR = TC

Supernormal Profit

Subnormal Profit

Normal Profit

Long Run Equilibrium �In the long run, a monopolistic competitive firm will earn normal profit

Long Run Equilibrium
- Slides: 33