Pawel Gawrychowski Haim Kaplan Shay Mozes Micha Sharir


 •")


- Slides: 82
Pawel Gawrychowski, Haim Kaplan, Shay Mozes, Micha Sharir, and Oren Weimann 1
Diameter • Compute the longest shortest path • Assume distinct distances, unique shortest paths 3
Diameter state of the art • 4
Our result • 5
Overview of the diameter algorithm • Compute an r-division • Intuitively this is a recursive application of the planar separator theorem 6
r-division
r-division
r-division
r-division
A piece
Another piece
r-division (Fredrickson 87) •
Three kinds of shortest paths • Between a vertex and a boundary vertex • Between two vertices inside the same piece • Between two vertices in different pieces
Dist. to/from boundary nodes
Distances to/from boundary nodes •
Between vertices in the same piece
Between vertices in the same piece
Inside pieces •
Vertices in diff. pieces
Between vertices in different pieces •
Voronoi diagram
Additively weighted Voronoi diagram
Voronoi diagram
Voronoi diagram
Maximum dist. between vertices in different pieces •
Compute the furthest in each cell
Voronoi diagram + max in cells •
Between vertices in different pieces •
Total time •
Representing the diagram
Voronoi vertices
Bisectors
Representing the diagram • 34
Compute the max from info on the bisectors •
Computing the bisectors
Computing the bisectors • 37
Computing the Bisectors
Computing the Bisectors
Computing the Bisectors
Computing the Bisectors
Computing the Bisectors
Computing the Bisectors
Computing the Bisectors
Computing the Bisectors
Computing the Bisectors
Computing the Bisectors
Computing the Bisectors
Computing the Bisectors
Computing the Bisectors
Computing the Bisectors
Computing the Bisectors
Bisectors • 53
Computing the Voronoi diagram • 55
Basic building block • Finding Voronoi vertices • First, in a diagram of 3 sites 56
Diagram of 3 sites 57
Diagram of 3 sites • Lemma: It has at most 2 Voronoi vertices 58
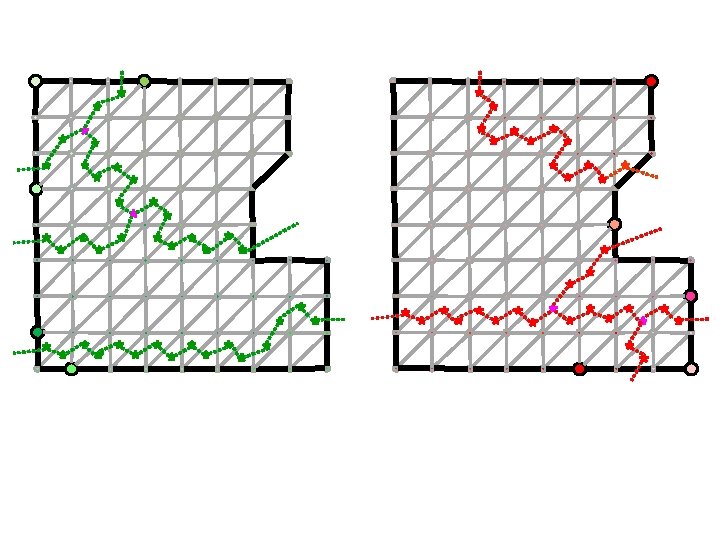
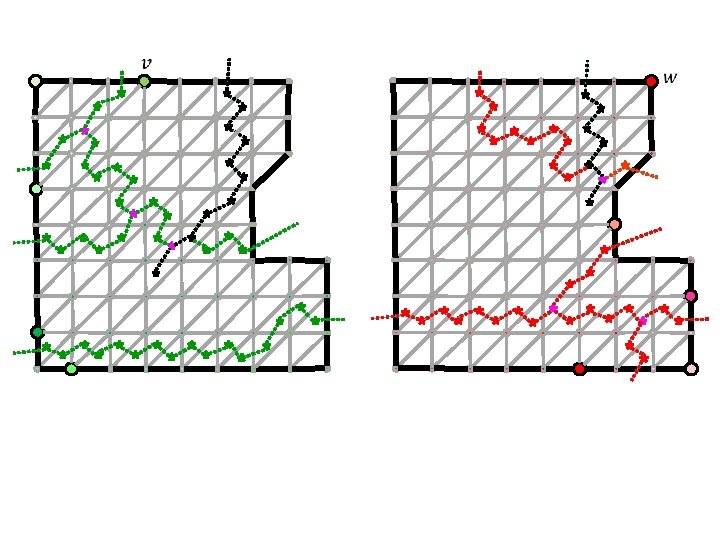
At most 2 Vor. vertices Proof: ? Shortest paths cannot cross. . 59
Computing the diagram of 3 sites
A diagram of 3 sites
A diagram of 3 sites
A diagram of 3 sites
A diagram of 3 sites
A diagram of 3 sites
A diagram of 3 sites • The blue site takes over an interval of the red/green bisector • The Voronoi vertices are the endpoints of this interval • We can find them by a binary search along the red/green bisector • Generalizes to a situation where instead of a single red/green/blue site we have a contiguous sequence of red/green/blue sites
Voronoi diagram • Traversing all triples of sites and finding the associated vertices is too expensive • Use divide and conquer
Divide and conquer
Divide and conquer
Divide and conquer
Divide and conquer
Max distance computation
Max distance computation
Max distance computation
Max distance computation
Max distance computation
Max distance computation
Max distance computation • Each dual vertex computes the max in its triangle • Vertices of the cotree compute subtree maxima • Gets somewhat more complicated in the presence of holes
Open problems • 88
Thanks 89
90