Patterns of Substitution and Replacement 1 2 3

Patterns of Substitution and Replacement 1

2

3

4

5

Pattern of Substitution* in Pseudogenes *Based on a sample of 105 mammalian retropseudogenes. 6

The sum of the relative frequencies of transitions is ~68% If all mutations occur with equal frequencies the expectation is 33% 7

In comparison to the 50% expectation, 59. 2% of all substitutions are from G and C, C and 56. 4% of all substitutions are to A and T. T 8 In the absence of selection, DNA will tend to become AT-rich
 9")
(CG dinucleotides excluded) 9

10

11

12

Pattern of Substitution* in mt. DNA *Based on 95 sequences from human and chimpanzee. 13

The sum of the relative frequencies of transitions is ~94% If all mutations occur with equal frequencies the expectation is 33% *Based on 95 sequences from human and chimpanzee. 14
 Effects 15")
Mutations: Strand (Leading and Lagging) Effects 15

Possible inequalities between strands A change from G to A actually means that a G: C pair is replaced by an A: T pair. This can occur as a result of either a G mutating to A in the one strand or a C to T mutation in the complementary strand. Similarly, a change from C to T can occur as a result of either a C mutating to T in one strand or a G mutating to A in the other. 16

Detection of Strand Inequalities in Mutation Rates • If G A on leading strand, then C T on lagging strand • If G A on lagging strand, then C T on leading strand • If G A on leading = G A on lagging, then G A = C T 17
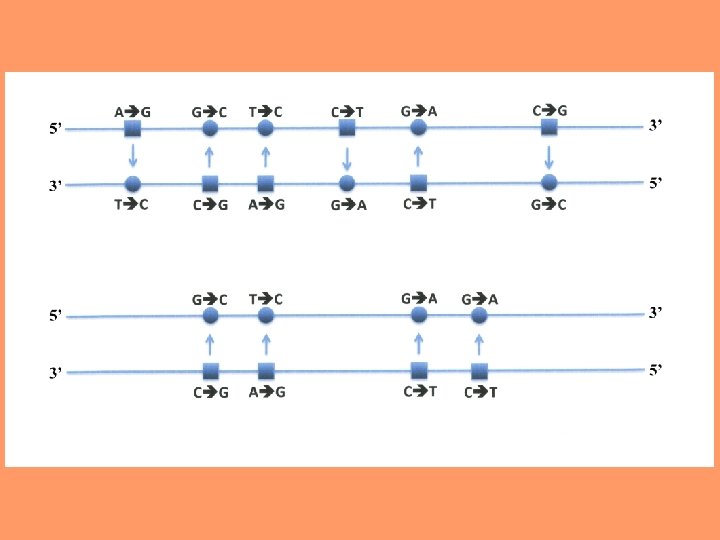

If there are no differences in the mutation pattern between the two strands, then 19
 is")
Is G A = C T? The transitional rate between pyrimidines (C, T) is much higher than that between purines (G, A) suggesting different patterns 20 and rates of mutation between the two strands.

Pattern of amino-acid replacement 21

Physicochemical distances = measures for quantifying the dissimilarity between two amino acids. 22

23

24

Grantham’s physicochemical distances between pairs of amino acids 25
")
The most similar amino acid pairs are leucine and isoleucine (Grantham's distance = 5) and leucine and methionine (Grantham's distance = 15). 26

215 202 The most dissimilar amino acid pairs 27

A replacement of an amino acid by a similar one (e. g. , leucine to isoleucine) is called a conservative replacement. A replacement of an amino acid by a dissimilar one (e. g. , glycine to tryptophan) is called a radical replacement. 28

Empirical findings: During evolution, amino acids are mostly replaced by similar ones. 29

Similar amino acids Dissimilar amino acids A lot A little 30

Similar Dissimilar 31

Kimura 1985 32

Exchanges between similar structures occur frequently. Exchanges between dissimilar structures occur rarely. Nothing happens, but if it does, it doesn’t matter. 33

Amino-acid exchangeability Numbers in parentheses denote codon family for amino acids encoded by two codon families Argyle’s exchangeability ring 60 -90% of the aminoacid replacements involve the nearest or second nearest neighbors in the ring 34

What protein properties are conserved in evolution? Protein specific constraints: The evolution of each protein-coding gene is constrained by the specific functional requirements of the protein it produces. General constraints: Are there general properties that are constrained during evolution in all proteins? 35
 high degree of conservation low 36")
bulkiness (volume) high degree of conservation low 36

hydrophobicity high degree of conservation low 37

polarity high degree of conservation low 38

optical rotation high degree of conservation low 39

surprise! optical charge rotation high degree of conservation low 40

41

42

43

44

45

46

Amino-acid composition may be an important factor in determining rates of nucleotide substitution. 47

Most conserved amino acids: Glycine is irreplaceable because of its small size. Lysine is irreplaceable because of its involvement in amidine bonds that crosslink polypeptide chains Cysteine is irreplaceable because of its involvement in cystine bonds that crosslink polypeptide chains Proline is irreplaceable because of its contribution to the contortion of proteins. 48

Does the frequency of amino acids in proteins reflect “functional need” or “availability”? 49

The frequencies of nucleotides in vertebrate m. RNA are 22. 0% uracil, 30. 3% adenine, 21. 7% cytosine, and 26. 1% guanine. 50

The expected frequency of a particular codon can be calculated by multiplying the frequencies of each of the nucleotides comprising the codon. 51

The expected frequency of the amino acid can be calculated by adding the frequencies of each codon that codes for that amino acid. 52

For example, the codons for tyrosine are UAU and UAC, so the random expectation for its frequency is: 1. 057[(0. 220)(0. 303)(0. 220) + (0. 220)(0. 303)(0. 217)] = 0. 0309 Since 3 of the 64 codons are stop codons, this frequency for each amino acid is multiplied by a correction factor of 1. 057. 53

By plotting the expected frequency against the observed frequency, we can see if some amino acids are occurring more or less often than expected by chance. If the observed and expected frequencies are close to equal, we would expect a regression line with a slope = 1. 54

Excluding arginine, the correlation between observed and expected frequencies was highly significant (r = 0. 9). Arginine frequency seems to be affected by selection acting 55 on one or more of its codons.
 • Amino acid frequencies are not determined by functional requirements. •")
Conclusions (? ) • Amino acid frequencies are not determined by functional requirements. • Amino acid frequencies are determined by nucleotide composition and the number of codons for each amino acid. 56
- Slides: 56