Patterns in Academic Library Computer Use Tito Sierra

Patterns in Academic Library Computer Use Tito Sierra North Carolina State University TRLN Annual Meeting 2009 July 24, 2009

Outline • • Computing at the D. H. Hill Library Motivation of Study Data Analysis Methodology Findings • • Usage by Semester Week Usage by Hour Usage by Location Usage by Platform

Computing at the D. H. Hill Library

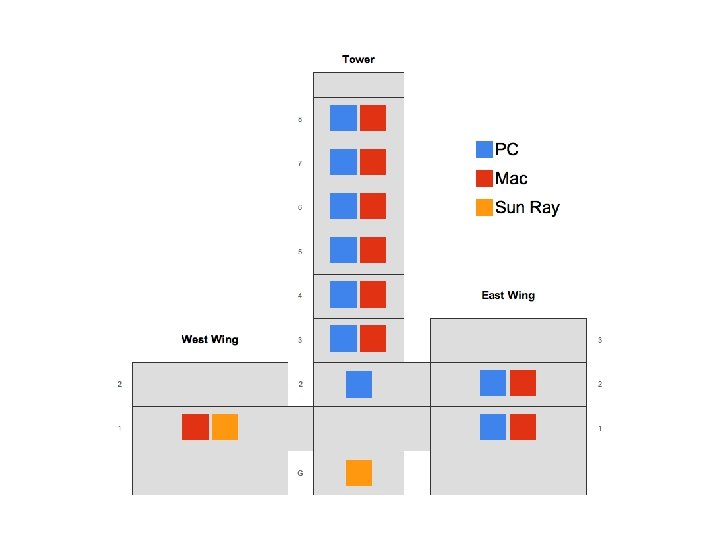
D. H. Hill Library • Main library on the NC State campus • ~266 library managed computers • Multiple computing platforms • PC • Mac • Sun Ray Thin-client • 11 computing locations on 9 floors
")
Ground Floor (Entrance)

West Wing

Learning Commons

Digital Media Lab

Tower

Distribution by Location

Distribution by Platform

Motivation of Study

Why Study Computer Usage? From a pragmatic POV, this analysis can inform decision-making in areas such as space management, staff support scheduling, and computer purchasing

Why Study Computer Usage? From a strategic POV, this analysis provides a tangible metric for describing the value of library services, specifically the use of the library physical space

Specific Questions 1. When are computers in greatest demand?

Specific Questions 1. When are computers in greatest demand? 2. What computing locations are most popular?

Specific Questions 1. When are computers in greatest demand? 2. What computing locations are most popular? 3. Are some computing platforms (PC, Mac) more popular than others?

Specific Questions 1. When are computers in greatest demand? 2. What computing locations are most popular? 3. Are some computing platforms (PC, Mac) more popular than others? 4. What trends in computer usage do we see over time?

Data Analysis Methodology

Data Collection • Snapshot of total computers in use • “Utilization” percentage • Segmented by location and platform • Census every 15 minutes • ~12, 096 counts per semester • Scope of this study • Spring 2008 • Spring 2009

Utilization Example #1 Wednesday 4/22/09, 2: 45 pm Digital Media Lab 9 out of 18 computers in use Utilization = 50%

Utilization Example #2 Wednesday 4/22/09, 2: 45 pm Learning Commons 92 out of 99 computers in use Utilization = 93%

Out of Scope • Login counts • How many logins a day/semester? • Login durations • How long is a user session? • User profiling • What software applications are used? • Who is using computers (grad/undergrad)?

Usage Patterns

Usage by Semester Week
")
Usage by Semester Week Y - axis: Utilization Percent (Averaged)

Usage by Semester Week Spring Break
")
Usage by Semester Week Spring Holiday (Easter)
")
Usage by Semester Week “Dead Week” (last week of classes before finals)

When is Demand Greatest? Computer usage steadily increases up until Spring Break, then builds up again to peak just before finals

Usage by Time of Day
")
Usage by Time of Day Data anomaly w/ Sun Rays (should be smooth)

Usage by Time of Day 5: 00 AM to 9: 00 AM

Usage by Time of Day 11: 00 AM to 1: 00 PM

Usage by Time of Day 6: 00 PM to 8: 00 PM

Usage by Time of Day 9: 00 PM to 10: 00 PM

When is Demand Greatest? Computer usage peaks around lunchtime and early afternoon, with a lesser peak occurring after dinner

When is Demand Greatest? Computer usage peaks around lunchtime and early afternoon, with a lesser peak occurring after dinner Surprising?
")
Usage by Location (Weekly)
")
Usage by Location (Hourly)
")
Usage by Location (Busiest Week)
 10: 00 AM to midnight")
Usage by Location (Busiest Week) 10: 00 AM to midnight

Location Preferences? Usage of computers in the Learning Commons is consistently greater than usage of computers in all other regions throughout the semester
")
Usage by Platform (Weekly)

Platform Preferences? Usage of PCs is consistently greater than Mac usage in all locations throughout the semester by a small margin Sun Rays are relatively unpopular (despite great “real estate”!)
 ? ? ?")
Usage by Platform (Weekly) ? ? ?

Spring Break Oddness During Spring Break, Mac and Sun Ray usage drops precipitously, but PC usage remains relatively high

Spring Break Oddness During Spring Break, Mac and Sun Ray usage drops precipitously, but PC usage remains relatively high Why?
")
Usage by Platform (Weekly)

Selective Seasonality The spike in computer usage at the end of the semester does not apply to the Sun Ray Thin-client computers

Thanks! Tito Sierra Digital Library Initiatives North Carolina State University Libraries tito_sierra@ncsu. edu
- Slides: 52