PatientCentered Outcomes of Health Care Comparative Effectiveness Research


 • Self-care • Role •")
 • Role limitations/physical (4 items)")

 Quality of environment Type of housing Level of income")
 – Generic (SF-36) • How much of")


 + (RP_Z * 0.")
 Better than Standard Care (SC)? CAM SC SC")


 ↑ 23")

 • Time trade-off (TTO) • Rating scale (RS)")
 = 0. 59 • Your health limits you a")
 Controlling for age, gender,")


 • 0. 90")


 difference Severity of Kidney Disease")
 Physical Functioning Age (years) (-)")
 Physical Functioning Age (years) Medium (-)")
 Physical Functioning Age (years) Medium (-) Effect size (ES)")
 Physical Functioning Age (years) Medium (-) r ˜ 0.")
 Obese yes = 1, no = 0 (Better)")
 Obese yes = 1, no = 0 Kidney")

 = D/SD D = raw score change in “changed”")
 Effect size (ES) = D/SD (2) Standardized Response Mean (SRM) =")


 • Probability of choosing each response category should be the")
 Men Women Location DIF White Slope DIF AA I cry")


")
/ SDbaseline Cohen’s Rule of Thumb: ü ES = 0.")

 Note: SDbl = standard deviation at baseline")


 75")


![In the past 7 days … I was grouchy [1 st question] – –](https://slidetodoc.com/presentation_image_h/933ea5cb9d16df4d4ece6fc7fc284bd1/image-80.jpg "In the past 7 days … I was grouchy [1 st question] – –")

![In the past 7 days … I felt angry [3 rd question] – –](https://slidetodoc.com/presentation_image_h/933ea5cb9d16df4d4ece6fc7fc284bd1/image-82.jpg "In the past 7 days … I felt angry [3 rd question] – –")

![In the past 7 days … I felt annoyed [5 th question] – –](https://slidetodoc.com/presentation_image_h/933ea5cb9d16df4d4ece6fc7fc284bd1/image-84.jpg "In the past 7 days … I felt annoyed [5 th question] – –")


 Powerpoint file available for downloading at: http:")
- Slides: 93
Patient-Centered Outcomes of Health Care Comparative Effectiveness Research February 3, 2015 9: 00 am – 12: 00 pm 16 -145 CHS Ron D. Hays, Ph. D. 1
Introduction to Patient-Reported Outcomes 9: 00 -10: 00 am 2
Determinants of Health Quality Of Care Health Characteristics Behavior Environment Chronic Conditions
Indicators of Health Signs and Symptoms of Disease Functioning Well-Being
Functioning and Well-Being • Functioning (what you can do) • Self-care • Role • Social • Well-being (how you feel) – – Pain Energy Depression Positive affect
SF-36 Generic Profile Measure • Physical functioning (10 items) • Role limitations/physical (4 items) • Role limitations/emotional (3 items) • Social functioning (2 items) • Emotional well-being (5 items) • Energy/fatigue (4 items) • Pain (2 items) • General health perceptions (5 items) 6
Indicators of Health Signs and Symptoms of Disease Functioning Well-Being
Health-Related Quality of Life (HRQOL) Quality of environment Type of housing Level of income Social Support 8
HRQOL Measurement Options • Multiple Scores (Profile) – Generic (SF-36) • How much of the time during the past 4 weeks have you been happy? (None of the time All of the time) – Targeted (“Disease specific”) • KDQOL-36 – My kidney disease interferes too much with my life. • Single Score – Preference-based (EQ-5 D, HUI, SF-6 D) • Combinations of above
HRQOL Scoring Options • 0 -100 possible range • T-scores (mean = 50, SD = 10) – (10 * z-score) + 50 • z-score = (score – mean)/SD • 0 (dead) to 1 (perfect health)
HRQOL in HIV Compared to other Chronic Illnesses and General Population T-score metric Hays et al. (2000), American Journal of Medicine 11
Normal Distribution Within 1 SD = 68. 2%, 2 SDs =95. 4%; 3 SDs = 99. 6%
HRQOL in HIV Compared to other Chronic Illnesses and General Population T-score metric Hays et al. (2000), American Journal of Medicine 13
HRQOL in HIV Compared to other Chronic Illnesses and General Population T-score metric Hays et al. (2000), American Journal of Medicine 14
HRQOL in HIV Compared to other Chronic Illnesses and General Population T-score metric Hays et al. (2000), American Journal of Medicine 15
Physical Functioning in Relation to Time Spent Exercising 2 -years Before 84 Hypertension 82 80 Diabetes 78 76 74 72 70 0 -100 range Current Depression 68 66 64 62 Low High Total Time Spent Exercising Stewart, A. L. , Hays, R. D. , Wells, K. B. , Rogers, W. H. , Spritzer, K. L. , & Greenfield, S. (1994). Long-term functioning and well-being outcomes associated with physical activity and exercise in patients with 16 chronic conditions in the Medical Outcomes Study. Journal of Clinical Epidemiology, 47, 719 -730.
Physical Health Physical function Role function physical Pain General Health 17
Mental Health Emotional Well-Being Role functionemotional Energy Social function 18
SF-36 PCS and MCS PCS_z = (PF_Z * 0. 42) + (RP_Z * 0. 35) + (BP_Z * 0. 32) + (GH_Z * 0. 25) + (EF_Z * 0. 03) + (SF_Z * -. 01) + (RE_Z * -. 19) + (EW_Z * -. 22) MCS_z = (PF_Z * -. 23) + (RP_Z * -. 12) + (BP_Z * -. 10) + (GH_Z * -. 02) + (EF_Z * 0. 24) + (SF_Z * 0. 27) + (RE_Z * 0. 43) + (EW_Z * 0. 49) PCS = (PCS_z*10) + 50 MCS = (MCS_z*10) + 50 19
Is Complementary and Alternative Medicine (CAM) Better than Standard Care (SC)? CAM SC SC CAM Physical Health Mental Health CAM > SC SC > CAM 20
Does Taking Medicine for HIV Lead to Worse HRQOL? Subject 1 2 3 4 5 6 7 8 9 10 Group Antiretrovirals HRQOL (0 -100) No No No Yes Yes Yes n No Antiretroviral 3 Yes Antiretoviral 5 dead 50 75 100 0 25 50 75 100 HRQOL 50 75 21
http: //www. ukmi. nhs. uk/Research/pharma_res. asp 22
Cost-Effectiveness of Health Care Cost ↓ Effectiveness (“Utility”) ↑ 23
“QALYs: The Basics” • Value is … – Preference or desirability of health states • Preferences can be used to – Compare different interventions on a single common metric (societal resource allocation) – Help make personal decisions about whether to have a treatment Milton Weinstein, George Torrance, Alistair Mc. Guire, Value in Health, 2009, vol. 12 Supplement 1. 24
Preference Elicitation • Standard gamble (SG) • Time trade-off (TTO) • Rating scale (RS) – http: //araw. mede. uic. edu/cgi-bin/utility. cgi Ø SG > TTO > RS Ø SG = TTOa Ø SG = RSb (Where a and b are less than 1) • Also discrete choice experiments
SF-6 D health state (424421) = 0. 59 • Your health limits you a lot in moderate activities (such as moving a table, pushing a vacuum cleaner, bowling or playing golf) • You are limited in the kind of work or other activities as a result of your physical health • Your health limits your social activities (like visiting friends, relatives etc. ) most of the time. • You have pain that interferes with your normal work (both outside the home and housework) moderately • You feel tense or downhearted and low a little of the time. • You have a lot of energy all of the time 26
HRQOL in SEER-Medicare Health Outcomes Study (n = 126, 366) Controlling for age, gender, race/ethnicity, education, income, 27 marital status, and the other 22 conditions.
Distant stage of cancer associated with 0. 05 -0. 10 lower SF-6 D Score 28
Break #1 29
Evaluation of Patient-reported Outcome Measures 10: 10 -11: 00 am 30
Aspects of Good Health-Related Quality of Life Measures Aside from being practical. . 1. Same people get same scores 2. Different people get different scores and differ in the way you expect 3. Measure is interpretable 4. Measure works the same way for different groups (age, gender, race/ethnicity)
Aspects of Good Health-Related Quality of Life Measures Aside from being practical. . 1. Same people get same scores 2. Different people get different scores and differ in the way you expect 3. Measure is interpretable 4. Measure works the same way for different groups (age, gender, race/ethnicity)
Reliability Degree to which the same score is obtained when the target or thing being measured (person, plant or whatever) hasn’t changed. ü Inter-rater (rater) üNeed 2 or more raters of the thing being measured ü Internal consistency (items) üNeed 2 or more items ü Test-retest (administrations) üNeed 2 or more time points
Ratings of 6 CTSI Presentations by 2 Raters [1 = Poor; 2 = Fair; 3 = Good; 4 = Very good; 5 = Excellent] 1= Jack Needleman (Good, Very Good) 2= Neil Wenger (Very Good, Excellent) 3= Ron Andersen (Good, Good) 4= Ron Hays (Fair, Poor) 5= Douglas Bell (Excellent, Very Good) 6= Martin Shapiro (Fair, Fair) (Target = 6 presenters; assessed by 2 raters)
Reliability and Intraclass Correlation Model Reliability Intraclass Correlation Two-way random Twoway mixed Oneway BMS = Between Ratee Mean Square N = n of ratees WMS = Within Mean Square k = n of items or raters JMS = Item or Rater Mean Square EMS = Ratee x Item (Rater) Mean Square 35
01 13 01 24 02 14 02 25 03 13 03 23 04 12 04 21 05 15 05 24 06 12 06 22 Two-Way Random Effects (Reliability of Ratings of Presentations) df Source Presenters (BMS) 5 Raters (JMS) 1 Pres. x Raters (EMS) 5 Total 11 SS 15. 67 0. 00 2. 00 MS 3. 13 0. 00 0. 40 17. 67 = 0. 89 2 -way R = 6 (3. 13 - 0. 40) 6 (3. 13) + 0. 00 - 0. 40 ICC = 0. 80 36
Responses of 6 CTSI Presenters to 2 Questions about Their Health 1= Jack Needleman (Good, Very Good) 2= Neil Wenger (Very Good, Excellent) 3= Ron Andersen (Good, Good) 4= Ron Hays (Fair, Poor) 5= Douglas Bell (Excellent, Very Good) 6= Martin Shapiro (Fair, Fair) (Target = 6 presenters; assessed by 2 items)
01 34 02 45 03 33 04 21 05 54 06 22 Two-Way Mixed Effects (Cronbach’s Alpha) Source SS df Presenters (BMS) 5 Items (JMS) 1 Pres. x Items (EMS) 5 Total Alpha = 11 15. 67 0. 00 2. 00 MS 3. 13 0. 00 0. 40 17. 67 3. 13 - 0. 40 = 2. 93 = 0. 87 3. 13 ICC = 0. 77 38
Reliability Minimum Standards • 0. 70 or above (for group comparisons) • 0. 90 or higher (for individual assessment) Ø SEM = SD (1 - reliability)1/2 Ø 95% CI = true score +/- 1. 96 x SEM Ø if z-score = 0, then CI: -. 62 to +. 62 when reliability = 0. 90 Ø Width of CI is 1. 24 z-score units 39
Item-scale correlation matrix 40
Item-scale correlation matrix 41
Aspects of Good Health-Related Quality of Life Measures Aside from being practical. . 1. Same people get same scores 2. Different people get different scores and differ in the way you expect 3. Measure is interpretable 4. Measure works the same way for different groups (age, gender, race/ethnicity)
Validity Does scale represent what it is supposed to be measuring? • Content validity: Does measure “appear” to reflect what it is intended to (expert judges or patient judgments)? – Do items operationalize concept? – Do items cover all aspects of concept? – Does scale name represent item content? • Construct validity – Are the associations of the measure with other variables consistent with hypotheses?
Relative Validity Example Sensitivity of measure to important (clinical) difference Severity of Kidney Disease None Mild Severe F-ratio Relative Validity Burden of Disease #1 87 90 91 2 -- Burden of Disease #2 74 78 88 10 5 Burden of Disease #3 77 87 95 20 10
Evaluating Construct Validity Scale (Better) Physical Functioning Age (years) (-)
Evaluating Construct Validity Scale (Better) Physical Functioning Age (years) Medium (-)
Evaluating Construct Validity Scale (Better) Physical Functioning Age (years) Medium (-) Effect size (ES) = D/SD D SD = Score difference = SD Small (0. 20), medium (0. 50), large (0. 80)
Evaluating Construct Validity Scale (Better) Physical Functioning Age (years) Medium (-) r ˜ 0. 24 Cohen effect size rules of thumb (d = 0. 20, 0. 50, and 0. 80): Small r = 0. 100; medium r = 0. 243; large r = 0. 371 r = d / [(d 2 + 4). 5] = 0. 80 / [(0. 802 + 4). 5] = 0. 80 / [(0. 64 + 4). 5] = 0. 80 / [( 4. 64). 5] = 0. 80 / 2. 154 = 0. 371
Evaluating Construct Validity Scale Age (years) Obese yes = 1, no = 0 (Better) Physical Functioning Medium (-) Small (-) Kidney Disease In Nursing home yes = 1, no = 0 Large (-) Cohen effect size rules of thumb (d = 0. 20, 0. 50, and 0. 80): Small r = 0. 100; medium r = 0. 243; large r = 0. 371 r = d / [(d 2 + 4). 5] = 0. 80 / [(0. 802 + 4). 5] = 0. 80 / [(0. 64 + 4). 5] = 0. 80 / [( 4. 64). 5] = 0. 80 / 2. 154 = 0. 371
Evaluating Construct Validity Scale Age (years) Obese yes = 1, no = 0 Kidney Disease In Nursing home yes = 1, no = 0 (Better) Physical Functioning Medium (-) Small (-) Large (-) (More) Depressive Symptoms ? Small (+) Cohen effect size rules of thumb (d = 0. 20, 0. 50, and 0. 80): Small r = 0. 100; medium r = 0. 243; large r = 0. 371 r = d / [(d 2 + 4). 5] = 0. 80 / [(0. 802 + 4). 5] = 0. 80 / [(0. 64 + 4). 5] = 0. 80 / [( 4. 64). 5] = 0. 80 / 2. 154 = 0. 371 (r’s of 0. 10, 0. 30 and 0. 50 are often cited as small, medium, and large. )
Responsiveness to Change • HRQOL measures should be responsive to interventions that change HRQOL • Need external indicator(s) of change (Anchors) – “Improved” group = 100% reduction in seizure frequency – Ambiguous group = 99%-50% reduction in seizure frequency – “Unchanged” group = <50% change in seizure frequency • Anchor correlated with change on target measure at 0. 371 or higher
Responsiveness Index Effect size (ES) = D/SD D = raw score change in “changed” (improved) group SD = baseline SD • Small: 0. 20 ->0. 49 • Medium: 0. 50 ->0. 79 • Large: 0. 80 or above
Responsiveness Indices (1) Effect size (ES) = D/SD (2) Standardized Response Mean (SRM) = D/SD† (3) Guyatt responsiveness statistic (RS) = D/SD‡ D = raw score change in “changed” group; SD = baseline SD; SD† = SD of D; SD‡ = SD of D among “unchanged”
Aspects of Good Health-Related Quality of Life Measures Aside from being practical. . 1. Same people get same scores 2. Different people get different scores and differ in the way you expect 3. Measure is interpretable 4. Measure works the same way for different groups (age, gender, race/ethnicity)
Amount of Expected Change Varies SF-36 physical function score mean = 87 (SD = 20) Assume I have a score of 100 at baseline v Hit by Bike causes me to be – limited a lot in vigorous activities – limited a lot in climbing several flights of stairs – limited a little in moderate activities SF-36 physical functioning score drops to 75 (-1. 25 SD) v Hit by Rock causes me to be – limited a little in vigorous activities SF-36 physical functioning score drops to 95 (- 0. 25 SD)
Partition Degree of Change on Anchor ØA lot better ØA little better <- MID ØNo change ØA little worse <- MID ØA lot worse
Aspects of Good Health-Related Quality of Life Measures Aside from being practical. . 1. Same people get same scores 2. Different people get different scores and differ in the way you expect 3. Measure is interpretable 4. Measure works the same way for different groups (age, gender, race/ethnicity)
Category Response Curves “Appreciating each day. ” No change Very great change Great change Moderate change Small change Very small change No Change q Great Change 58
Differential Item Functioning (DIF) • Probability of choosing each response category should be the same for those who have the same estimated scale score, regardless of other characteristics • Evaluation of DIF – Different subgroups – Mode differences
DIF (2 -parameter model) Men Women Location DIF White Slope DIF AA I cry when upset I get sad for no reason Higher Score = More Depressive Symptoms 60
Questions?
Break #2 62
Use of Patient-Reported Outcome Measures in Clinical Practice 11: 10 -12: 00 pm 63
Physical Functioning and Emotional Well-Being at Baseline for 54 Patients at UCLA-Center for East West Medicine EWB Physical MS = multiple sclerosis; ESRD = end-stage renal disease; GERD = gastroesophageal reflux disease. 64
Significant Improvement in all but 1 of SF-36 Scales (Change is in T-score metric) Change t-test prob. PF-10 1. 7 2. 38 . 0208 RP-4 4. 1 3. 81 . 0004 BP-2 3. 6 2. 59 . 0125 GH-5 2. 4 2. 86 . 0061 EN-4 5. 1 4. 33 . 0001 SF-2 4. 7 3. 51 . 0009 RE-3 1. 5 0. 96 . 3400 EWB-5 4. 3 3. 20 . 0023 PCS 2. 8 3. 23 . 0021 MCS 3. 9 2. 82 . 0067 65
Effect Size (Follow-up – Baseline)/ SDbaseline Cohen’s Rule of Thumb: ü ES = 0. 20 Small ü ES = 0. 50 Medium ü ES = 0. 80 Large 66
Effect Sizes for Changes in SF-36 Scores Effect Size 0. 13 0. 35 0. 21 0. 53 0. 36 0. 11 0. 41 0. 24 0. 30 PFI = Physical Functioning; Role-P = Role-Physical; Pain = Bodily Pain; Gen H=General Health; Energy = Energy/Fatigue; Social = Social Functioning; Role-E = Role-Emotional; EWB = Emotional Well-being; PCS = Physical Component Summary; MCS =Mental Component Summary. 0. 11 0. 13 0. 21 0. 24 0. 30 0. 35 0. 36 0. 41 0. 53 67
Defining a Responder: Reliable Change Index (RCI) Note: SDbl = standard deviation at baseline r xx = reliability 68
Significant Change > = 1. 96 69
Amount of Change in Observed Score Needed To be Statistically Significant Note: SDbl = standard deviation at baseline and rxx = reliability 70
Amount of Change in Observed Score Needed To be Statistically Significant If rxx = 0. 94 then 1. 41421356237 x 0. 24494897427 x 1. 96 = 0. 67 71
Amount of Change Needed for Significant Individual Change Effect Size 0. 67 0. 72 1. 01 1. 13 1. 33 1. 07 0. 71 1. 26 0. 62 0. 73 PFI = Physical Functioning; Role-P = Role-Physical; Pain = Bodily Pain; Gen H=General Health; Energy = Energy/Fatigue; Social = Social Functioning; Role-E = Role-Emotional; EWB = Emotional Well-being; PCS = Physical Component Summary; MCS =Mental Component Summary. 72
7 -31% Improve Significantly % Improving % Declining Difference PF-10 13% 2% + 11% RP-4 31% 2% + 29% BP-2 22% 7% + 15% GH-5 7% 0% + 7% EN-4 9% 2% + 7% SF-2 17% 4% + 13% RE-3 15% 0% EWB-5 19% 4% + 15% PCS 24% 7% + 17% MCS 22% 11% + 11% 73
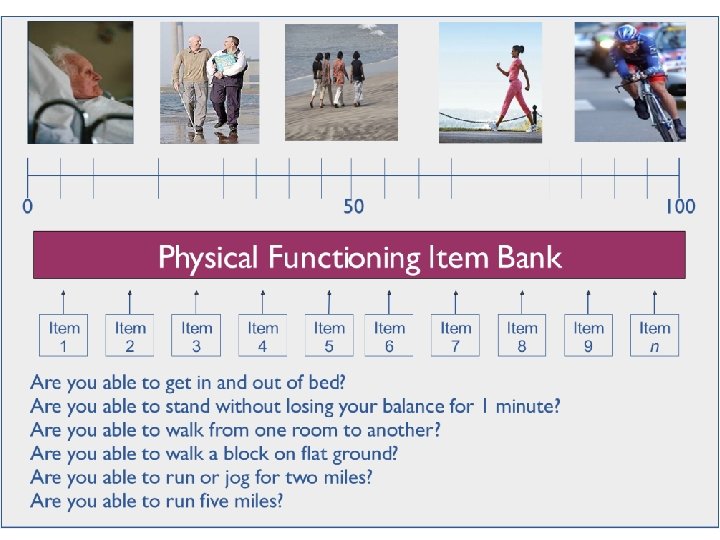
Item Responses and Trait Levels Person 1 Item 1 Person 2 Person 3 Item 2 Item 3 Trait Continuum 74
Computer Adaptive Testing (CAT) 75
PROMIS Measures • • Adult Health Measures ü More than 1, 000 individual items (questions) ü 51 distinct item banks or scales ü 20 languages Pediatric Health Measures ü More than 150 items (questions) ü 18 distinct banks or scales ü 8 languages www. nihpromis. org
The PROMIS Metric • T Score Mean = 50 SD = 10 Referenced to US General Pop. T = 50 + (z * 10) www. nihpromis. org
Reliability Target for Use of Measures with Individuals § Reliability ranges from 0 -1 § 0. 90 or above is goal § SE = SD (1 - reliability)1/2 § Reliability = 1 – (SE/10)2 § Reliability = 0. 90 when SE = 3. 2 § 95% CI = true score +/- 1. 96 x SE 79
In the past 7 days … I was grouchy [1 st question] – – – Never Rarely Sometimes Often Always Estimated Anger = 56. 1 SE = 5. 7 (rel. = 0. 68) [39] [48] [56] [64] [72] 80
In the past 7 days … I felt like I was ready to explode [2 nd question] – – – Never Rarely Sometimes Often Always Estimated Anger = 51. 9 SE = 4. 8 (rel. = 0. 77) 81
In the past 7 days … I felt angry [3 rd question] – – – Never Rarely Sometimes Often Always Estimated Anger = 50. 5 SE = 3. 9 (rel. = 0. 85) 82
In the past 7 days … I felt angrier than I thought I should [4 th question] - Never – – Rarely Sometimes Often Always Estimated Anger = 48. 8 SE = 3. 6 (rel. = 0. 87) 83
In the past 7 days … I felt annoyed [5 th question] – – – Never Rarely Sometimes Often Always Estimated Anger = 50. 1 SE = 3. 2 (rel. = 0. 90) 84
In the past 7 days … I made myself angry about something just by thinking about it. [6 th question] – – – Never Rarely Sometimes Often Always Estimated Anger = 50. 2 SE = 2. 8 (rel = 0. 92) 85
PROMIS Physical Functioning vs. “Legacy” Measures 10 20 30 40 50 60 70 86
Person Fit • Large negative ZL values indicate misfit. – one person who responded to 14 of the PROMIS physical functioning items had a ZL = -3. 13 – For 13 items the person could do the activity (including running 5 miles) without any difficulty. • But this person reported a little difficulty being out of bed for most of the day.
Person Fit Item misfit significantly related to: – Longer response time – More chronic conditions – Younger age
89
PROMIS CAT Report 90
91
“Implementing patient-reported outcomes assessment in clinical practice: a review of the options and considerations” Ø Snyder, C. F. , Aaronson, N. K. , et al. Quality of Life Research, 21, 1305 -1314, 2012. – HRQOL has rarely been collected in a standardized fashion in routine clinical practice. – Increased interest in using PROs for individual patient management. – Research shows that use of PROs: • Improves patient-clinician communication • May improve outcomes 92
Thank you drhays@ucla. edu (310 -794 -2294) Powerpoint file available for downloading at: http: //gim. med. ucla. edu/Faculty. Pages/Hays/ 93