Pathway Medicine Computational thinking series Peter Ghazal University


 • Observational/ phenomenological • Generally qualitative")


 in biology and")


 in the X signaling")


: 1. Mapping and")


- Slides: 49
Pathway Medicine Computational thinking series Peter Ghazal University of Edinburgh Medical School
Outline of Talk • The post-genomics challenge 1. Pathway Biology approach – notation system 2. Logic Interaction Diagram – Interferon pathway 3. Analysis of HTP data using pathway diagram. 4. Future perspective - Sensors for pathway logic
Central Dogma + GENETICS EPI-GENETICS DNA METABOLITE RNA PROTEIN
Pre-Genomic • Reductionist (DNA or RNA or Protein) • Observational/ phenomenological • Generally qualitative and non-numeric • Hypothesis driven Organism Cellular Molecular Post-Genomic • Global/ holistic • Systems approach (DNA and RNA and Protein) • Quantitative and highly numeric • Not only hypothesis driven but also data driven Molecular Cellular Organism
Variation and Scale in Biomolecules Scale Entity Dynamic Range 0 = 10 104 Genes DNA 105 Transcripts RNA = 101 - 102 105 Molecules Metabolite = 101 - 104 106 Forms = 101 - 106 Protein
16 probe pairs representing 1 gene 3, 200 features representing 100 genes 400, 000 pairs representing 12, 000 genes
Patient Variation – RNA profiling
The Need • Increasing use of molecular profiling (clinical or basic) in biology and medicine • Can expression signatures teach us about physiological systems response ? • Genes/proteins do not act alone but have behaviourally complex set of interactions • Challenge is to focus on pathways rather than individual genes
Approaches • Network biology – A formal study of interrelations – grounded in graph theory • Systems biology – A study of the functional assemblage of elements comprising a unified whole (cell/organism) • Pathway biology – A sub-system study of cause effect relationships with a defined start (input) and end (output).
Pathway Biology Pathway biology is an approach for understanding a biological process through the functional association of multiple gene products and metabolites defining networks of cause-effect relationships. • Mapping the molecular circuitry of a biological process – Who talks to who and when? • Key questions: - What is a biological pathway? - Does it have logic? - What are its boundaries? - How do pathways cross-talk? Selectivity Specificty
Why do we need them?
Dimensional complexity and scale
How do we tackle this? • A sub-systems level approach • Integration of experimental and in silico approaches • A diagram of a pathway would help: • • Has to be: Expressive and extensible Semantically and visually unambiguous: Mathematical translation Software support
A simple protein interaction dependency • An adaptor protein (A) in the X signaling pathway is known to interact with the activator of X (B) requiring phosphorylation by kinase (C) upon recruitment by A for activation. – Here 3 conditions need to be satisfied for B to activate factor X Conditions A the adaptor protein is present B requires phosphorylation by C for activation C binds A to act on B
Logic gate and block diagram • In the example P=1 only when A and B and C are all equal to 1 – Describes Boolian function called AND • Can be notated as a block diagram (electronic circuits) A B C P X
Caution: Engineered versus Evolved Systems • Engineered Circuits – Follow a defined set of rules – Boundaries well defined – Well understood knowledge base • Evolved Pathways – Rules are sketchy – Boundaries not clear – Knowledge clearly incomplete
Requires biological Notation • Kohn in 1999 proposed a notation system based on electronic circuit diagrams – Highly complex and not supported by software • Kitano in 2003 proposed simpler process/block diagram notation – Separate diagrams for process flow, entity states, and regulatory networks – software compatible • We have adapted the Kitano approach but emphasis is on logic interactions and integrated cell-signalling, interaction and regulatory networks. – Integrated diagrams combining cause-effect relationships with cellular compartment context – Importantly the notation has and is evolving with use (since 2003)
Aims of Notation • • • Accessible to biologists Compact Show localisation clearly Understandable for both wet & dry scientists Tolerant of incomplete knowledge Computable (Edinburgh Pathway Editor – Igor Goryanin) – Software tools – Maps to SBML www. SBGN. org : A graphical standard for notation of biological pathways
Notation Symbols States, Transitions and Processes Symbol Name Description Protein state transition Conversion of a protein from one state to another. Details of the state transition can be described in a sub diagram using the Kitano process notation. Complex formation Two or more proteins (or complexes) aggregating to form a complex. Dissociation A complex breaking apart to form two or more proteins or complexes. Translocation Movement of a protein or complex from one subcellular location to another. State The state of a complex or protein. If unlabeled the default or baseline state is indicated. Other states such as phosphorylated, acetylated, or “activated” are indicated by a suitable label. Details of the state are provided by a suitable sub diagram (using the Kitano process notation).
Notation Symbols Activation, Dependencies and Logic gates
Concepts • State transition • Activation • Logic Gate
Concepts • Localisation
Put it together…
WP 6. 2 Genomics and microbiology Interferon Signalling > A family of related proteins > Bind to specific receptors Activation of Interferon signalling results in a defined gene expression: Development of an Increased Inhibition of inflammatory response antigen presentation cellular proliferation Immune activation Anti-infective Anti-cancer
A logic diagram of the interferon pathway • Shown in the next slide is a subsystem logic interaction diagram of the interferon pathway. • Includes spatial cellular organisation • Generate a systems level informational pathway diagram.
WP 6. 2 interaction Genomics and microbiology Logic diagram of interferon pathway
Figure II. Integrated Molecular Interaction Map for IFN-gamma functional network C 1 Extracellular space Ifna Extracellular Antigen Endocyt. Ag-pep Ifnar 1 A 51 A 3 Ifngr 1 A 40 A 16 A 42 A 47 P Fnrsf 6 Tnf-a C 7 C 8 Trail-R 1/2 C 64 Tnfr 1 A 1 0 A 5 Endocytosed Antigen Late outgoing endosome membrane Trail C 5 Y 440 D 68 HLADRA HLADRB Clip HLADRB H 2 -DMa: H 2 -DMb HLAA/B/C Cytosolic Ag-pep Endocyt. Ag-pep + Ctsb Ctsd A 60 A 8 Psmb 8 D 71 Psma(1 -7): Psmb 9 A 46 A 43 Psmb(1 -4): Psmb 10 D 73 D 74 Ikbke Hrmt 1 l 2 A 52 B 59 Prkcd Psmb(1 -7) S 727 Psme 1 Psme 2 Arg 31 Ikbke Tbk 1 P Psme 2 B 73 P B 60 SH 2 domain B 74 Irf 3 A 45 P IAD B 75 Cytosol A 48 Y 690 P Camk 2 a Stat 2 Map 2 k 1/ Map 3 k 1 Ptk 2 b A 7 Au P A 6 A 13 Tbk 1 B 58 Psmb 10 C 9 Jak 2 P P A 53 Psmb 9 Psmb(1 -4): Psme 1(7) Irf 3 Psmb 8 A 67 Jak 1 P Psma(1 -7): D 72 Psmb(1 -4): Psma(1 -7) Tyk 2 A 44 P A 41 Y 701 Ctss Ser D 67 B 2 m HLADRB Endocyt. Ag-pep D 70 Endocyt. Ag-polypep Late outgoing endosome lumen HLADRB H 2 -Oa: H 2 -Ob D 69 D 70 D 66 Ser Ii Clip HLADRB A 29 P + A 39 SH 2 domain & A 15 | Psme 2 D 77 D 75 Psma(1 -7): Psmb(1 -4): Psma(1 -7) + Psmb 10 Psmb 9 P Irf 3: Irf 3 Psmb 9 Irf 7 A 20 A 64 P IAD B 78 P IAD Psme 1(7) C 53 Casp 9 P Casp 3 Stat 1 C 25 C 20 C 16 C 56 C 48 I-k. B Oas P C 23 C 21 C 22 Prkr C 35 C 3 Casp 9 2, 5 A A 22 & & NF-k. B Complex Isgf 3 g NLS A 50 C 52 Stat 1 Caspases Initiators C 50 C 56 C 31 C 30 Bak Mitochondiral lumen Inhibit Release of Cyt. C Cause Release of Cyt. C Bax C 29 C 33 C 32 C 28 Mitochondrial membrane Apaf-1 Cyt. C Bax NF-k. B Complex Cytosolic Ag-pep C 57 Casp 7 C 34 C 36 A 19 Stat 1 Prkr C 66 & 2, 5 A System C 49 C 2 ta Cytosolic Antigen Casp 8 C 15 C 24 C 62 A 58 Ran Ser 51 e. IF 2 -a C 54 & & Caspases Effectors C 18 Casp 8 A 14 A 57 Mapk 14 B 79 B 61 Irf 3: Irf 3 Mapk 1 | Cebpb A 18 Kpna 1 Irf 5 Psme 2 D 78 C 4 C 55 C 17 A 17 Irf 3 P Psmb 8 B 77 P Mapk 3 Irf 1 B 64 C 13 Sat 1 C 19 Prkr A 49 P Psmb 10 Ifng Stat 1 A 56 P A 34 P Tradd C 14 Map 2 k 2 | A 56 A 62 P IAD B 76 Psmb 8 D 76 C 11 C 12 Fadd Stat 1 Irf 7 Psme 1(7) C 10 Pact P Map 2 k 1 A 65 GDP GTP A 59 Rac 1 + ds. RNA | A 55 P MAPKK (Identity not Known) Vav A 38 NLS A 12 = A 21 & P P Pias 1 A 1 P 1 M A 55 Prkr Ingoing endosome Ifnar 2 Tnfsf 6 A 4 P B 2 m * C 6 & C 65 Ifngr 2 Y 466 HLA-A/B/C HLA-DRB C 2 = A 37 Cytosolic Ag-pep HLA-DRA A 36 | A 54 Ifng A 1 A 2 A 35 Cell membrane Ifng Ifnb Bcl-x. L C 26 C 27 Bcl-2 Cyt. C Lysosome membrane Ii HLADRB B 2 m H 2 -DMa: H 2 -DMb HLADRB Ctsd H 2 -Oa: H 2 -Ob Endocytosed Antigen + D 65 Lysosome lumen D 64 Early outgoing endosome membrane HLADRB Ctss + HLADRB Ii Ctsh B 2 m H 2 -DMa: H 2 -DMb H 2 -Oa: H 2 -Ob Early outgoing endosome lumen HLAA/B/C Cytosolic Ag-pep Ctsb Endocytosed Antigen + HLAA/B/C Cytosolic Ag-pep Ctsb D 63 Ctss Golgi membrane Isgf 3 g B 2 m H 2 -DMa: H 2 -DMb H 2 -Oa: H 2 -Ob Golgi lumen D 60 HLADRA HLADRB Ii D 61 ER Lumen HLA-DRA HLA-DRB & Ctss B 2 m HLA-C HLA-B HLA-A & Tap 1: Tap 2 HLAA/B/C Cytosolic Ag-pep H 2 -Oa: H 2 -Ob D 62 Ii D 79 B 2 m H 2 -DMa: H 2 -DMb D 61 D 80 Tap 1 Tap 2 Cytosolic Ag-pep Isgf 3 g T Cytosolic Ag-pep B 2 m XPO 1 B 2 m Tap 1 Tap 2 T Nmi & P Irf 7 Irf 3: Irf 3 T P Irf 1 MCM 5 P Irf 7 P Irf 3 P P Irf 7 Irf 5 BRCA 1 D 54 B 80 Psmb 9 B 65 Hist 4 h 4 + Usf 2 D 15 Rfxank Nfyc D 19 D 22 D 16 D 12 Rfx 5 Psme 1 D 18 Creb 1 D 58 P S 133 T D 56 D 6 Psmb 10 Nfkb 1 -Rela Psme 2 B 84 Rela A 27 + | | Y 701 & Stat 1 & + + P P Y 701 & + & Stat 1 + A 27 A 33 A 32 Tradd A 22 A 33 A 28 A 30 | | C 51 T Ifna 14 T B 86 T Ifna 4 Ifna 7 T Ifna 11 TFII-I Gtf 2 i T A 31 Tnfsf 6 C 44 B 25 IRF 7 ISRE B 11 Ep 300 B 5 Stat 2 B 47 i i GAS T B 30 ISRE T Tnfsf 6 C 60 Oas C 47 T B 23 B 22 B 56 T & Icsbp 1 T P Ser Tyr 220 & Icsbp 1 B 37 D 4 D 5 Irf 2 Ac P B 34 B 47 i CD 23 b GAS T * Il 1 b B 38 T Casp 1 T B 6 (=C 43) Prkr Tnfrsf 6 | T Tnfrsf 6 Prkr B 8 C 45 T C 46 T Oas Itgam Irf 1 B 10 P Icsbp 1 B 2 Stat 1 T Isgf 3 g GAS B 3 B 13 i B 52 T B 29 ISRE G 1 p 2 B 14 IRF-E Cdkn 1 a B 49 T Myc B 15 Cybb B 24 T ET S + Fcer 2 a Tyr 226 B 33 B 45 B 9 (=C 42) B 32 (=C 41) T B 13 i i B 48 B 43 B 46 Casp 1 T Isgf 3 g Sfpi 1 B 44 C 40 Irf 1 B 12 B 41 Casp 7 B 27 B 35 B 36 Fkbp 4 T Casp 8 Casp 3 Irf 1 Ac B 26 B 40 B 42 Stat 6 Casp 7 Casp 3 T Casp 8 B 1 Irf 1 B 17 T B 31 B 39 Casp 8 T Irf 1 Pcaf D 7 D 8 Irf 4 Bcl-xl C 39 B 4 T * T D 1 D 2 D 3 Bcl-x. L T Stat 1 A 66 Ifna 1 GAS C 2 ta Bcl-2 C 38 C 37 Pcaf K 141 Ac K 144 Ac C 2 ta Bcl-2 T Bak C 58 C 57 Crebbp D 59 Crebbp Bak Rnase. L + | B 86 B 85 B 84 T PRDI B 21 Psme 2 T & B 83 B 89 B 67 PRDIII T D 57 Psme 1 D 10 C 2 ta D 21 Usf 1 D 17 D 20 Nfyb Psmb 8 Usf 1 Rfxap P P + A 27 PEST D 9 D 13 D 14 PRDII B 57 Psmb 10 Ccl 5 PES T Nfya PRDIV D 23 Psmb 8 B 82 B 55 ISRE & B 88 B 66 B 81 B 54 Atf 2: Jun A 26 Stat 1 T Hmga 1 T IFNg P & & Stat 1 + + A 27 A 32 Y 701 B 87 Psmb 9 D 55 Nucleoplasm P Stat 2 Tnfrsf 6 Icsbp 1 Stat 1: Stat 1 + NF-k. B complex Sp 1 Irf 2 Irf 4 A 32 A 25 B 72 D 53 D 52 P P B 62 Crebbp Irf 1 Stat 2 Irf 3: Irf 3 T Ep 300 D 51 D 48 Tap 2 Tap 1 & B 2 m & + D 50 D 43 D 42 T D 49 D 44 D 45 HLA-B & + D 47 D 38 D 39 D 37 T D 40 D 36 & + D 32 D 31 HLA-B HLA-A T D 46 HLA-A D 33 HLA-C T D 29 D 41 HLA-C Ctss T D 24 D 30 D 28 D 35 HLA-DRB T D 27 Isgf 3 g ISR E D 26 D 34 HLA-DRB Ii T & D 25 A 23 Kpna 4 NES Ii HLA-DRA | A 24 Stat 1 Kpna 3 B 63 P A 23 P Nuclear membrane * Il 12 b T B 50 T MSE GAT E ERcytosol membrane HLAA/B/C Cytosolic Ag-pep Ctss Tnfsf 6 HLADRB Ii D 82 HLADRB B 16 Il 12 a T Protein Synthesis Inhibition RNA Degradation Apoptosis DNA Degradation, , Cell shrinkage and Membrane blebbing etc
Network Topology of IFN Pathway Ct 2 a Stat 1 Irf 1 Stat 2 Irf 3 Irf 7 Paul Lacaze
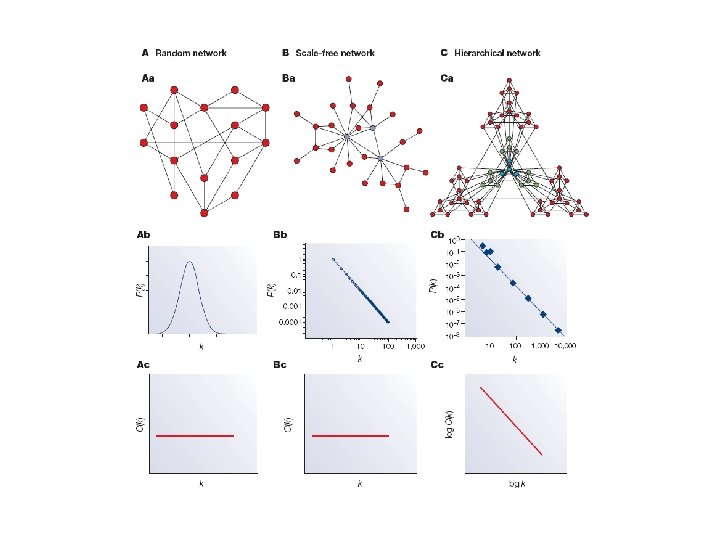
Scale-Free Network - robustness • Probability that each protein/gene contributes to k interactions follows a powerlaw distribution - value γ ~2 – consistent with the network exhibiting scale-free properties. – Calculated average diameter of the consensus pathway is 5. 2 (average number of links connecting each node) – Compactness of the pathway diameter is open for network segregation affording both a level of flexibility and adaptability in the pathway.
MΦ response to interferonγ activation versus viral infection Interferon I Interferon+virus I virus
Active sub-network determination The p-value representing the significance of expression change pg for gene g, which is converted into a z-score Φ = normal cumulative distribution function The aggregate z-score z. G of an entire sub-network G is obtained by summing the individual z-scores of all genes in the sub-network where K is the cardinality of G : The z-score of a randomly selected gene set of size K is computed and the procedure repeated for different random sets, giving the mean μk and standard deviation σK. Computation is repeated for all possible cardinalities K. Using these estimates, the calibrated sub-network score is defined as A high score of x. G indicates a biologically active sub-network Ideker et al (2002) Bioinformatics, 18, 233 -240.
psmb 8 psmb 10 il 12 a bak bcl 2 tnfrsf 6 bcl-xl State-variant properties = Infected Subnetwork 1 stat 2 fkbp 4 il 1 b irf 1 irf 4 stat 1 psmb 9 tap 1 sfpi 1 stat 6 irf 2 casp 8 casp 1 fcer 2 a isgf 3 g prkr irf 3 casp 7 c 2 ta ctss oas 1 casp 9 irf 7 cdkn 1 a lcsbp 1 tnfsf 6 irf 5 g 1 p 2 hla-c hla-b hla-a hla-drb hla-dra b 2 m il 12 b ii itgam cybb tap 2 casp 3 hist 4 h 4 ifna 11 lfnb ifna 14 ifna 4 psme 1 psme 2 ccl 5
psmb 8 psmb 10 il 12 a bak bcl 2 tnfrsf 6 State-variant property 3 = IFN treated bcl-xl Subnetwork 3 stat 2 fkbp 4 il 1 b irf 1 irf 4 stat 1 psmb 9 tap 1 sfpi 1 stat 6 irf 2 casp 8 casp 1 fcer 2 a isgf 3 g prkr irf 3 casp 7 c 2 ta ctss oas 1 casp 9 irf 7 cdkn 1 a lcsbp 1 tnfsf 6 irf 5 g 1 p 2 hla-c hla-b hla-a hla-drb hla-dra b 2 m il 12 b ii itgam cybb tap 2 casp 3 hist 4 h 4 ifna 11 lfnb ifna 14 ifna 4 psme 1 psme 2 ccl 5
psmb 8 psmb 10 il 12 a bak bcl 2 tnfrsf 6 State variant property 2 = Infected+ IFN treated bcl-xl stat 2 fkbp 4 il 1 b irf 1 irf 4 stat 1 psmb 9 tap 1 sfpi 1 stat 6 irf 2 casp 8 casp 1 fcer 2 a isgf 3 g prkr irf 3 casp 7 c 2 ta ctss oas 1 casp 9 irf 7 cdkn 1 a lcsbp 1 tnfsf 6 irf 5 g 1 p 2 hla-c hla-b hla-a hla-drb hla-dra b 2 m il 12 b ii itgam cybb tap 2 casp 3 hist 4 h 4 ifna 11 lfnb ifna 14 ifna 4 psme 1 psme 2 ccl 5
Shared sub-network Viral activated Sub-network
Figure II. Integrated Molecular Interaction Map for IFN-gamma functional network C 1 Extracellular space Ifna Extracellular Antigen Endocyt. Ag-pep Ifnar 1 A 51 A 3 Ifngr 1 A 40 A 16 A 42 A 47 P Fnrsf 6 Tnf-a C 7 C 8 Trail-R 1/2 C 64 Tnfr 1 A 1 0 A 5 Endocytosed Antigen Late outgoing endosome membrane Trail C 5 Y 440 D 68 HLADRA HLADRB Clip HLADRB H 2 -DMa: H 2 -DMb HLAA/B/C Cytosolic Ag-pep Endocyt. Ag-pep + Ctsb Ctsd A 60 A 8 Psmb 8 D 71 Psma(1 -7): Psmb 9 A 46 A 43 Psmb(1 -4): Psmb 10 D 73 D 74 Ikbke Hrmt 1 l 2 A 52 B 59 Prkcd Psmb(1 -7) S 727 Psme 1 Psme 2 Arg 31 Ikbke Tbk 1 P Psme 2 B 73 P B 60 SH 2 domain B 74 Irf 3 A 45 P IAD B 75 Cytosol A 48 Y 690 P Camk 2 a Stat 2 Map 2 k 1/ Map 3 k 1 Ptk 2 b A 7 Au P A 6 A 13 Tbk 1 B 58 Psmb 10 C 9 Jak 2 P P A 53 Psmb 9 Psmb(1 -4): Psme 1(7) Irf 3 Psmb 8 A 67 Jak 1 P Psma(1 -7): D 72 Psmb(1 -4): Psma(1 -7) Tyk 2 A 44 P A 41 Y 701 Ctss Ser D 67 B 2 m HLADRB Endocyt. Ag-pep D 70 Endocyt. Ag-polypep Late outgoing endosome lumen HLADRB H 2 -Oa: H 2 -Ob D 69 D 70 D 66 Ser Ii Clip HLADRB A 29 P + A 39 SH 2 domain & A 15 | Psme 2 D 77 D 75 Psma(1 -7): Psmb(1 -4): Psma(1 -7) + Psmb 10 Psmb 9 P Irf 3: Irf 3 Psmb 9 Irf 7 A 20 A 64 P IAD B 78 P IAD Psme 1(7) C 53 Casp 9 P Casp 3 Stat 1 C 25 C 20 C 16 C 56 C 48 I-k. B Oas P C 23 C 21 C 22 Prkr C 35 C 3 Casp 9 2, 5 A A 22 & & NF-k. B Complex Isgf 3 g NLS A 50 C 52 Stat 1 Caspases Initiators C 50 C 56 C 31 C 30 Bak Mitochondiral lumen Inhibit Release of Cyt. C Cause Release of Cyt. C Bax C 29 C 33 C 32 C 28 Mitochondrial membrane Apaf-1 Cyt. C Bax NF-k. B Complex Cytosolic Ag-pep C 57 Casp 7 C 34 C 36 A 19 Stat 1 Prkr C 66 & 2, 5 A System C 49 C 2 ta Cytosolic Antigen Casp 8 C 15 C 24 C 62 A 58 Ran Ser 51 e. IF 2 -a C 54 & & Caspases Effectors C 18 Casp 8 A 14 A 57 Mapk 14 B 79 B 61 Irf 3: Irf 3 Mapk 1 | Cebpb A 18 Kpna 1 Irf 5 Psme 2 D 78 C 4 C 55 C 17 A 17 Irf 3 P Psmb 8 B 77 P Mapk 3 Irf 1 B 64 C 13 Sat 1 C 19 Prkr A 49 P Psmb 10 Ifng Stat 1 A 56 P A 34 P Tradd C 14 Map 2 k 2 | A 56 A 62 P IAD B 76 Psmb 8 D 76 C 11 C 12 Fadd Stat 1 Irf 7 Psme 1(7) C 10 Pact P Map 2 k 1 A 65 GDP GTP A 59 Rac 1 + ds. RNA | A 55 P MAPKK (Identity not Known) Vav A 38 NLS A 12 = A 21 & P P Pias 1 A 1 P 1 M A 55 Prkr Ingoing endosome Ifnar 2 Tnfsf 6 A 4 P B 2 m * C 6 & C 65 Ifngr 2 Y 466 HLA-A/B/C HLA-DRB C 2 = A 37 Cytosolic Ag-pep HLA-DRA A 36 | A 54 Ifng A 1 A 2 A 35 Cell membrane Ifng Ifnb Bcl-x. L C 26 C 27 Bcl-2 Cyt. C Lysosome membrane Ii HLADRB B 2 m H 2 -DMa: H 2 -DMb HLADRB Ctsd H 2 -Oa: H 2 -Ob Endocytosed Antigen + D 65 Lysosome lumen D 64 Early outgoing endosome membrane HLADRB Ctss + HLADRB Ii Ctsh B 2 m H 2 -DMa: H 2 -DMb H 2 -Oa: H 2 -Ob Early outgoing endosome lumen HLAA/B/C Cytosolic Ag-pep Ctsb Endocytosed Antigen + HLAA/B/C Cytosolic Ag-pep Ctsb D 63 Ctss Golgi membrane Isgf 3 g B 2 m H 2 -DMa: H 2 -DMb H 2 -Oa: H 2 -Ob Golgi lumen D 60 HLADRA HLADRB Ii D 61 ER Lumen HLA-DRA HLA-DRB & Ctss B 2 m HLA-C HLA-B HLA-A & Tap 1: Tap 2 HLAA/B/C Cytosolic Ag-pep H 2 -Oa: H 2 -Ob D 62 Ii D 79 B 2 m H 2 -DMa: H 2 -DMb D 61 D 80 Tap 1 Tap 2 Cytosolic Ag-pep Isgf 3 g T Cytosolic Ag-pep B 2 m XPO 1 B 2 m Tap 1 Tap 2 T Nmi & P Irf 7 Irf 3: Irf 3 T P Irf 1 MCM 5 P Irf 7 P Irf 3 P P Irf 7 Irf 5 BRCA 1 D 54 B 80 Psmb 9 B 65 Hist 4 h 4 + Usf 2 D 15 Rfxank Nfyc D 19 D 22 D 16 D 12 Rfx 5 Psme 1 D 18 Creb 1 D 58 P S 133 T D 56 D 6 Psmb 10 Nfkb 1 -Rela Psme 2 B 84 Rela A 27 + | | Y 701 & Stat 1 & + + P P Y 701 & + & Stat 1 + A 27 A 33 A 32 Tradd A 22 A 33 A 28 A 30 | | C 51 T Ifna 14 T B 86 T Ifna 4 Ifna 7 T Ifna 11 TFII-I Gtf 2 i T A 31 Tnfsf 6 C 44 B 25 IRF 7 ISRE B 11 Ep 300 B 5 Stat 2 B 47 i i GAS T B 30 ISRE T Tnfsf 6 C 60 Oas C 47 T B 23 B 22 B 56 T & Icsbp 1 T P Ser Tyr 220 & Icsbp 1 B 37 D 4 D 5 Irf 2 Ac P B 34 B 47 i CD 23 b GAS T * Il 1 b B 38 T Casp 1 T B 6 (=C 43) Prkr Tnfrsf 6 | T Tnfrsf 6 Prkr B 8 C 45 T C 46 T Oas Itgam Irf 1 B 10 P Icsbp 1 B 2 Stat 1 T Isgf 3 g GAS B 3 B 13 i B 52 T B 29 ISRE G 1 p 2 B 14 IRF-E Cdkn 1 a B 49 T Myc B 15 Cybb B 24 T ET S + Fcer 2 a Tyr 226 B 33 B 45 B 9 (=C 42) B 32 (=C 41) T B 13 i i B 48 B 43 B 46 Casp 1 T Isgf 3 g Sfpi 1 B 44 C 40 Irf 1 B 12 B 41 Casp 7 B 27 B 35 B 36 Fkbp 4 T Casp 8 Casp 3 Irf 1 Ac B 26 B 40 B 42 Stat 6 Casp 7 Casp 3 T Casp 8 B 1 Irf 1 B 17 T B 31 B 39 Casp 8 T Irf 1 Pcaf D 7 D 8 Irf 4 Bcl-xl C 39 B 4 T * T D 1 D 2 D 3 Bcl-x. L T Stat 1 A 66 Ifna 1 GAS C 2 ta Bcl-2 C 38 C 37 Pcaf K 141 Ac K 144 Ac C 2 ta Bcl-2 T Bak C 58 C 57 Crebbp D 59 Crebbp Bak Rnase. L + | B 86 B 85 B 84 T PRDI B 21 Psme 2 T & B 83 B 89 B 67 PRDIII T D 57 Psme 1 D 10 C 2 ta D 21 Usf 1 D 17 D 20 Nfyb Psmb 8 Usf 1 Rfxap P P + A 27 PEST D 9 D 13 D 14 PRDII B 57 Psmb 10 Ccl 5 PES T Nfya PRDIV D 23 Psmb 8 B 82 B 55 ISRE & B 88 B 66 B 81 B 54 Atf 2: Jun A 26 Stat 1 T Hmga 1 T IFNg P & & Stat 1 + + A 27 A 32 Y 701 B 87 Psmb 9 D 55 Nucleoplasm P Stat 2 Tnfrsf 6 Icsbp 1 Stat 1: Stat 1 + NF-k. B complex Sp 1 Irf 2 Irf 4 A 32 A 25 B 72 D 53 D 52 P P B 62 Crebbp Irf 1 Stat 2 Irf 3: Irf 3 T Ep 300 D 51 D 48 Tap 2 Tap 1 & B 2 m & + D 50 D 43 D 42 T D 49 D 44 D 45 HLA-B & + D 47 D 38 D 39 D 37 T D 40 D 36 & + D 32 D 31 HLA-B HLA-A T D 46 HLA-A D 33 HLA-C T D 29 D 41 HLA-C Ctss T D 24 D 30 D 28 D 35 HLA-DRB T D 27 Isgf 3 g ISR E D 26 D 34 HLA-DRB Ii T & D 25 A 23 Kpna 4 NES Ii HLA-DRA | A 24 Stat 1 Kpna 3 B 63 P A 23 P Nuclear membrane * Il 12 b T B 50 T MSE GAT E ERcytosol membrane HLAA/B/C Cytosolic Ag-pep Ctss Tnfsf 6 HLADRB Ii D 82 HLADRB B 16 Il 12 a T Protein Synthesis Inhibition RNA Degradation Apoptosis DNA Degradation, , Cell shrinkage and Membrane blebbing etc
MHC class II surface expression
Linking wet to dry and back • Knowledge discovery (data mining): 1. Mapping and finding patterns 2. Forming hypotheses 3. Test using in vivo/in vitro experiments • Simulation-based analysis (modelling): 1. In silico hypothesis testing 2. Forming predictions 3. Confirm using in vivo/in vitro experiments
A Patient’s View
Challenge is to measure pathway logic in situ • Future need to develop sensors that register and interact with pathway logic: Genomic nanoprocessors • Aim to develop first generation bio-switch as a building block for biosensor and future research in bio -computing Initial embodiment of a genomic nanoprocessor – a DNA molecule. . . - Allows genomic interactions (biomolecular detection) – which can switch between two configurations. . . - Allows logic micro/nanoprocessing - Holliday junction – with switching controlled by electronics - Electrochemically controlled switching
Genomic Nanoprocessors Solution λ 1 λ 2 Attached bioswitches Electrochemical Film Metal Electrode Silicon Dioxide
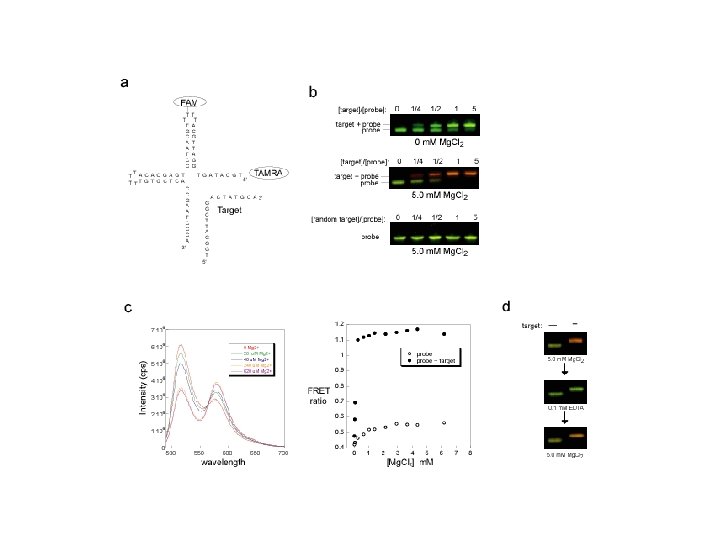
Branched DNA Intermediates – 4 Way HJs • Screening by ions: • Collapses the branch point • Helices stack in coaxial pairs ‘OPEN’ Conformation ‘CLOSED’ Conformation
Detecting HJ Switching with FRET Donor Acceptor Emission Excitation Emission Light spectrum >r 0 Low salt No FRET λ 1 λ 2 D ‘OPEN’ < r 0 A A λ 3 D ro ~ 100Å High salt FRET occurs A ‘CLOSED’
Preliminary Device Demonstration Electrochemical switching of HJ populations in a droplet BIOMOLECULE INSULATION Thermal Oxide Normalised Intensity METAL ELECTRODE 1 0 Silicon Substrate
Future promise: DNA computing element as a potential medicine • DNA switch as a computing/logic processor • Integrated pathway discovery incorporating laboratory and clinical research with DNA computing device • Advanced intelligent biosensors Programmed to interface with pathway logic • AI analysis of molecular signatures Challenge of detecting and monitoring of signature as part of a closed system – bio-intelligent medication
Convergence of disciplines in pathway medicine Biochips Systems Biology Informatics & AI Microelectronics In situ In vitro Pathway Nanoprocessors Therapeutics Diagnostics Devices In silico
Thank you www. gti. ed. ac. uk Peter Ghazal, Stuart Moodie, Alan J. Ross, Garwin Sing, Anatoly Sorokin, Adriano Velasque Werhli, Lily Cho, Tobias Frankenberg, Li-kun Phng, Zhenjie Xu, Lee Chuin Yao , Kevin Robertson, Paul Dickinson, Marie Craigon, Thorsten Forster, Douglas Roy, John Beattie, Alex Selkov, Igor Goryanin, Dirk Husmeier. Amy Buck, Jon Terry, Chris Mountford, Jason Crain, Anthony Walton, Colin Campbell, Andy Mount,