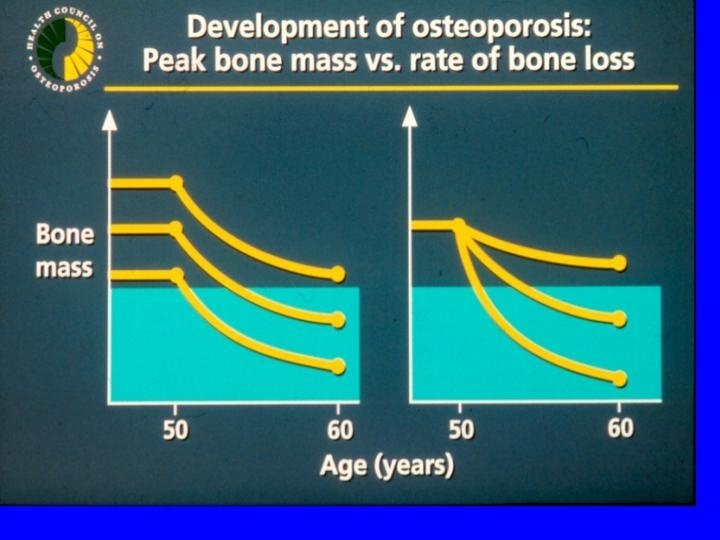
Pathogenesis of Osteoporotic Fracture LOW PEAK BONE MASS

 POSTMENOPAUSAL")
Pathogenesis of Osteoporotic Fracture LOW PEAK BONE MASS Nonskeletal factors (propensity to fall) POSTMENOPAUSAL BONE LOSS AGE-RELATED BONE LOSS LOW BONE MASS Other Risk Factors FRACTURE Poor bone quality (architecture) Adapted from Melton LI, Riggs BL, eds. Osteoporosis: Etiology, Diagnosis, and Management. Raven Press New York, pp 155 -179


Objective • To investigate the influence of dietary intake on bone mineral density in women aged 30 -39
 aged 30 -39 • Recruitment from: mailing,")
Design: cross sectional study • Volunteers (n=139) aged 30 -39 • Recruitment from: mailing, newspaper, health fairs, fliers, referrals • Exclusions: diseases or medications known to affect BMD; pregnancy; non-white race

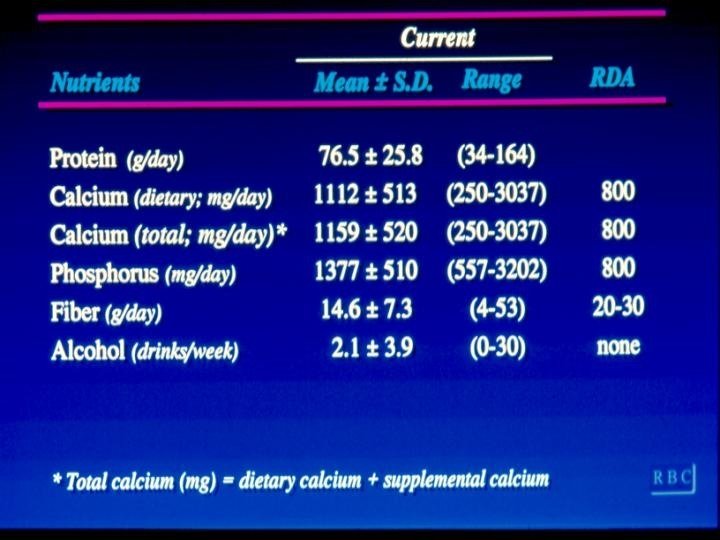
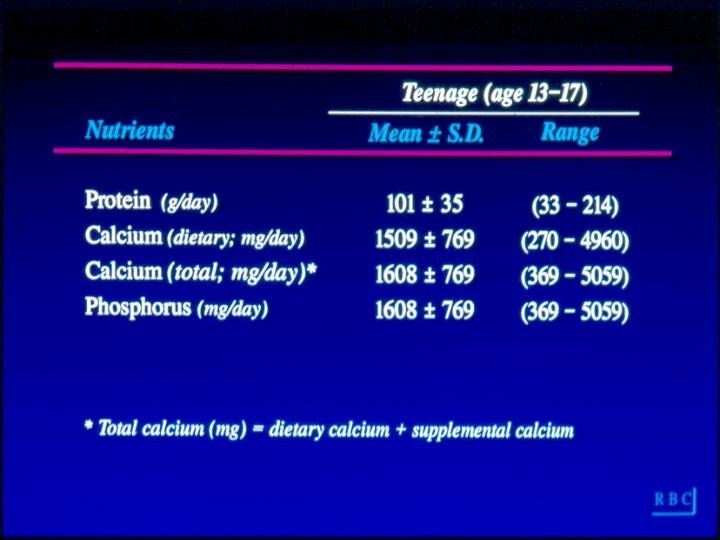
Nutrient Intake • Current- for year preceding BMD measurement • Teenage- for ages 13 -17 • Nutrients of interest were assessed by modified Block (NCI) FFQ (self administered): – – – – Calcium Phosphorus Protein Vitamin C Caffeine Alcohol Fiber

Food Frequency Questionairre • Self administered- 94 questions; 30 minutes • Original for NCI therefore questions concerned fat, vitamin A etc; (n=35) of these were deleted. • Other foods high in calcium were added (n=23) • Beverage list was expanded to determine caffeine in mg/day (n=15)

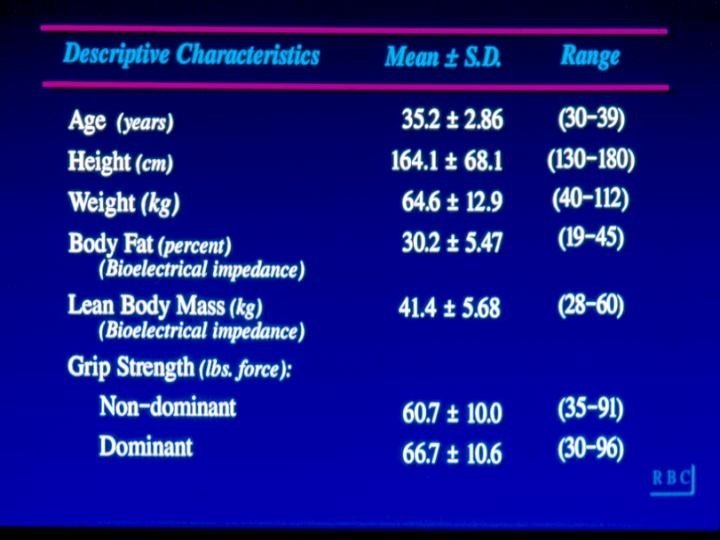
Covariates: • Physical measurements: – Height – Weight – Skinfold thickness – Waist circumference – Bioelectric impedence – Grip strength

Covariates: • Interview: – – – – Demographics Menstrual function Pregnancy and lactation Oral contraceptive use Disease and medication history Fracture history Smoking Physical activity
 – Lumbar Spine")
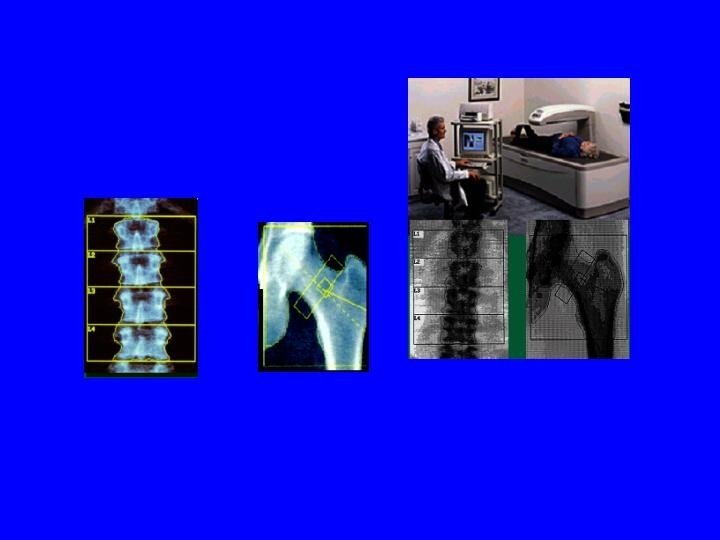
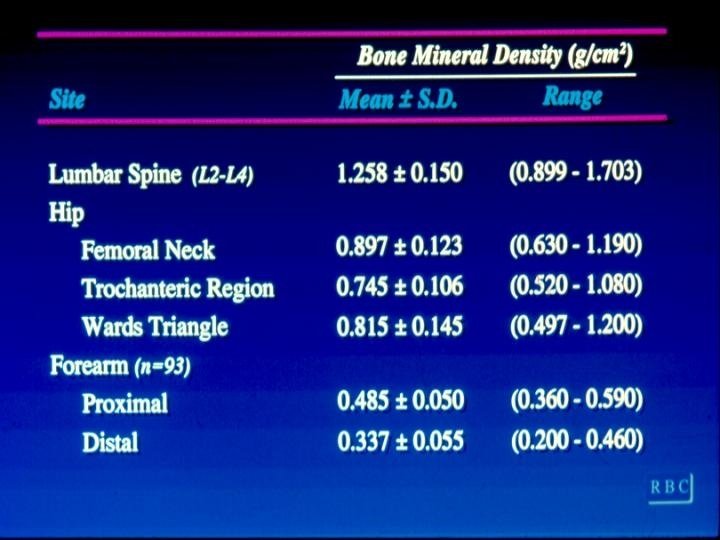
Outcome: • Bone mineral density by dual x-ray absorptiometry (gm/cm 2) – Lumbar Spine (L 2 -L 4) – Hip – femoral neck- trochanter- wards traingle – Forearm- proximal and distal

Multivariate regression analysis • BMD= nutrient+ age + height + weight+ grip strength
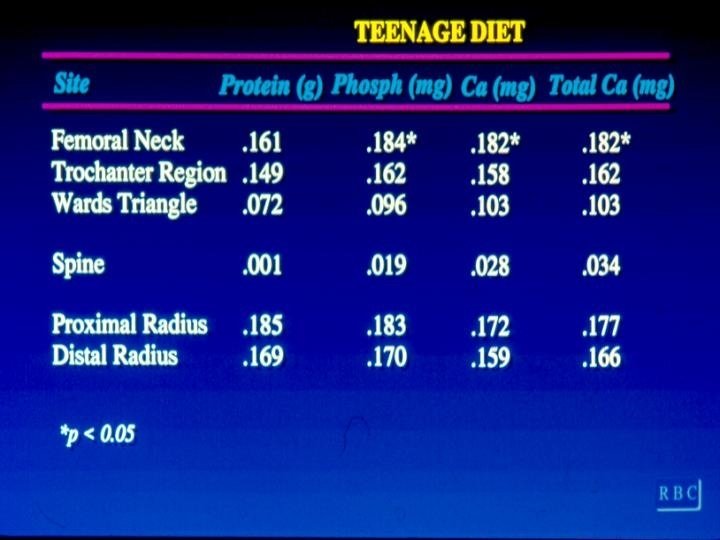

Results • Bone mineral density was not related to current intake of: – Caffeine – Vitamin D – Protein – Fiber – Phosphorus

Strengths and Limitations • Dietary interview detailed and planned for 2 time periods • BMD is a reliable measure • Able to control for many confounders • Power 77% to detect r=0. 20 • Measurement error • Multicollinearity • Generalizability • Multiple comparisons

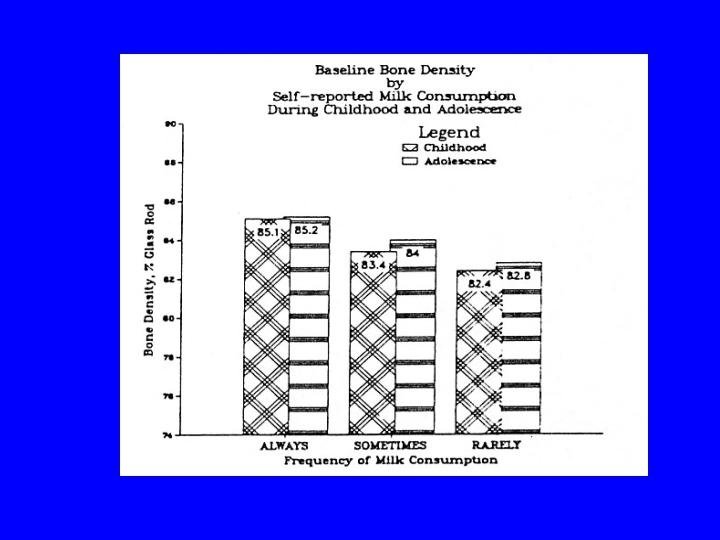
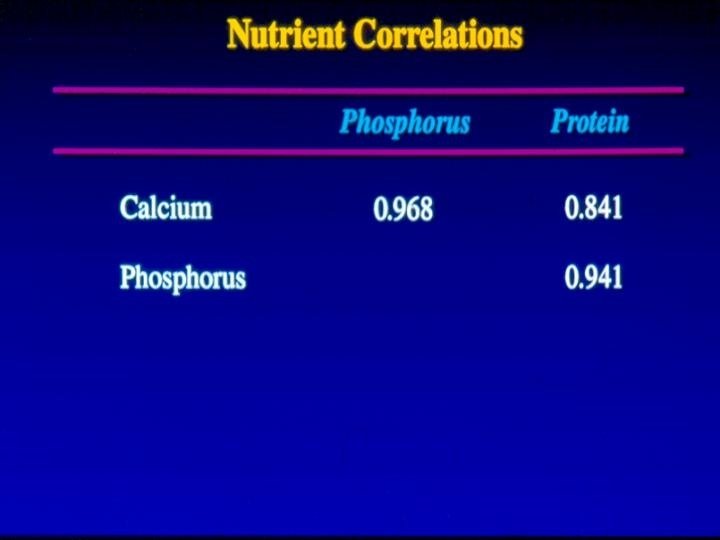
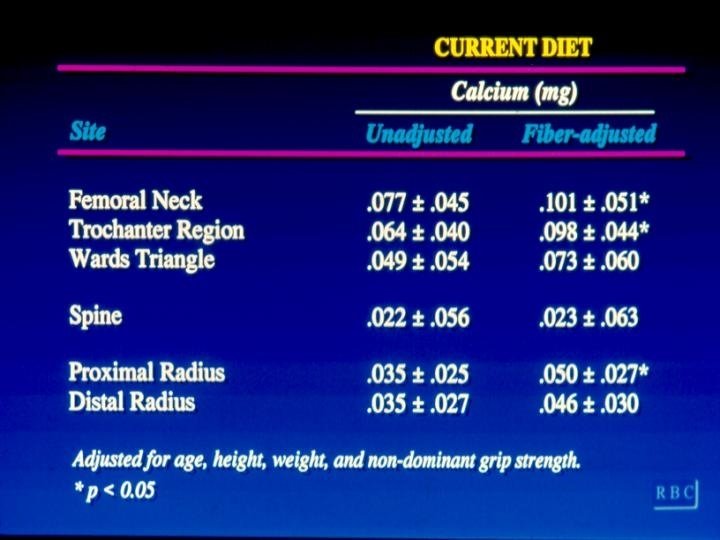
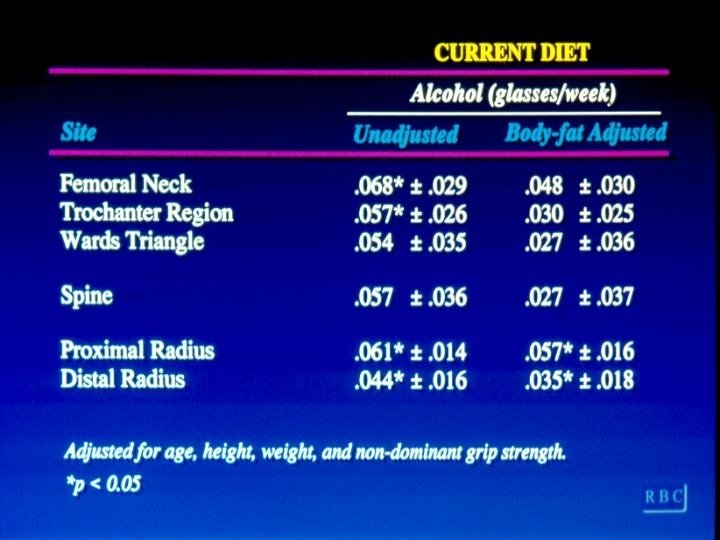
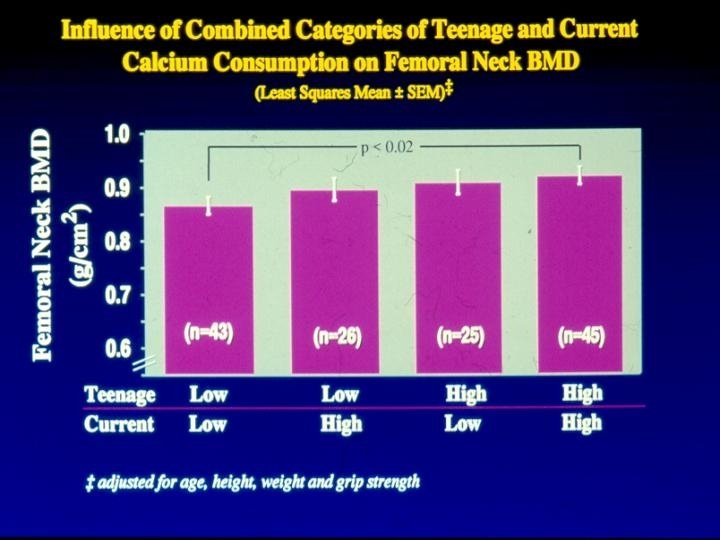
Conclusion • A change in calcium intake from 800 to 1200 mg per day will increase hip BMD by approximately 6% – Fiber – Supplemental calcium – Phosphorus (r=0. 95 with calcium) – Protein (r=0. 84 with calcium) – Alcohol

Calcium and BMD • Strength: moderate r~0. 2 – Probably stronger due to RME of dietary calcium – Teenage intake • Specificity – problem in diet due to high nutrient correlations – stronger effect with supplements added – stronger effect after correct for fiber

Calcium and BMD • Temporality – Problem with design – BMD now diet in past year or teenage • Biological Plausability – 30% of bone is calcium – Bone calcium maintains serum calcium – Greater amount of calcium in cortical bone where stronger effect is observed • Consistency
- Slides: 31