
PATCHOGUE MEDFORD SCHOOL DISTRICT WHERE EDUCATION COMES FIRST

- Slides: 16
PATCHOGUE MEDFORD SCHOOL DISTRICT WHERE EDUCATION COMES FIRST! Statistical Analysis May 4, 2014 Michael Giacchetto
Introduction The study will analyze the effects of expenditures on selected students and the correlation it has on state test achievement. The study will look at the subgroups separately and as a whole to look for signs for cost effectiveness of the money spent throughout the past 6 years. Budgets and taxes for schools are of a great concern and this study will look to see if the money spent is closing the achievement gap.
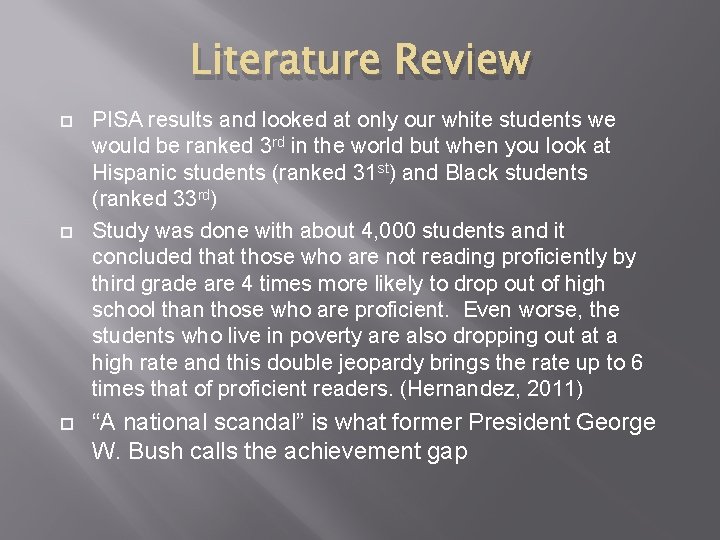
Literature Review PISA results and looked at only our white students we would be ranked 3 rd in the world but when you look at Hispanic students (ranked 31 st) and Black students (ranked 33 rd) Study was done with about 4, 000 students and it concluded that those who are not reading proficiently by third grade are 4 times more likely to drop out of high school than those who are proficient. Even worse, the students who live in poverty are also dropping out at a high rate and this double jeopardy brings the rate up to 6 times that of proficient readers. (Hernandez, 2011) “A national scandal” is what former President George W. Bush calls the achievement gap
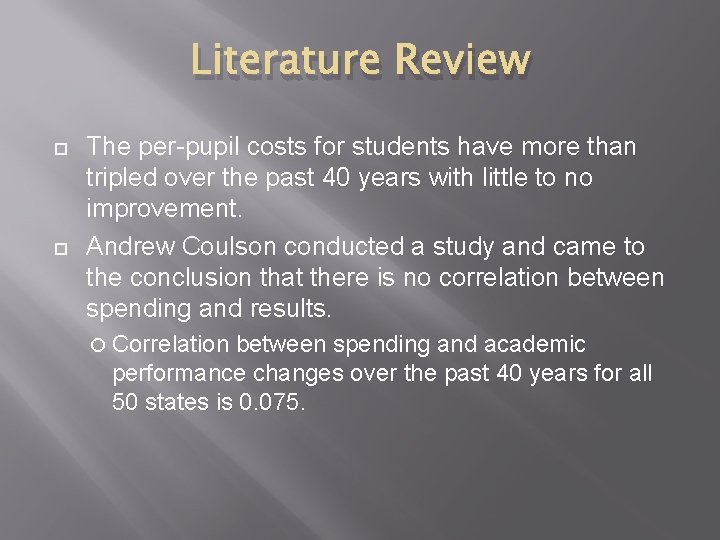
Literature Review The per-pupil costs for students have more than tripled over the past 40 years with little to no improvement. Andrew Coulson conducted a study and came to the conclusion that there is no correlation between spending and results. Correlation between spending and academic performance changes over the past 40 years for all 50 states is 0. 075.
What am I looking to do? Utilize descriptive, regression, and other analytical tools to find out if: 1. 2. 3. per-pupil expenditures have an impact on achievement? the effects that certain subgroups have on the passing rates of the district are positive or negative? The district closing the achievement gap or lengthening it?
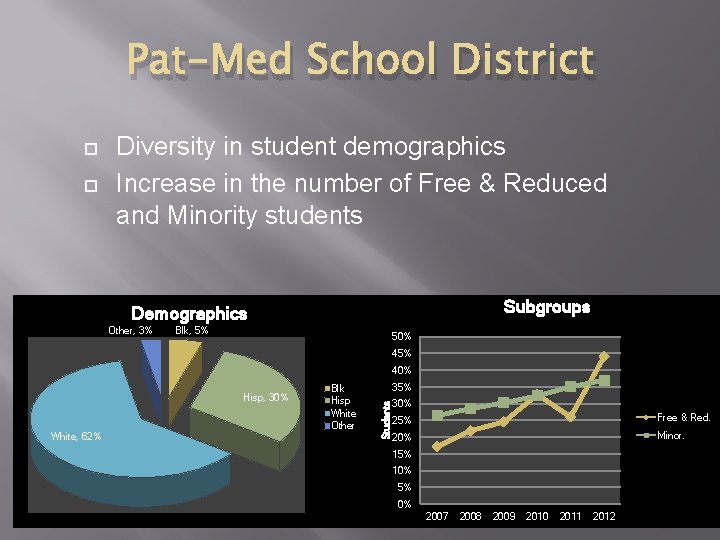
Pat-Med School District Diversity in student demographics Increase in the number of Free & Reduced and Minority students Subgroups Demographics Other, 3% Blk, 5% 50% 45% 40% White, 62% Blk Hisp White Other 35% Students Hisp, 30% 25% Free & Red. 20% Minor. 15% 10% 5% 0% 2007 2008 2009 2010 2011 2012
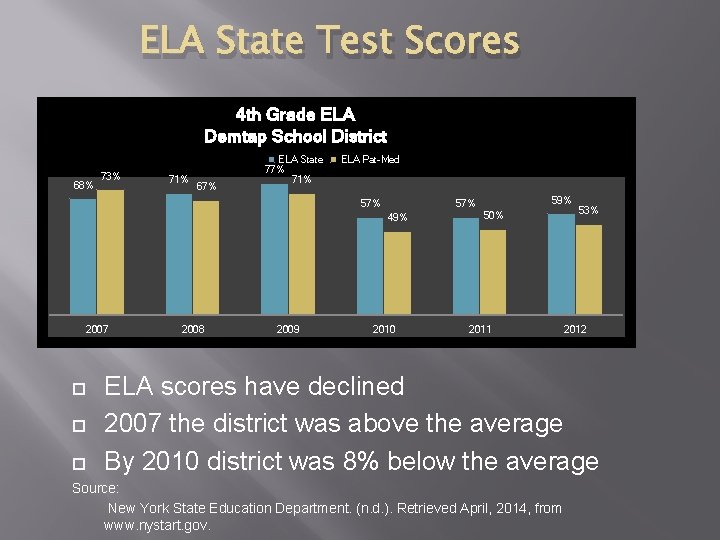
ELA State Test Scores 4 th Grade ELA Demtap School District 68% 73% 71% 67% ELA State 77% 71% ELA Pat-Med 57% 49% 2007 2008 2009 59% 57% 2010 50% 2011 53% 2012 ELA scores have declined 2007 the district was above the average By 2010 district was 8% below the average Source: New York State Education Department. (n. d. ). Retrieved April, 2014, from www. nystart. gov.
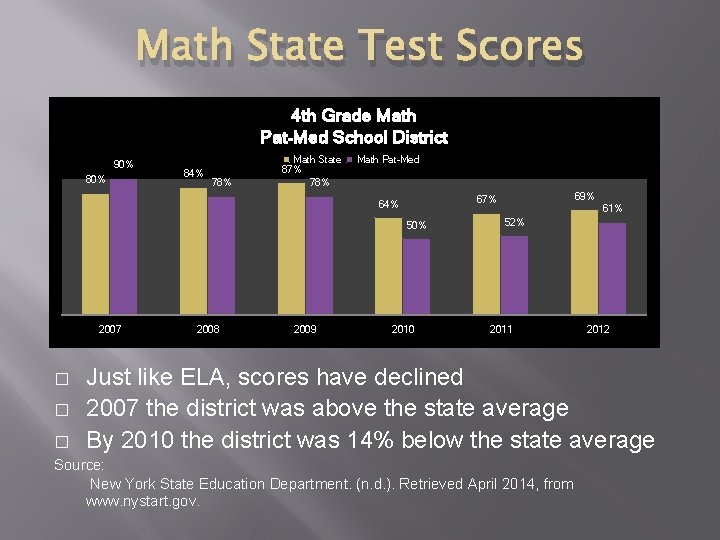
Math State Test Scores 4 th Grade Math Pat-Med School District 90% 84% 78% Math State 87% 78% Math Pat-Med 50% 2007 � � � 2008 2009 69% 67% 64% 2010 61% 52% 2011 2012 Just like ELA, scores have declined 2007 the district was above the state average By 2010 the district was 14% below the state average Source: New York State Education Department. (n. d. ). Retrieved April 2014, from www. nystart. gov.
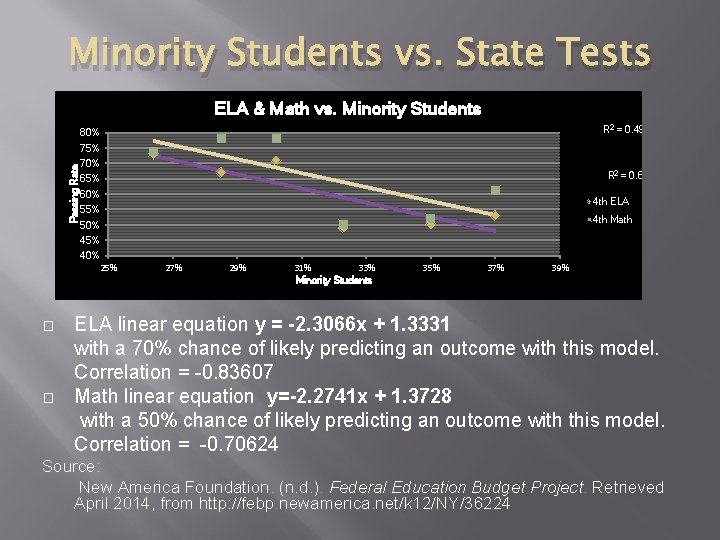
Minority Students vs. State Tests ELA & Math vs. Minority Students R 2 = 0. 4988 80% Passing Rate 75% 70% R 2 = 0. 699 65% 60% 4 th ELA 55% 4 th Math 50% 45% 40% 25% � � 27% 29% 31% 33% Minority Students 35% 37% 39% ELA linear equation y = -2. 3066 x + 1. 3331 with a 70% chance of likely predicting an outcome with this model. Correlation = -0. 83607 Math linear equation y=-2. 2741 x + 1. 3728 with a 50% chance of likely predicting an outcome with this model. Correlation = -0. 70624 Source: New America Foundation. (n. d. ). Federal Education Budget Project. Retrieved April 2014, from http: //febp. newamerica. net/k 12/NY/36224
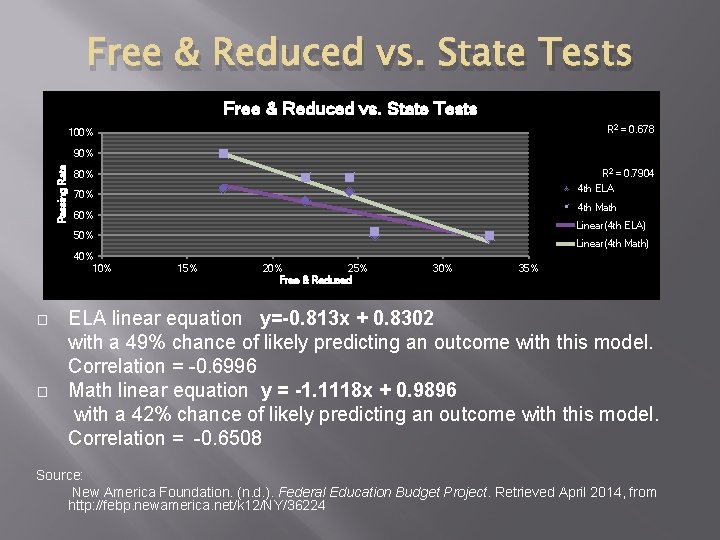
Free & Reduced vs. State Tests R 2 = 0. 678 100% Passing Rate 90% R 2 = 0. 7904 80% 4 th ELA 70% 4 th Math 60% Linear(4 th ELA) 50% 40% 10% � � Linear(4 th Math) 15% 20% 25% Free & Reduced 30% 35% ELA linear equation y=-0. 813 x + 0. 8302 with a 49% chance of likely predicting an outcome with this model. Correlation = -0. 6996 Math linear equation y = -1. 1118 x + 0. 9896 with a 42% chance of likely predicting an outcome with this model. Correlation = -0. 6508 Source: New America Foundation. (n. d. ). Federal Education Budget Project. Retrieved April 2014, from http: //febp. newamerica. net/k 12/NY/36224
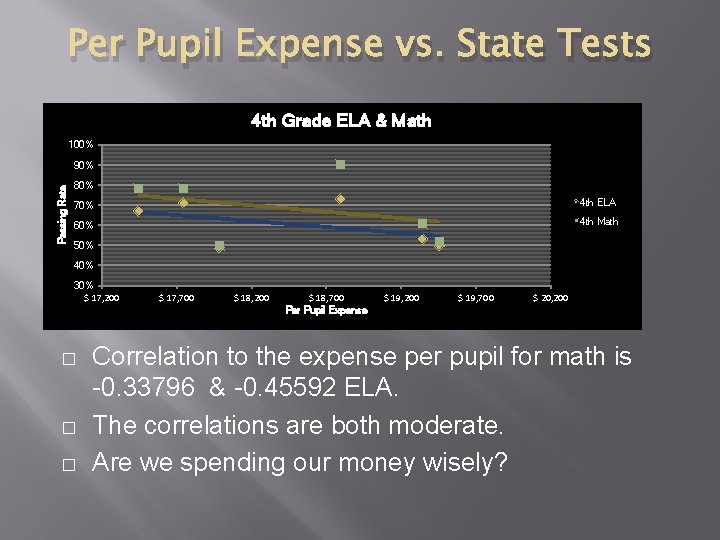
Per Pupil Expense vs. State Tests 4 th Grade ELA & Math 100% Passing Rate 90% 80% 70% 4 th ELA 60% 4 th Math 50% 40% 30% $ 17, 200 � � � $ 17, 700 $ 18, 200 $ 18, 700 Per Pupil Expense $ 19, 200 $ 19, 700 $ 20, 200 Correlation to the expense per pupil for math is -0. 33796 & -0. 45592 ELA. The correlations are both moderate. Are we spending our money wisely?
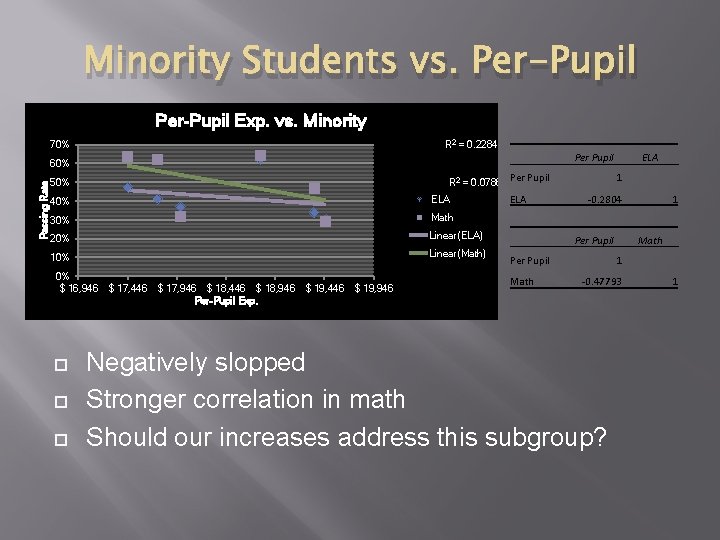
Minority Students vs. Per-Pupil Exp. vs. Minority R 2 = 0. 2284 70% Passing Rate 60% R 2 = 0. 0786 Per Pupil 50% 40% ELA 30% Math 20% Linear(ELA) 10% Linear(Math) 0% $ 16, 946 Per Pupil $ 17, 446 $ 17, 946 $ 18, 446 $ 18, 946 Per-Pupil Exp. $ 19, 446 $ 19, 946 ELA 1 -0. 2804 Per Pupil Math ELA 1 Math 1 -0. 47793 Negatively slopped Stronger correlation in math Should our increases address this subgroup? 1
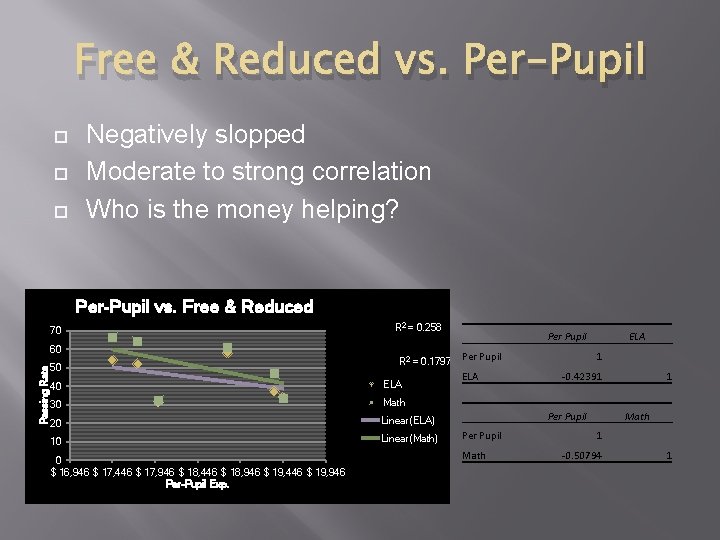
Free & Reduced vs. Per-Pupil Negatively slopped Moderate to strong correlation Who is the money helping? Per-Pupil vs. Free & Reduced 70 R 2 = 0. 258 Passing Rate 60 50 R 2 = 0. 1797 40 ELA 30 Math 20 Linear(ELA) 10 Linear(Math) 0 $ 16, 946 $ 17, 446 $ 17, 946 $ 18, 446 $ 18, 946 $ 19, 446 $ 19, 946 Per-Pupil Exp. Per Pupil ELA 1 -0. 42391 Per Pupil Math ELA Per Pupil 1 Math 1 -0. 50794 1
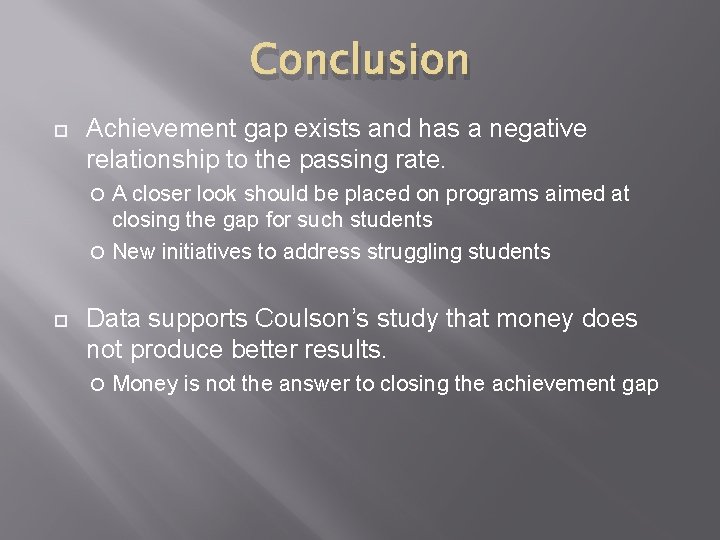
Conclusion Achievement gap exists and has a negative relationship to the passing rate. A closer look should be placed on programs aimed at closing the gap for such students New initiatives to address struggling students Data supports Coulson’s study that money does not produce better results. Money is not the answer to closing the achievement gap
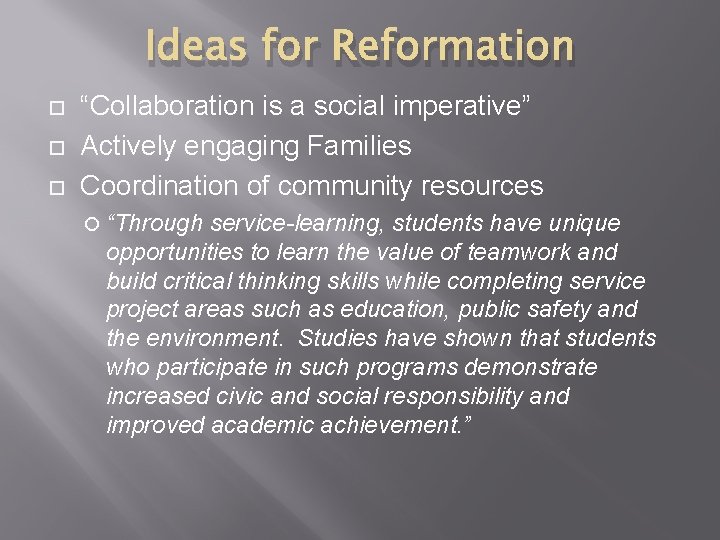
Ideas for Reformation “Collaboration is a social imperative” Actively engaging Families Coordination of community resources “Through service-learning, students have unique opportunities to learn the value of teamwork and build critical thinking skills while completing service project areas such as education, public safety and the environment. Studies have shown that students who participate in such programs demonstrate increased civic and social responsibility and improved academic achievement. ”
Conclusion Much education today is monumentally ineffective. All too often we are giving young people cut flowers when we should be teaching them to grow their own plants. John W. Gardner