Passive Monitoring with Nagios Jim Prins jprins 1229gmail



- Slides: 30

Passive Monitoring with Nagios Jim Prins jprins 1229@gmail. com

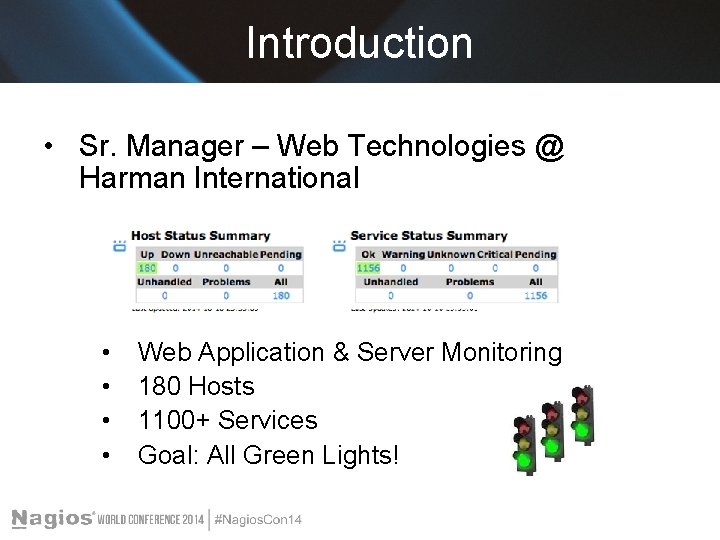
Introduction • Sr. Manager – Web Technologies @ Harman International • • Web Application & Server Monitoring 180 Hosts 1100+ Services Goal: All Green Lights!

Agenda – pt 1 • Active vs Passive Checks • Enabling Passive Checking in Nagios • • Enabling on Nagios Core & Nagios XI Configuring NRDP Server & Client • Customizing Passive Checks • • • Volatility State Stalking Freshness Checking

Agenda – pt 2 • Example #1 – Airline Call Button • Example #2 – Backup Monitoring • Other Passive Examples • Summary • Questions/Answers

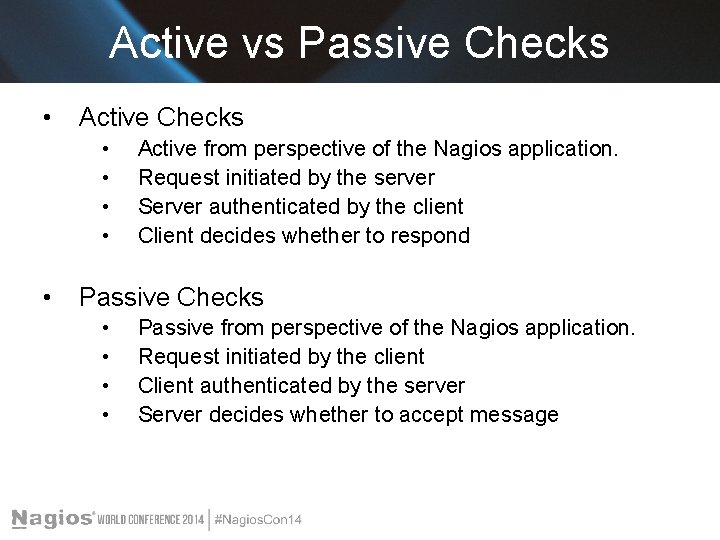
Active vs Passive Checks • Active Checks • • • Active from perspective of the Nagios application. Request initiated by the server Server authenticated by the client Client decides whether to respond Passive Checks • • Passive from perspective of the Nagios application. Request initiated by the client Client authenticated by the server Server decides whether to accept message

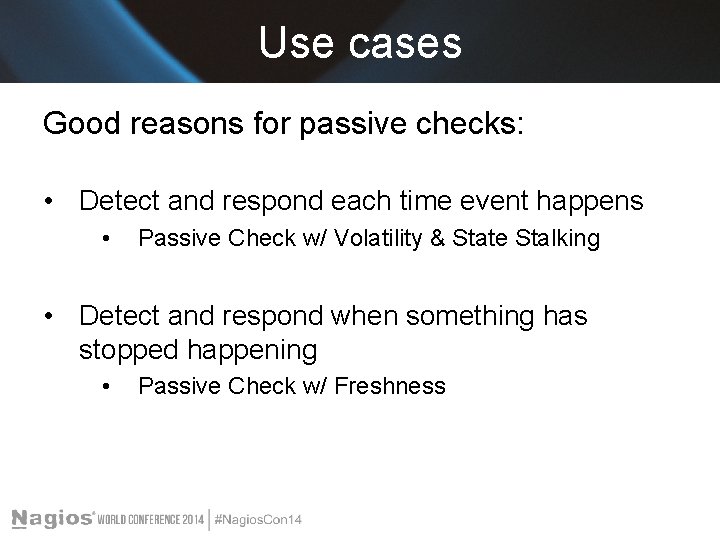
Use cases Good reasons for passive checks: • Detect and respond each time event happens • Passive Check w/ Volatility & State Stalking • Detect and respond when something has stopped happening • Passive Check w/ Freshness

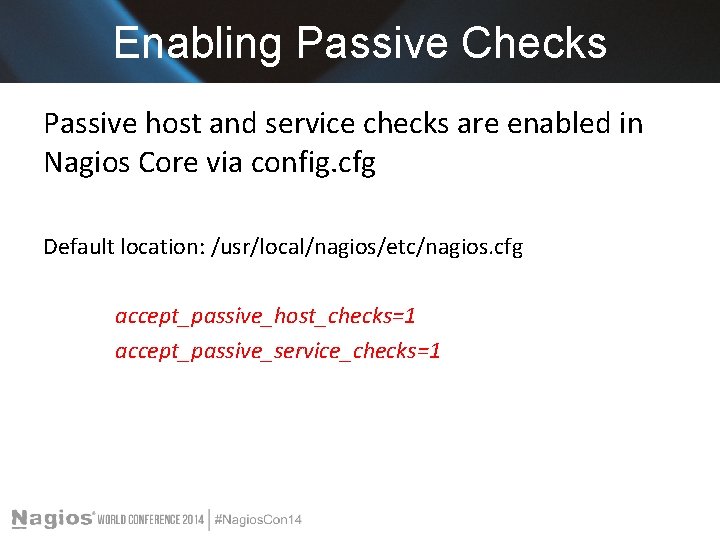
Enabling Passive Checks Passive host and service checks are enabled in Nagios Core via config. cfg Default location: /usr/local/nagios/etc/nagios. cfg accept_passive_host_checks=1 accept_passive_service_checks=1

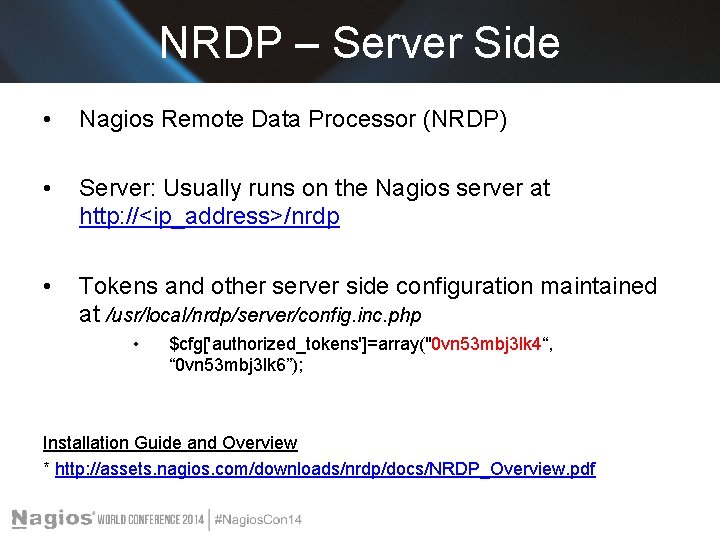
NRDP – Server Side • Nagios Remote Data Processor (NRDP) • Server: Usually runs on the Nagios server at http: //<ip_address>/nrdp • Tokens and other server side configuration maintained at /usr/local/nrdp/server/config. inc. php • $cfg['authorized_tokens']=array("0 vn 53 mbj 3 lk 4“, “ 0 vn 53 mbj 3 lk 6”); Installation Guide and Overview * http: //assets. nagios. com/downloads/nrdp/docs/NRDP_Overview. pdf

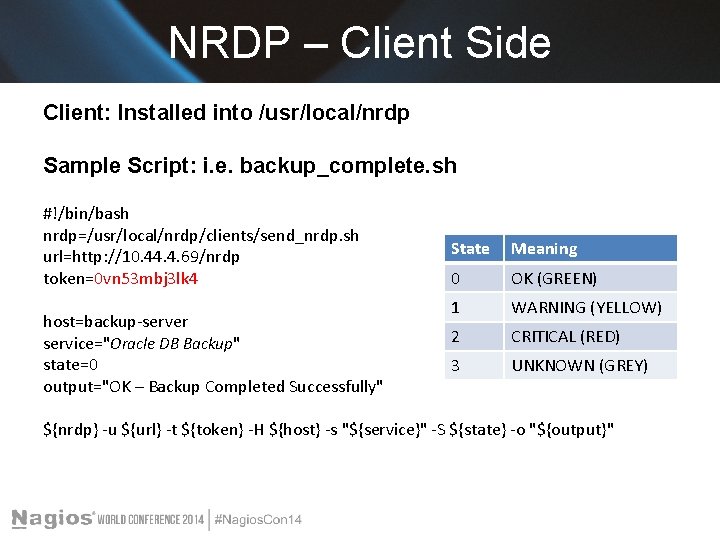
NRDP – Client Side Client: Installed into /usr/local/nrdp Sample Script: i. e. backup_complete. sh #!/bin/bash nrdp=/usr/local/nrdp/clients/send_nrdp. sh url=http: //10. 44. 4. 69/nrdp token=0 vn 53 mbj 3 lk 4 host=backup-server service="Oracle DB Backup" state=0 output="OK – Backup Completed Successfully" State Meaning 0 OK (GREEN) 1 WARNING (YELLOW) 2 CRITICAL (RED) 3 UNKNOWN (GREY) ${nrdp} -u ${url} -t ${token} -H ${host} -s "${service}" -S ${state} -o "${output}"

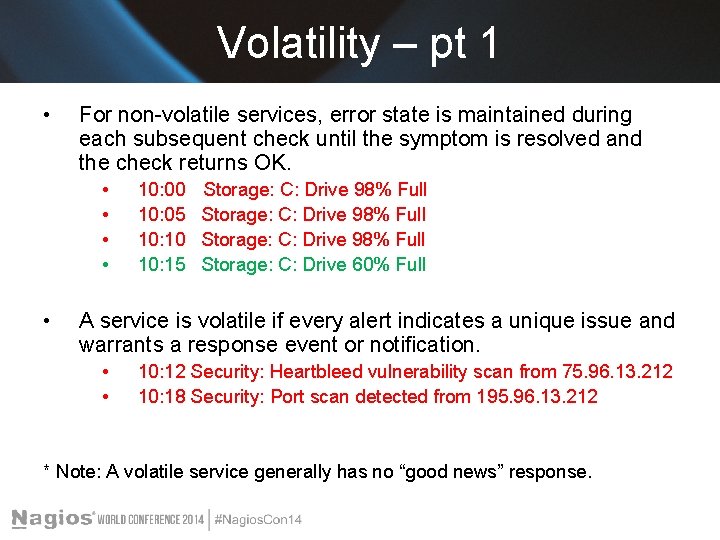
Volatility – pt 1 • For non-volatile services, error state is maintained during each subsequent check until the symptom is resolved and the check returns OK. • • • 10: 00 10: 05 10: 10 10: 15 Storage: C: Drive 98% Full Storage: C: Drive 60% Full A service is volatile if every alert indicates a unique issue and warrants a response event or notification. • • 10: 12 Security: Heartbleed vulnerability scan from 75. 96. 13. 212 10: 18 Security: Port scan detected from 195. 96. 13. 212 * Note: A volatile service generally has no “good news” response.

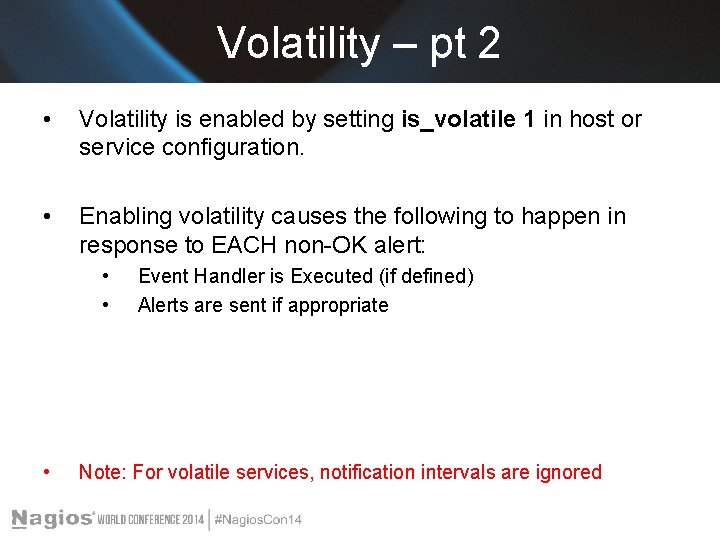
Volatility – pt 2 • Volatility is enabled by setting is_volatile 1 in host or service configuration. • Enabling volatility causes the following to happen in response to EACH non-OK alert: • • • Event Handler is Executed (if defined) Alerts are sent if appropriate Note: For volatile services, notification intervals are ignored

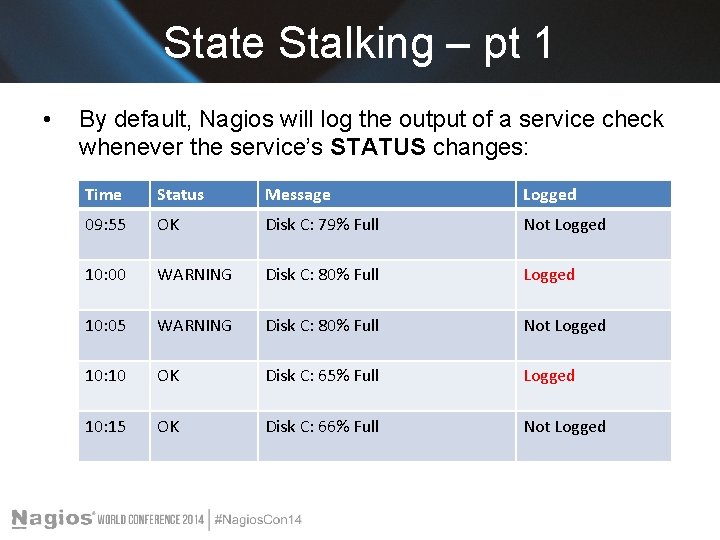
State Stalking – pt 1 • By default, Nagios will log the output of a service check whenever the service’s STATUS changes: Time Status Message Logged 09: 55 OK Disk C: 79% Full Not Logged 10: 00 WARNING Disk C: 80% Full Logged 10: 05 WARNING Disk C: 80% Full Not Logged 10: 10 OK Disk C: 65% Full Logged 10: 15 OK Disk C: 66% Full Not Logged

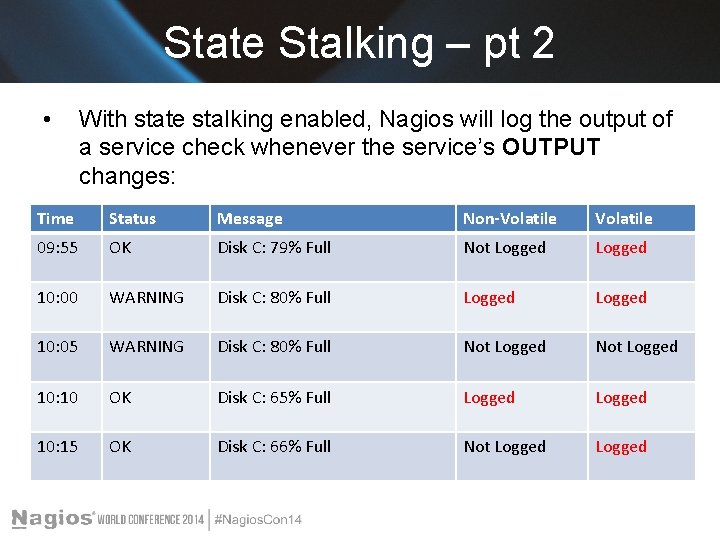
State Stalking – pt 2 • With state stalking enabled, Nagios will log the output of a service check whenever the service’s OUTPUT changes: Time Status Message Non-Volatile 09: 55 OK Disk C: 79% Full Not Logged 10: 00 WARNING Disk C: 80% Full Logged 10: 05 WARNING Disk C: 80% Full Not Logged 10: 10 OK Disk C: 65% Full Logged 10: 15 OK Disk C: 66% Full Not Logged

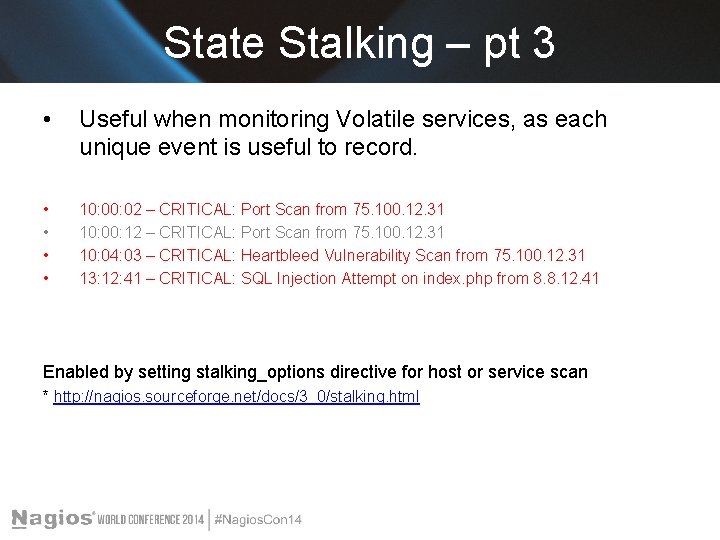
State Stalking – pt 3 • Useful when monitoring Volatile services, as each unique event is useful to record. • • 10: 02 – CRITICAL: Port Scan from 75. 100. 12. 31 10: 00: 12 – CRITICAL: Port Scan from 75. 100. 12. 31 10: 04: 03 – CRITICAL: Heartbleed Vulnerability Scan from 75. 100. 12. 31 13: 12: 41 – CRITICAL: SQL Injection Attempt on index. php from 8. 8. 12. 41 Enabled by setting stalking_options directive for host or service scan * http: //nagios. sourceforge. net/docs/3_0/stalking. html

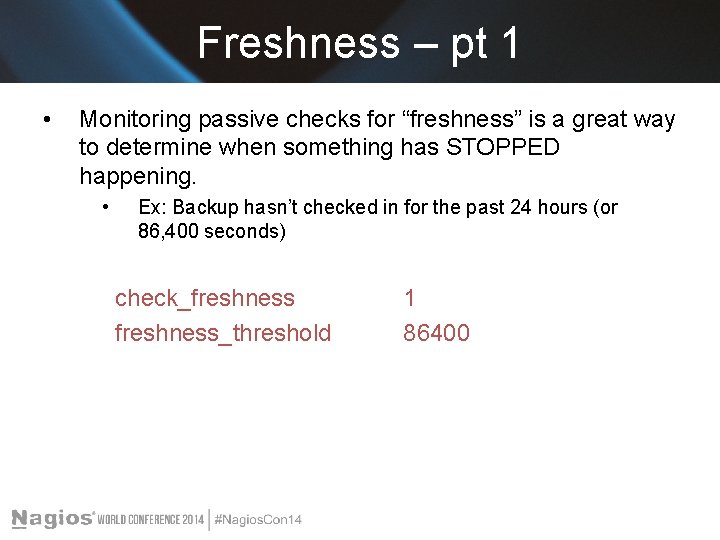
Freshness – pt 1 • Monitoring passive checks for “freshness” is a great way to determine when something has STOPPED happening. • Ex: Backup hasn’t checked in for the past 24 hours (or 86, 400 seconds) check_freshness_threshold 1 86400

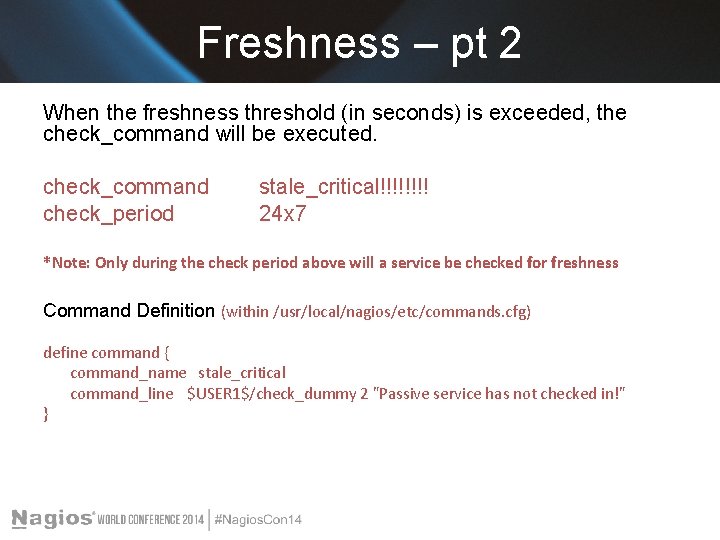
Freshness – pt 2 When the freshness threshold (in seconds) is exceeded, the check_command will be executed. check_command check_period stale_critical!!!! 24 x 7 *Note: Only during the check period above will a service be checked for freshness Command Definition (within /usr/local/nagios/etc/commands. cfg) define command { command_name stale_critical command_line $USER 1$/check_dummy 2 "Passive service has not checked in!" }

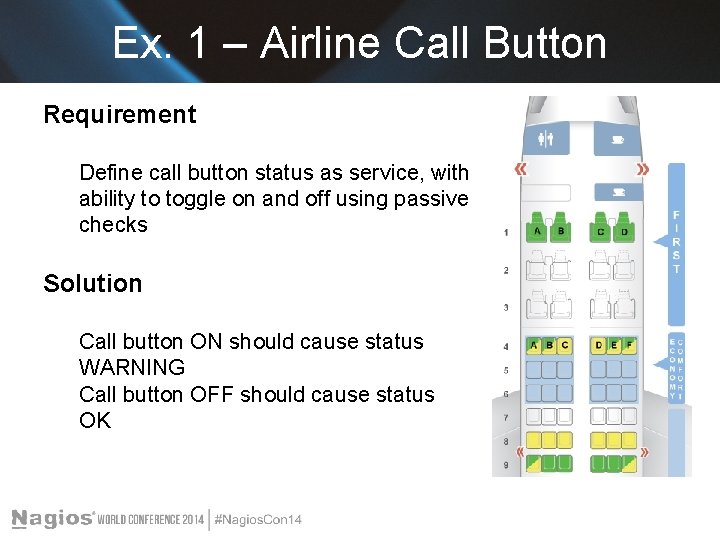
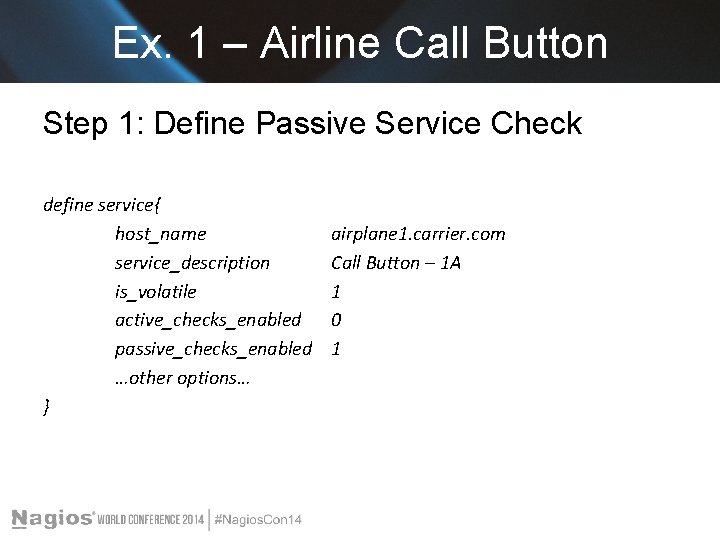
Ex. 1 – Airline Call Button Requirement Define call button status as service, with ability to toggle on and off using passive checks Solution Call button ON should cause status WARNING Call button OFF should cause status OK

Ex. 1 – Airline Call Button Step 1: Define Passive Service Check define service{ host_name service_description is_volatile active_checks_enabled passive_checks_enabled …other options… } airplane 1. carrier. com Call Button – 1 A 1 0 1

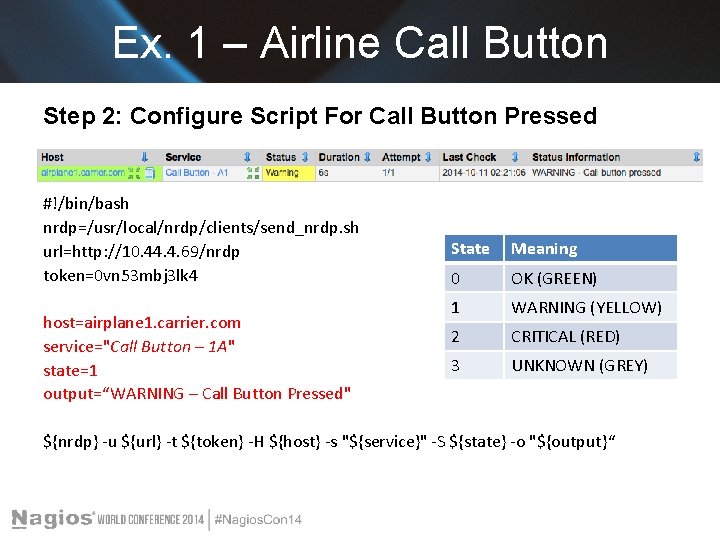
Ex. 1 – Airline Call Button Step 2: Configure Script For Call Button Pressed #!/bin/bash nrdp=/usr/local/nrdp/clients/send_nrdp. sh url=http: //10. 44. 4. 69/nrdp token=0 vn 53 mbj 3 lk 4 host=airplane 1. carrier. com service="Call Button – 1 A" state=1 output=“WARNING – Call Button Pressed" State Meaning 0 OK (GREEN) 1 WARNING (YELLOW) 2 CRITICAL (RED) 3 UNKNOWN (GREY) ${nrdp} -u ${url} -t ${token} -H ${host} -s "${service}" -S ${state} -o "${output}“

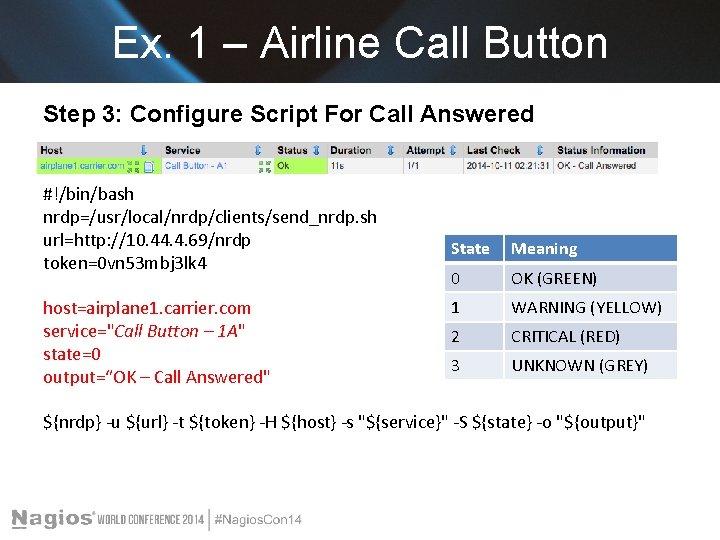
Ex. 1 – Airline Call Button Step 3: Configure Script For Call Answered #!/bin/bash nrdp=/usr/local/nrdp/clients/send_nrdp. sh url=http: //10. 44. 4. 69/nrdp token=0 vn 53 mbj 3 lk 4 host=airplane 1. carrier. com service="Call Button – 1 A" state=0 output=“OK – Call Answered" State Meaning 0 OK (GREEN) 1 WARNING (YELLOW) 2 CRITICAL (RED) 3 UNKNOWN (GREY) ${nrdp} -u ${url} -t ${token} -H ${host} -s "${service}" -S ${state} -o "${output}"

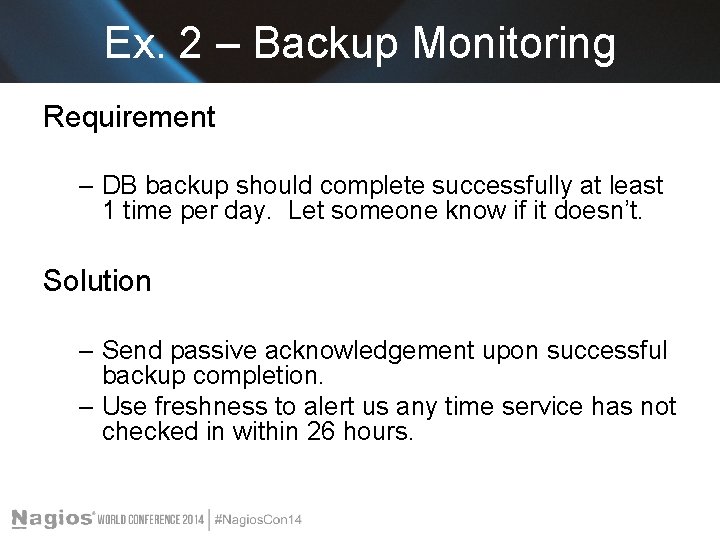
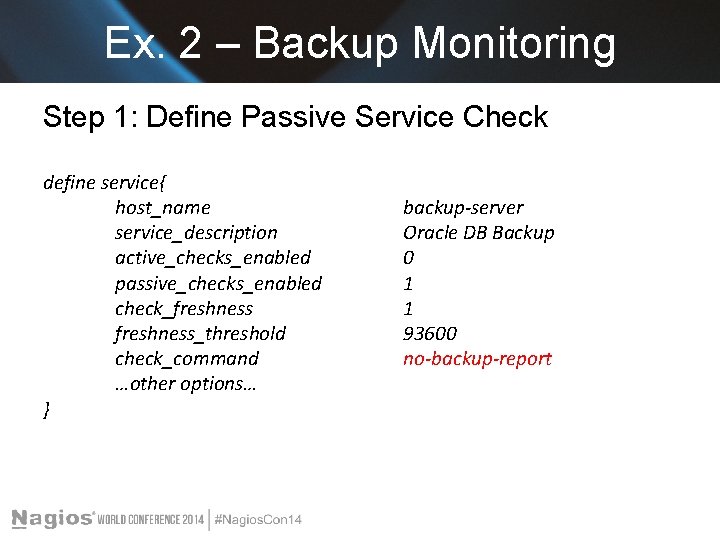
Ex. 2 – Backup Monitoring Requirement – DB backup should complete successfully at least 1 time per day. Let someone know if it doesn’t. Solution – Send passive acknowledgement upon successful backup completion. – Use freshness to alert us any time service has not checked in within 26 hours.

Ex. 2 – Backup Monitoring Step 1: Define Passive Service Check define service{ host_name service_description active_checks_enabled passive_checks_enabled check_freshness_threshold check_command …other options… } backup-server Oracle DB Backup 0 1 1 93600 no-backup-report

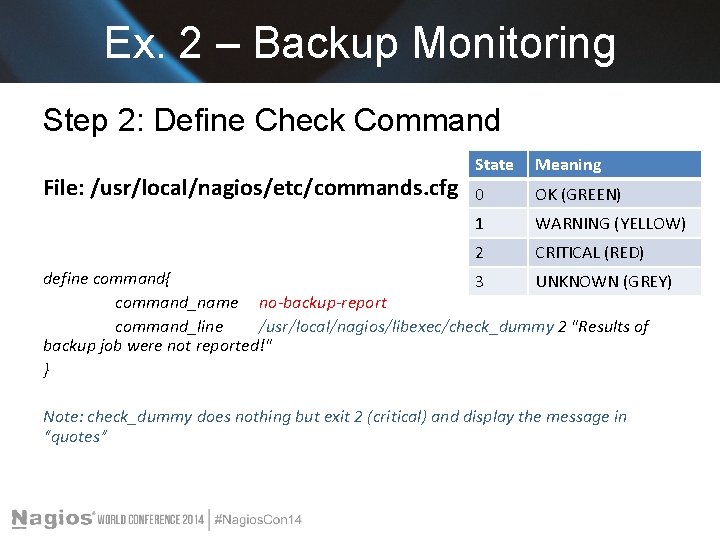
Ex. 2 – Backup Monitoring Step 2: Define Check Command File: /usr/local/nagios/etc/commands. cfg State Meaning 0 OK (GREEN) 1 WARNING (YELLOW) 2 CRITICAL (RED) define command{ 3 UNKNOWN (GREY) command_name no-backup-report command_line /usr/local/nagios/libexec/check_dummy 2 "Results of backup job were not reported!" } Note: check_dummy does nothing but exit 2 (critical) and display the message in “quotes”

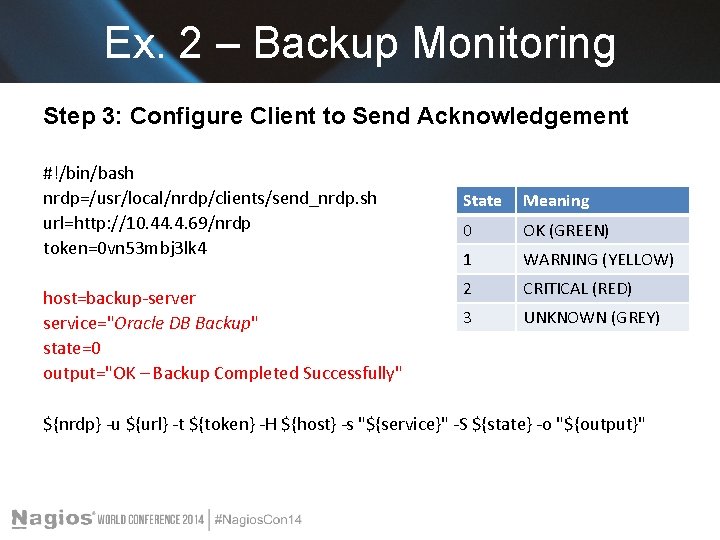
Ex. 2 – Backup Monitoring Step 3: Configure Client to Send Acknowledgement #!/bin/bash nrdp=/usr/local/nrdp/clients/send_nrdp. sh url=http: //10. 44. 4. 69/nrdp token=0 vn 53 mbj 3 lk 4 host=backup-server service="Oracle DB Backup" state=0 output="OK – Backup Completed Successfully" State Meaning 0 OK (GREEN) 1 WARNING (YELLOW) 2 CRITICAL (RED) 3 UNKNOWN (GREY) ${nrdp} -u ${url} -t ${token} -H ${host} -s "${service}" -S ${state} -o "${output}"

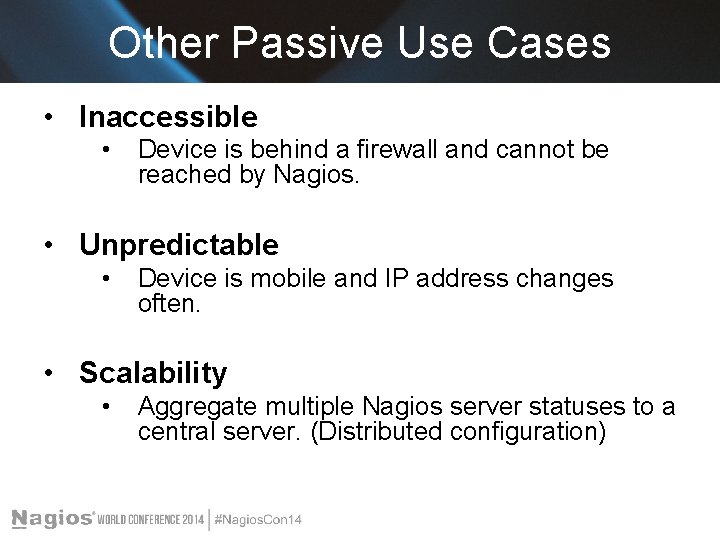
Other Passive Use Cases • Inaccessible • Device is behind a firewall and cannot be reached by Nagios. • Unpredictable • Device is mobile and IP address changes often. • Scalability • Aggregate multiple Nagios server statuses to a central server. (Distributed configuration)

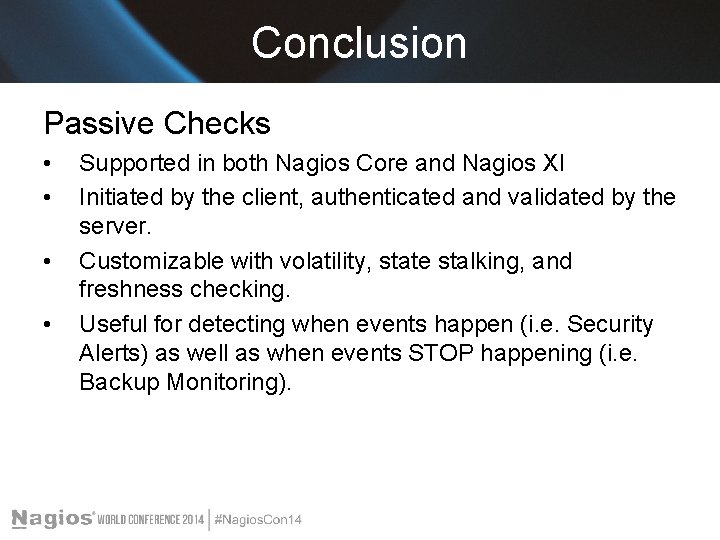
Conclusion Passive Checks • • Supported in both Nagios Core and Nagios XI Initiated by the client, authenticated and validated by the server. Customizable with volatility, state stalking, and freshness checking. Useful for detecting when events happen (i. e. Security Alerts) as well as when events STOP happening (i. e. Backup Monitoring).

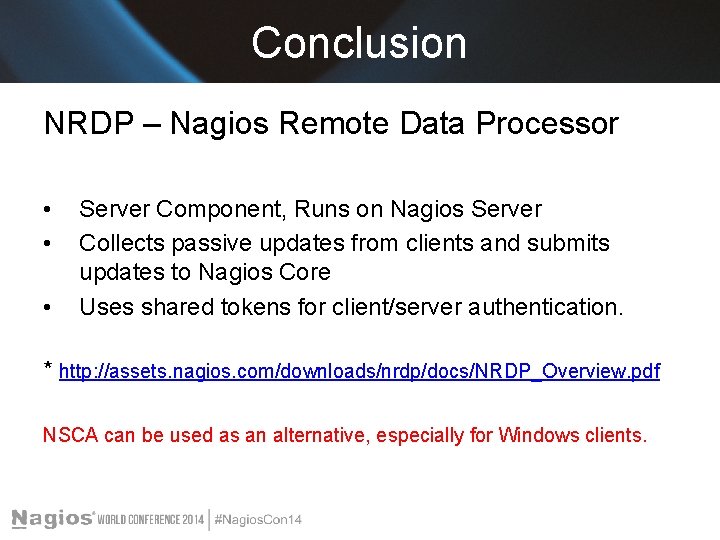
Conclusion NRDP – Nagios Remote Data Processor • • • Server Component, Runs on Nagios Server Collects passive updates from clients and submits updates to Nagios Core Uses shared tokens for client/server authentication. * http: //assets. nagios. com/downloads/nrdp/docs/NRDP_Overview. pdf NSCA can be used as an alternative, especially for Windows clients.

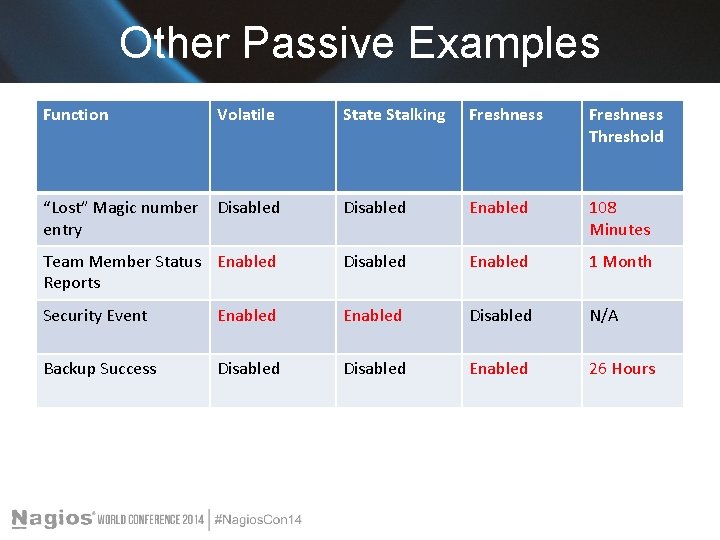
Other Passive Examples Function Volatile State Stalking Freshness Threshold “Lost” Magic number entry Disabled Enabled 108 Minutes Team Member Status Enabled Reports Disabled Enabled 1 Month Security Event Enabled Disabled N/A Backup Success Disabled Enabled 26 Hours

Questions? Any questions? Thanks!

The End Jim Prins jprins 1229@gmail. com