PartII Wire type detectors 1 Single wire counters

Prporttional mode of the operation")

 Radiation Gas amplification Absorber/ covertor")

 introduction to the interaction of particles and photons with matter 6")


 and")


2")
dr}")


2={F+ (δA/A)2}W}/Ev={F+ (δA/A)2}/n 0 where F is a so-called Fano factor- a")
2 depend on the gas type, its pressure and on the")


- Slides: 38
Part-II Wire type detectors 1. Single wire counters
1. Single wire counters a)Prporttional mode of the operation
Geiger counter Proportional counter Output signal Is proportional to deposit energy n 0=Ed/Wi
Drift region Anode External amplification (amplifier) Radiation Gas amplification Absorber/ covertor
There are three main processes: 1. Interaction of charged particle or photons with a gas 2. Drift of primary ions 3. Gas multiplication
Small (and simplified) introduction to the interaction of particles and photons with matter 6
Particle tracks is gases In most practical cases charged particles produce well defined tracks inside the gaseous detectors 7
Production of primary and delta electrons 8
How do tracks look in reality? 9
Visualization of particle tracks gives an important information about the nature of the particles and its energy/momentum 10
Interaction of high energy photons and particles with matter-showers 11
Interaction of photons with gases 12
Schematic drawing illustrating the appearance of a fluorescent photoelectron following the transition of an electron from the outer shell to the vacancy in the inner shell
Transitions K 1 L 1 Argon ke. V mm 2. 96 31. 8 3. 19 39. 2 Krypton ke. V mm 12. 6 96 14. 1 130 1. 59 2. 7 1. 64 2. 8 Xenon ke. V mm 29. 8 192 33. 6 267 4. 1 4. 5 4. 4 5. 4 The fluorescent photon mean free path Λph at normal conditions originated from various electron transitions in noble gases
Schematic description of the process leading to the ejection of a photoelectron (b) and an Auger electron from an atomic outer shell (d).
Drift of ions The drift properties of electrons and ions are quite different
Drift of electrons
Drift of ions Vi=μE. Gas Ions Ar Iso. C 4 H 10 (OCH 3)2 CH 2 Ar Iso. C 4 H 10 Ar CH 4 Ar CO 2 (OCH 3)2 CH 2+ Iso. C 4 H 10+ CH 4+ CO 2+ Mobility (cm 2 V-1 sec-1) 1. 51 0. 55 0. 26 1. 56 0. 61 1. 87 2. 26 1. 72 1. 09
Multiplication M=exp{ra∫rcα(E, p)dr}
Gas gain A Typical dependence of gas gain vs. applied voltage
Pulse shape
Energy resolution (δM/M)2={F+ (δA/A)2}W}/Ev={F+ (δA/A)2}/n 0 where F is a so-called Fano factor- a constant characteristic to gases (typically it is below 0. 2) [11] and (δA/A)2 is gain fluctuation (also typically below 0. 75 [12]). Thus typically (δM/M)2 ≤w/Ev=1/n 0. Because ΔM =2. 35δ, the ratio FWHM to the mean value of the signal amplitude ΔM/M of the output signal in the case of the 5. 9 ke. V x-rays will be ΔM/M~ 15% and indeed this was well confirmed by many measurements (5. 9 ke. V photons from a 55 Fe radioactive source are usually used to evaluate the energy resolution of the proportional counter)
Because F and (δA/A)2 depend on the gas type, its pressure and on the gas gain A, one can optimize the single-wire counter geometry and its gas composition. Calculations preformed by Alhazov indicate that: 1. the smaller is the gas amplification, the smaller its fluctuations; 2. the product of the detector’s anode wire on the gas pressure should be as low as possible: 3. one can find gas mixtures having 10— 20 % smaller (δA/A)2 as well as having a small constant F. Indeed, it was demonstrated experimentally that in Penning gas mixtures (F~0. 05— 0. 075) and at gas gains~100, energy resolution of 10. 7 -11. 6%FWHM for 6 ke. V photons can be achieved with a low noise preamplifier. At small gas gain however, electronic noise can contribute to the (δM/M) 2, so that (δM/M)2={F+ (δA/A)2}W}/Ev+δn 2 where δn 2 is electronic noise fluctuations.
Position-sensitive single wire counters
Secondary processes
What happens when the operating voltage is gradually increased
γph p. e from the cathode -a probability of appearing secondary electron due to photo processes Nphc ~∫ Fav(ν)exp {-σ (ν)Nmol}dν Nec ~ ∫ Fav(ν)exp {-σ (ν)Nmol}Qc(ν) dν p. e. from the gas Nphg ~ ∫ Fav(ν)[1 -exp {-σ (ν)Nmoldg}]dν Neg ~ ∫ Fav(v)[1 -exp {-σ (v)Nmol dg}] Qg(ν) dν
Most of contribution comes from the avalanche UV photons Surface photoeffect Photoionization Photabsorption
Back diffusion
γ+ -probability of secondary electro appearance due to the ion recombination a. The electron energy level in a metal, when a positive ion Q+ is far away from it. In this drawing ε is the depth of the conduction band b. The energy diagram, when an ion is very close to the cathode surface, . In this case the electron, denoted as “ 1”, tunnels directly to the ground state of the ion and the energy excess is given to the electron inside the metal , denoted as “ 2” γ+= kgas (E/p) (Ei-2φ)
Pulses due to the secondary processes
What limit the gain? Aγph=1 or , Aγ+=1 , What come first
Corona and unstable corona discharges
Tomorrow MWPC and PPAC detectors
MWPC
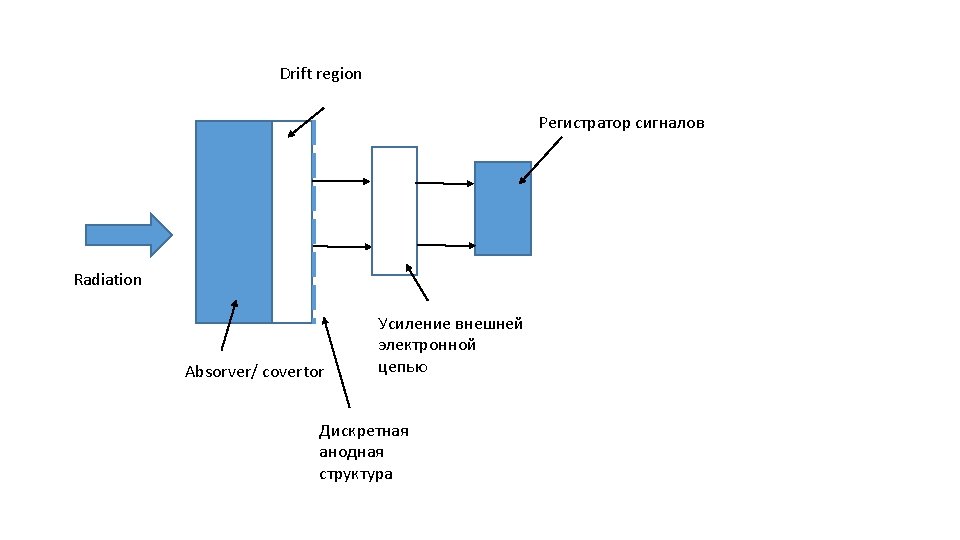
Drift region Segmented Anode External amplification Radiation Gas Amplification Absorver/ covertor