
Particulate matter PM is the same thing as

- Slides: 37
• “Particulate matter” (PM) is the same thing as “particles” or “aerosols” • “PMx” refers to the mass concentration of particles smaller than x μm diameter US population exposed to air pollutants in excess of national ambient air quality standards (NAAQS), 2015 108 M 70 ppb (8 -h average) Ozone 31 M 12 µg m-3 (annual), 35 µg m-3 (24 -h) PM 2. 5 11 M PM 10 5 M SO 2 Lead Million environmental deaths per year worldwide 1 M CO 0 NO 2 0 2010 data US EPA [2017], OECD [2012]
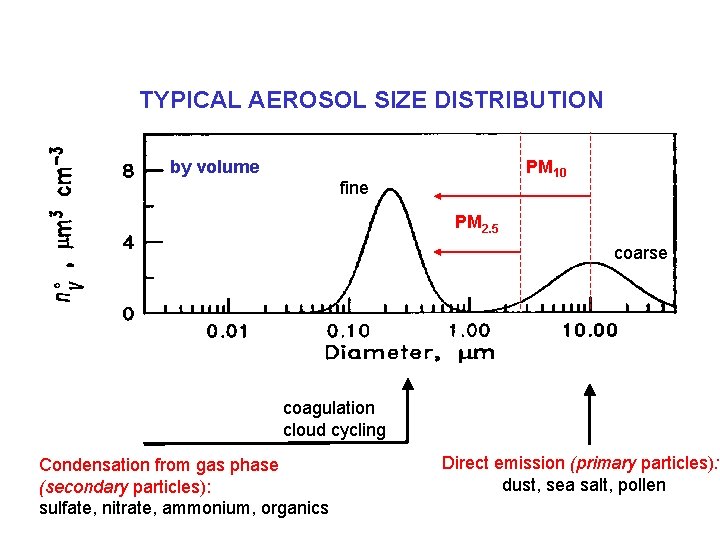
TYPICAL AEROSOL SIZE DISTRIBUTION PM 10 by volume fine PM 2. 5 coarse coagulation cloud cycling Condensation from gas phase (secondary particles): sulfate, nitrate, ammonium, organics Direct emission (primary particles): dust, sea salt, pollen
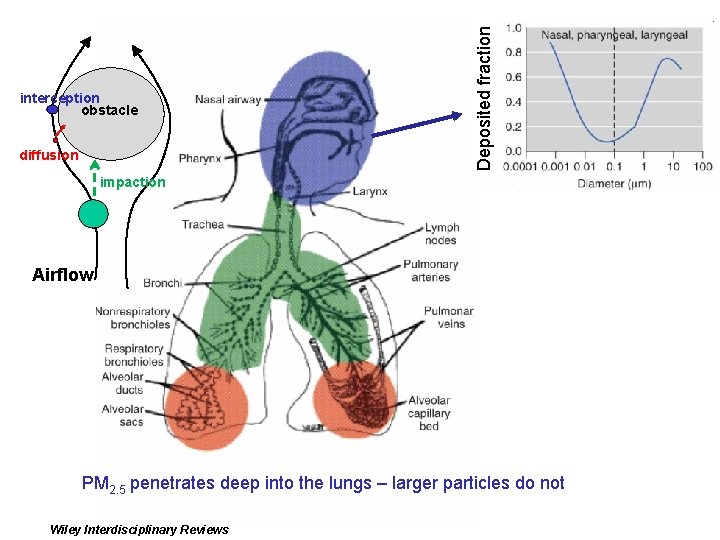
diffusion Deposited fraction interception obstacle impaction Airflow PM 2. 5 penetrates deep into the lungs – larger particles do not Wiley Interdisciplinary Reviews
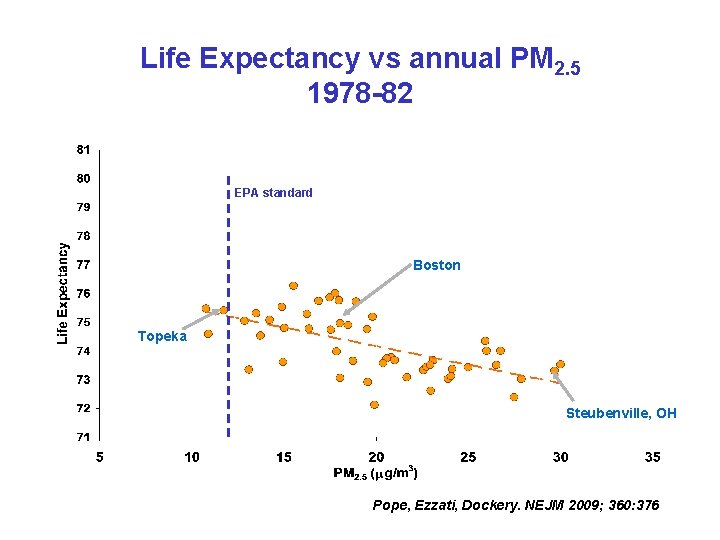
Life Expectancy vs annual PM 2. 5 1978 -82 EPA standard Boston Topeka Steubenville, OH Pope, Ezzati, Dockery. NEJM 2009; 360: 376
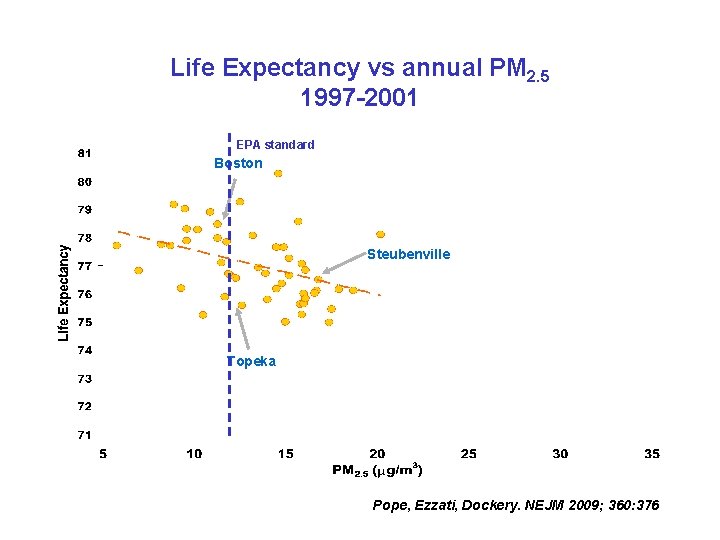
Life Expectancy vs annual PM 2. 5 1997 -2001 EPA standard Boston Steubenville Topeka Pope, Ezzati, Dockery. NEJM 2009; 360: 376
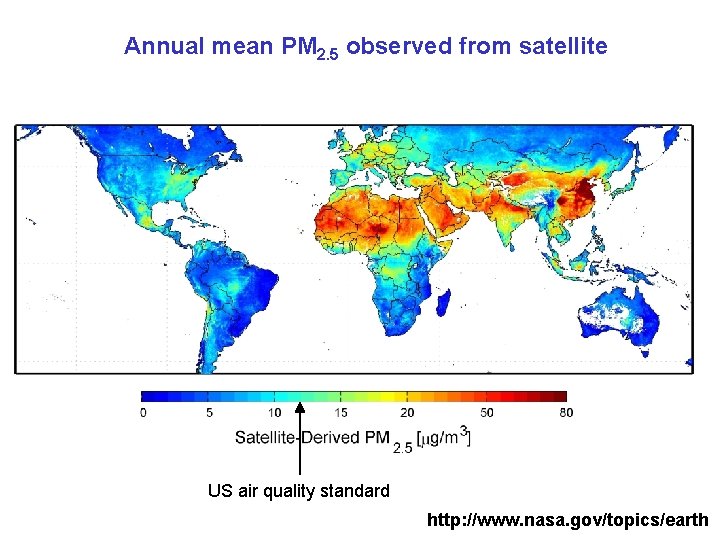
Annual mean PM 2. 5 observed from satellite US air quality standard http: //www. nasa. gov/topics/earth
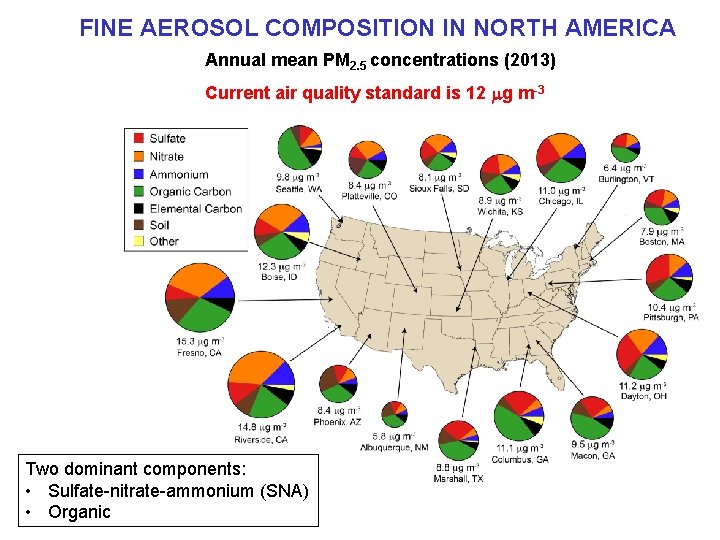
FINE AEROSOL COMPOSITION IN NORTH AMERICA Annual mean PM 2. 5 concentrations (2013) Current air quality standard is 12 mg m-3 Two dominant components: • Sulfate-nitrate-ammonium (SNA) • Organic
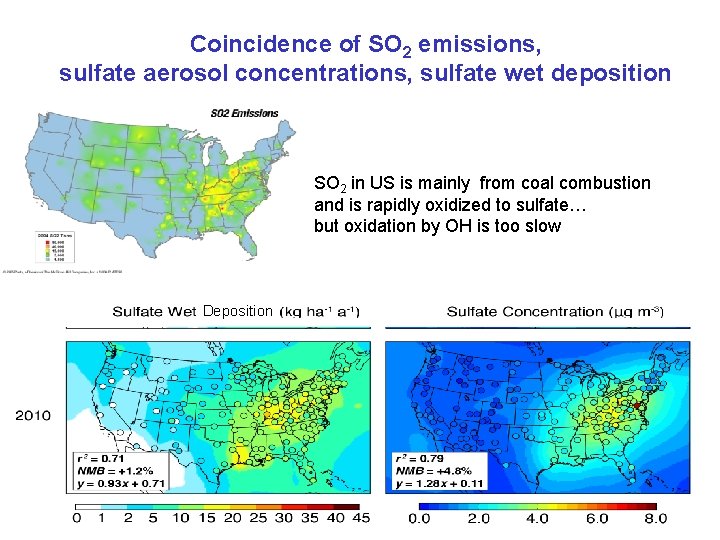
Coincidence of SO 2 emissions, sulfate aerosol concentrations, sulfate wet deposition SO 2 in US is mainly from coal combustion and is rapidly oxidized to sulfate… but oxidation by OH is too slow Deposition
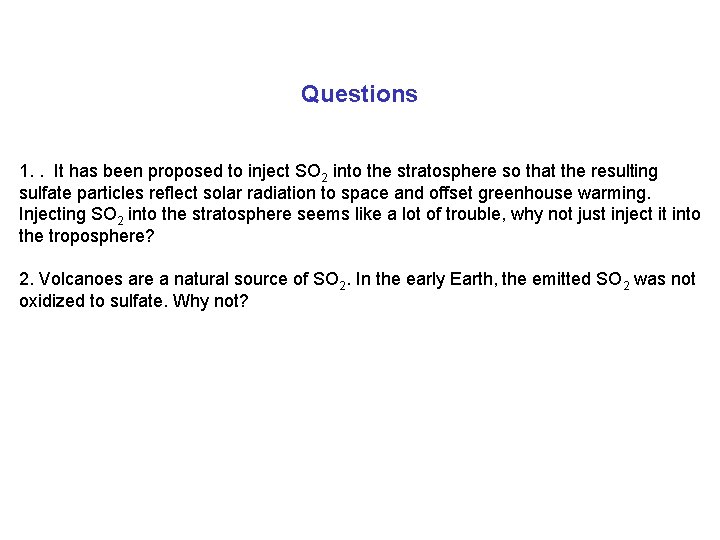
Questions 1. . It has been proposed to inject SO 2 into the stratosphere so that the resulting sulfate particles reflect solar radiation to space and offset greenhouse warming. Injecting SO 2 into the stratosphere seems like a lot of trouble, why not just inject it into the troposphere? 2. Volcanoes are a natural source of SO 2. In the early Earth, the emitted SO 2 was not oxidized to sulfate. Why not?
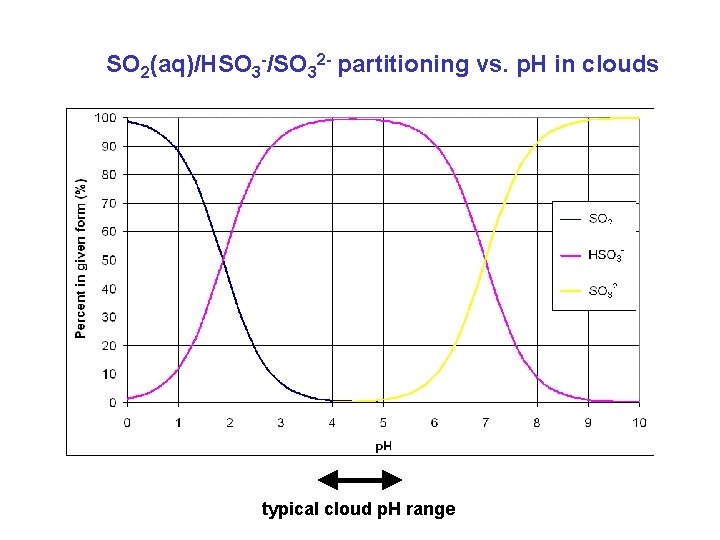
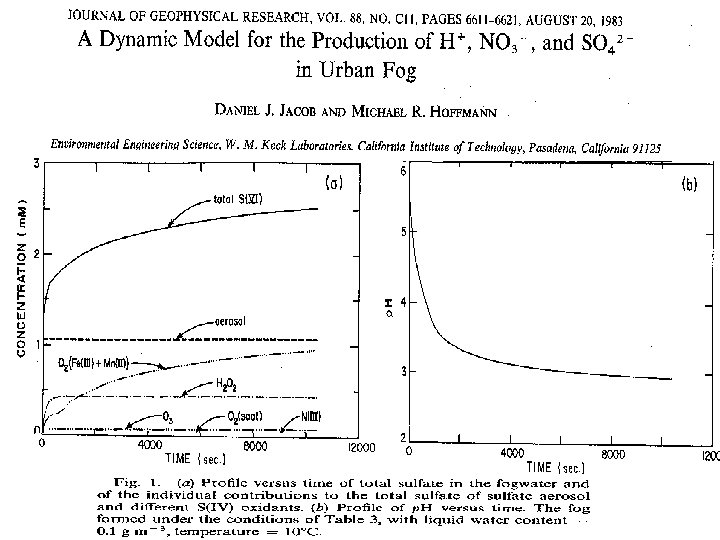
SO 2(aq)/HSO 3 -/SO 32 - partitioning vs. p. H in clouds typical cloud p. H range
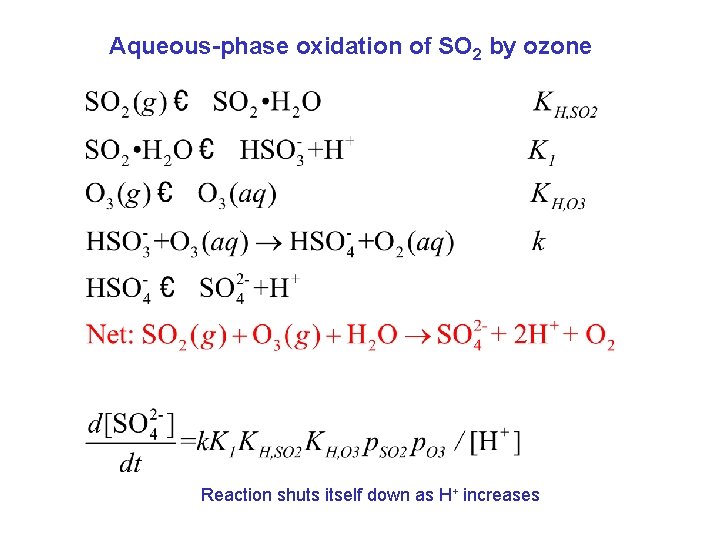
Aqueous-phase oxidation of SO 2 by ozone Reaction shuts itself down as H+ increases
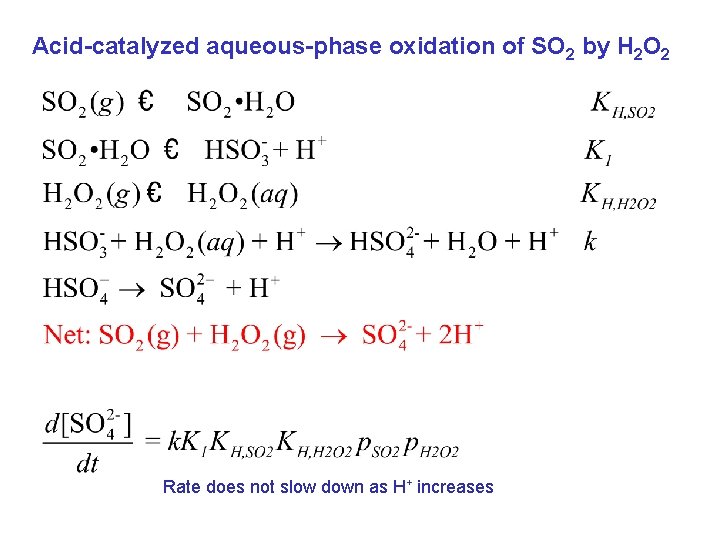
Acid-catalyzed aqueous-phase oxidation of SO 2 by H 2 O 2 Rate does not slow down as H+ increases
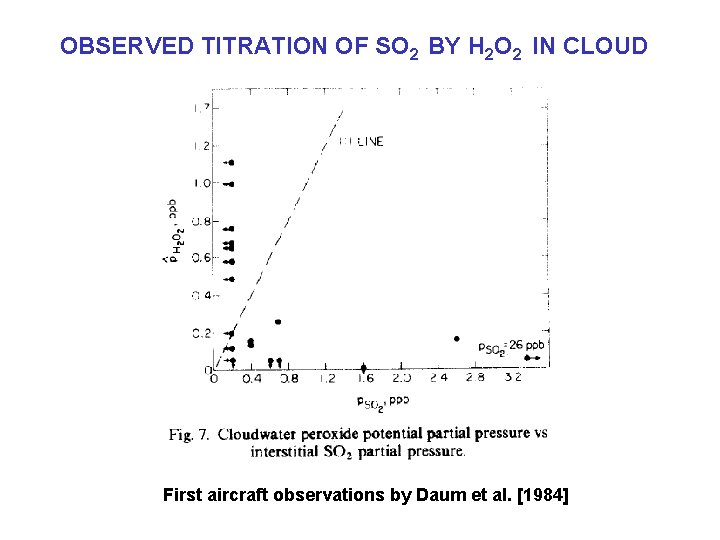
OBSERVED TITRATION OF SO 2 BY H 2 O 2 IN CLOUD First aircraft observations by Daum et al. [1984]
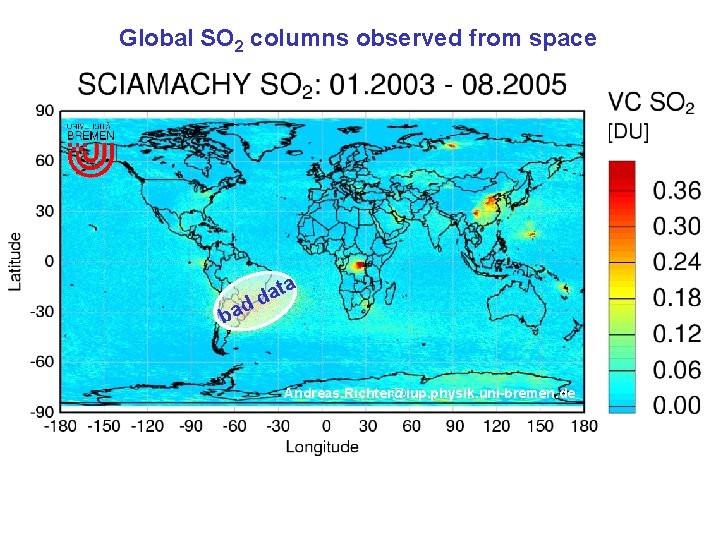
Global SO 2 columns observed from space ata d d ba Andreas. Richter@iup. physik. uni-bremen. de
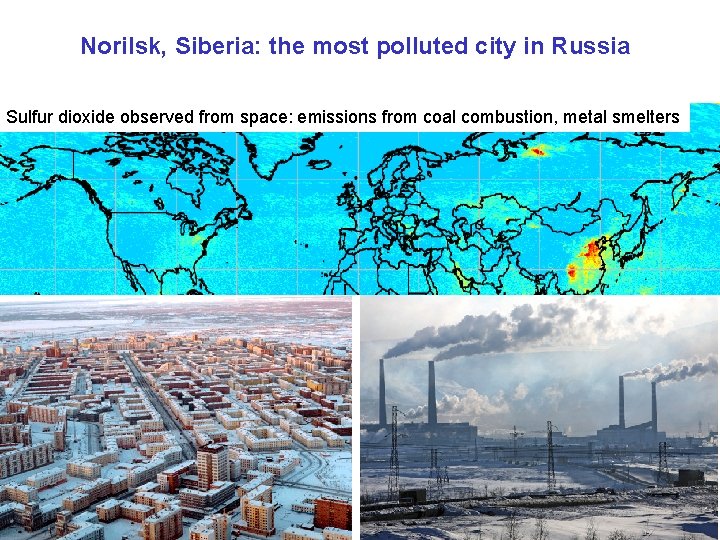
Norilsk, Siberia: the most polluted city in Russia Sulfur dioxide observed from space: emissions from coal combustion, metal smelters
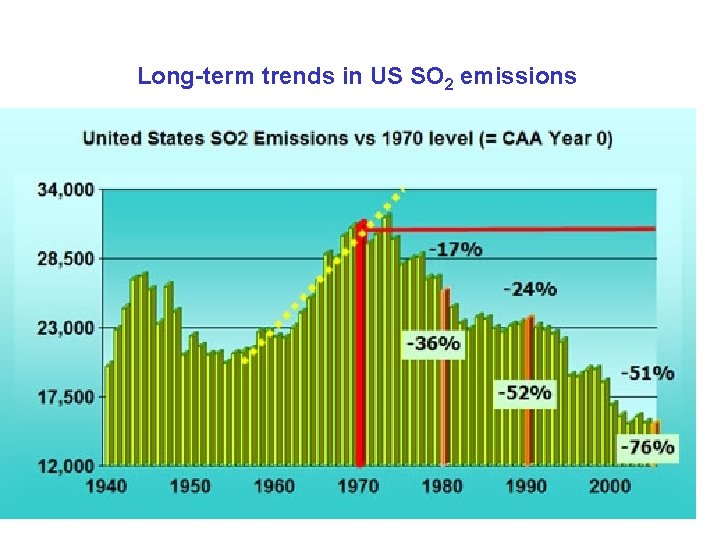
Long-term trends in US SO 2 emissions
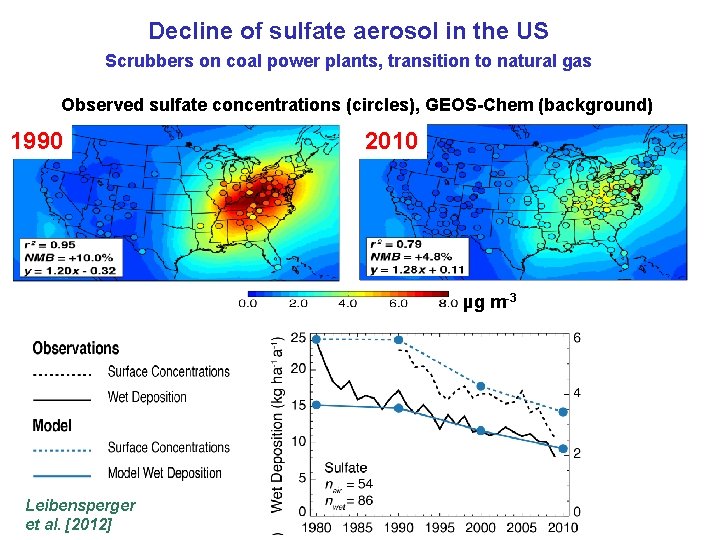
Decline of sulfate aerosol in the US Scrubbers on coal power plants, transition to natural gas Observed sulfate concentrations (circles), GEOS-Chem (background) 1990 2010 µg m-3 Leibensperger et al. [2012]
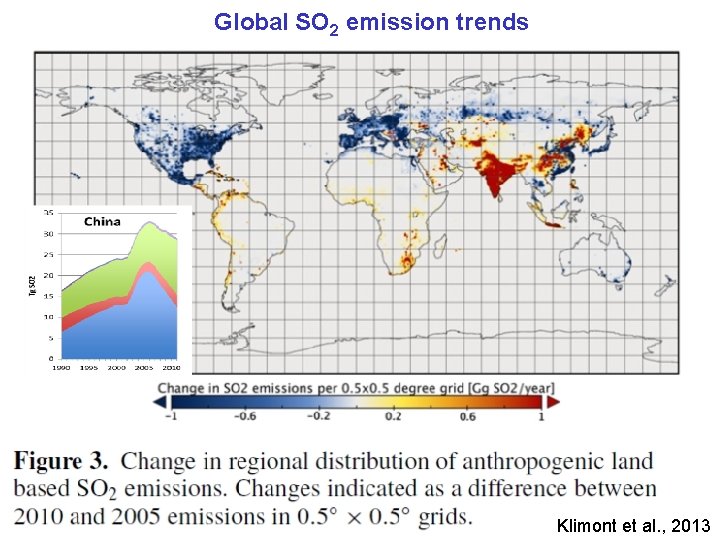
Global SO 2 emission trends Klimont et al. , 2013
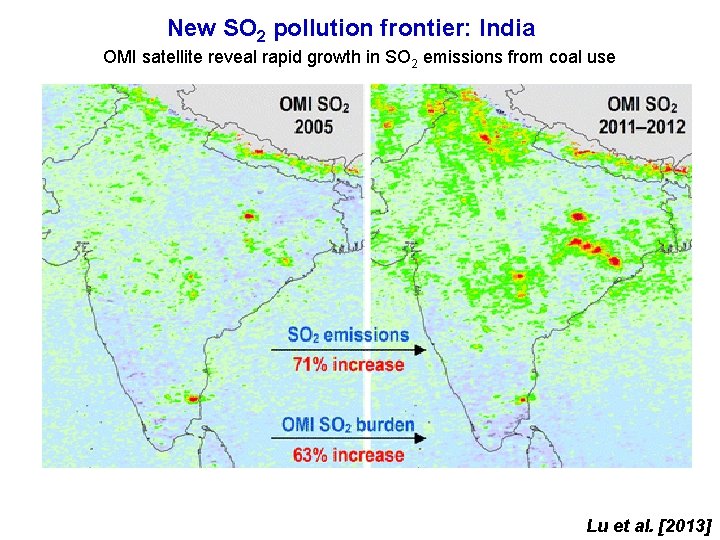
New SO 2 pollution frontier: India OMI satellite reveal rapid growth in SO 2 emissions from coal use Lu et al. [2013]
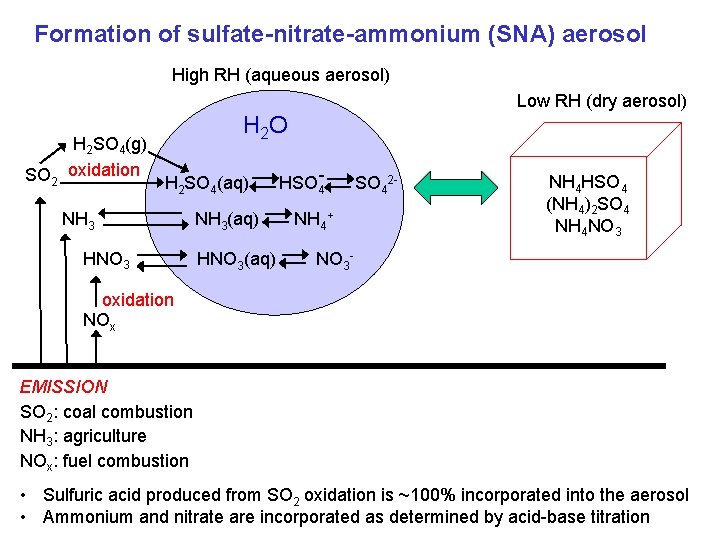
Formation of sulfate-nitrate-ammonium (SNA) aerosol High RH (aqueous aerosol) Low RH (dry aerosol) H 2 O H 2 SO 4(g) SO 2 oxidation H SO (aq) 2 4 NH 3 HNO 3 NH 3(aq) HNO 3(aq) HSO 4 NH 4+ SO 42 - NH 4 HSO 4 (NH 4)2 SO 4 NH 4 NO 3 - oxidation NOx EMISSION SO 2: coal combustion NH 3: agriculture NOx: fuel combustion • Sulfuric acid produced from SO 2 oxidation is ~100% incorporated into the aerosol • Ammonium and nitrate are incorporated as determined by acid-base titration
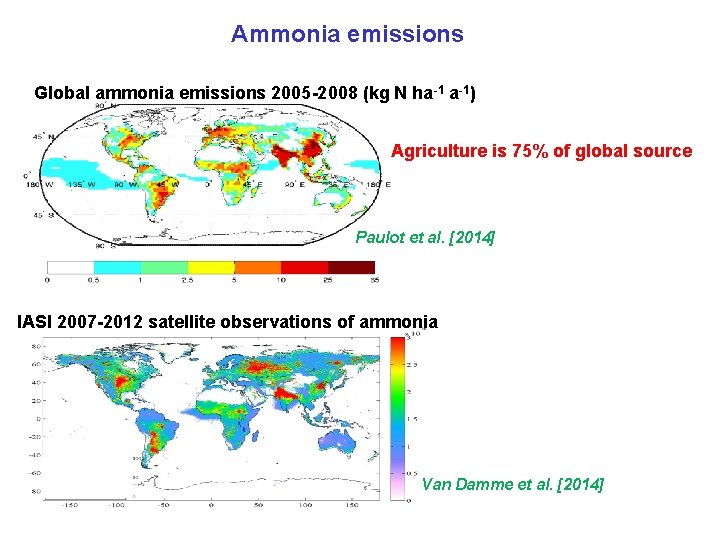
Ammonia emissions Global ammonia emissions 2005 -2008 (kg N ha-1 a-1) Agriculture is 75% of global source Paulot et al. [2014] IASI 2007 -2012 satellite observations of ammonia Van Damme et al. [2014]
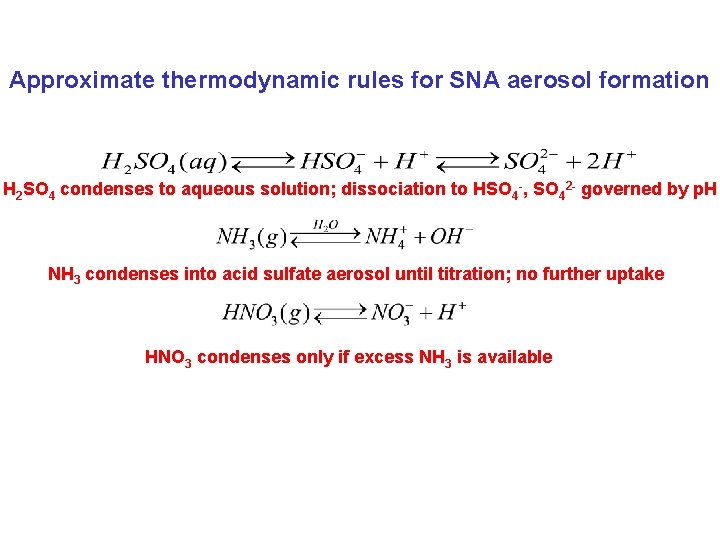
Approximate thermodynamic rules for SNA aerosol formation H 2 SO 4 condenses to aqueous solution; dissociation to HSO 4 -, SO 42 - governed by p. H NH 3 condenses into acid sulfate aerosol until titration; no further uptake HNO 3 condenses only if excess NH 3 is available
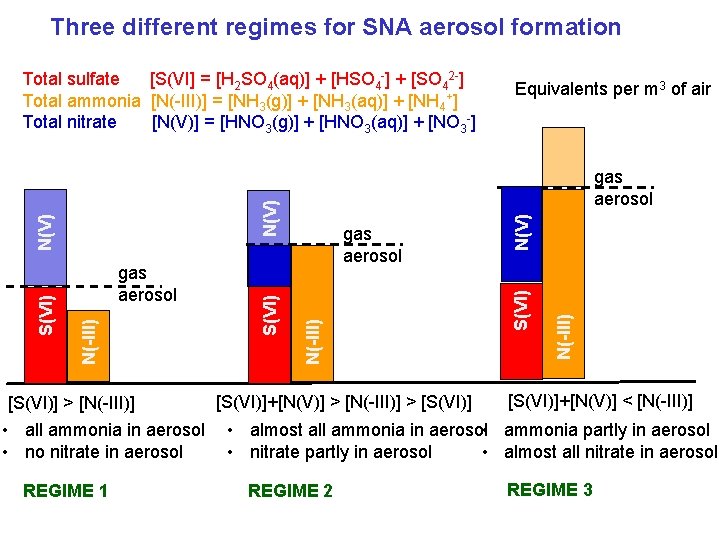
Three different regimes for SNA aerosol formation Total sulfate [S(VI] = [H 2 SO 4(aq)] + [HSO 4 -] + [SO 42 -] Total ammonia [N(-III)] = [NH 3(g)] + [NH 3(aq)] + [NH 4+] Total nitrate [N(V)] = [HNO 3(g)] + [HNO 3(aq)] + [NO 3 -] N(-III) S(VI) N(-III) gas aerosol N(V) N(-III) S(VI) N(V) S(VI) gas aerosol Equivalents per m 3 of air [S(VI)]+[N(V)] < [N(-III)] [S(VI)]+[N(V)] > [N(-III)] > [S(VI)] > [N(-III)] • all ammonia in aerosol • almost all ammonia in aerosol • ammonia partly in aerosol • almost all nitrate in aerosol • nitrate partly in aerosol • no nitrate in aerosol REGIME 1 REGIME 2 REGIME 3
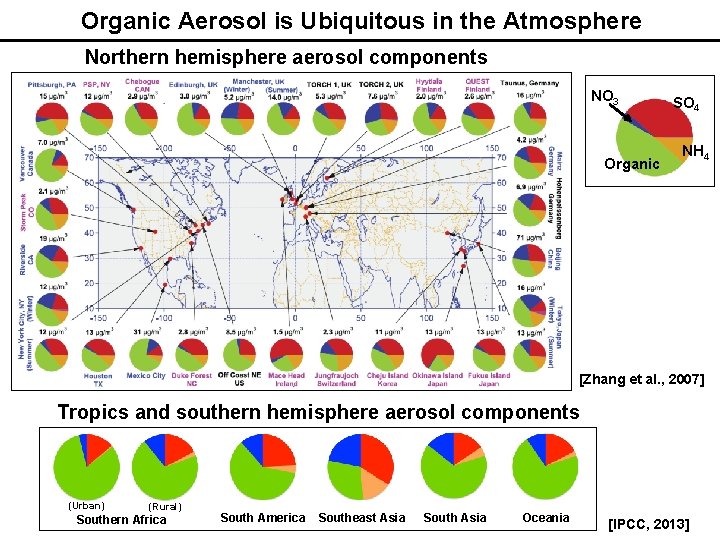
Organic Aerosol is Ubiquitous in the Atmosphere Northern hemisphere aerosol components NO 3 Organic SO 4 NH 4 [Zhang et al. , 2007] Tropics and southern hemisphere aerosol components (Urban) (Rural) Southern Africa South America Southeast Asia South Asia Oceania [IPCC, 2013]
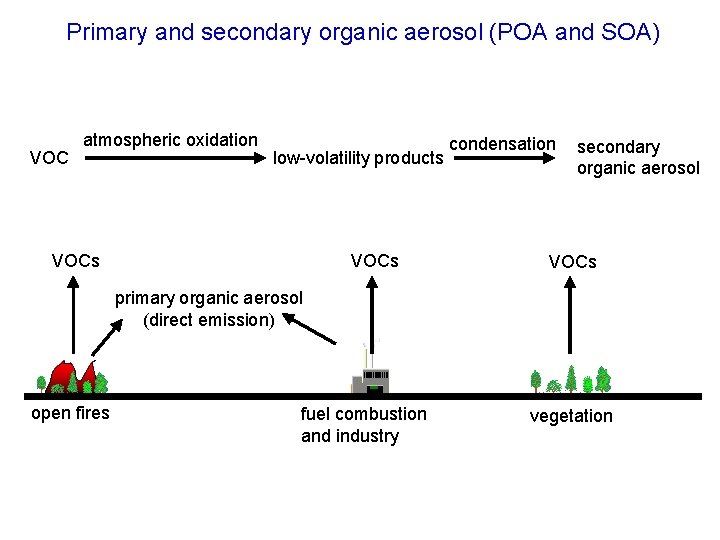
Primary and secondary organic aerosol (POA and SOA) VOC atmospheric oxidation low-volatility products VOCs condensation secondary organic aerosol VOCs primary organic aerosol (direct emission) open fires fuel combustion and industry vegetation
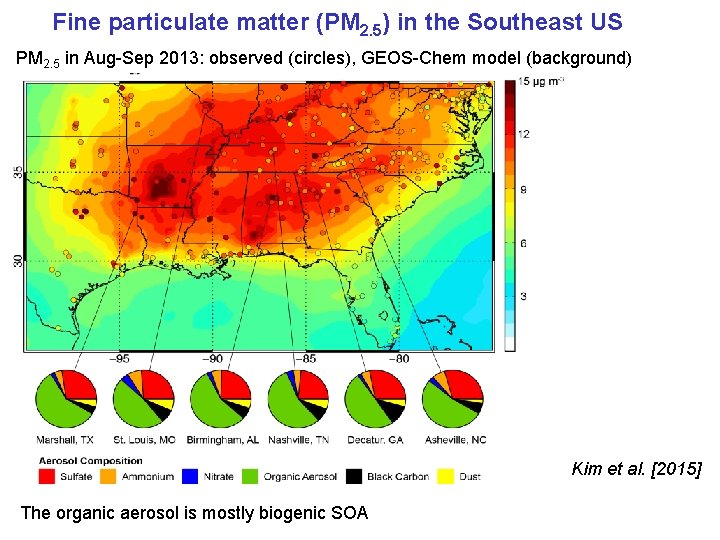
Fine particulate matter (PM 2. 5) in the Southeast US PM 2. 5 in Aug-Sep 2013: observed (circles), GEOS-Chem model (background) Kim et al. [2015] The organic aerosol is mostly biogenic SOA
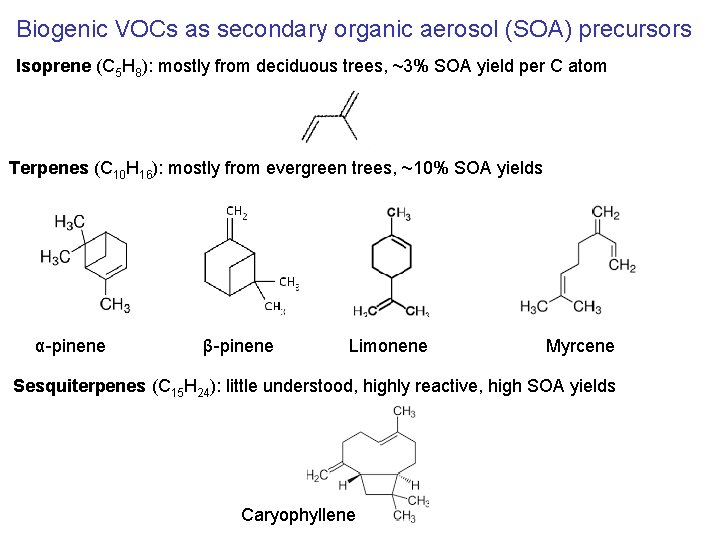
Biogenic VOCs as secondary organic aerosol (SOA) precursors Isoprene (C 5 H 8): mostly from deciduous trees, ~3% SOA yield per C atom Terpenes (C 10 H 16): mostly from evergreen trees, ~10% SOA yields α-pinene β-pinene Limonene Myrcene Sesquiterpenes (C 15 H 24): little understood, highly reactive, high SOA yields Caryophyllene
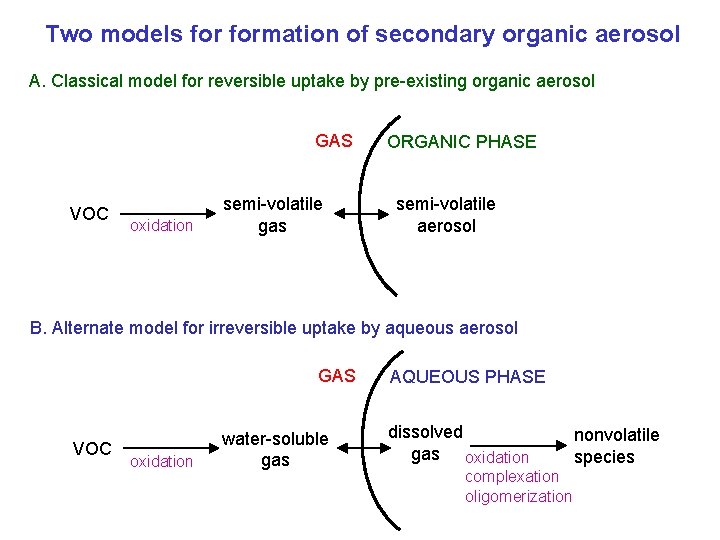
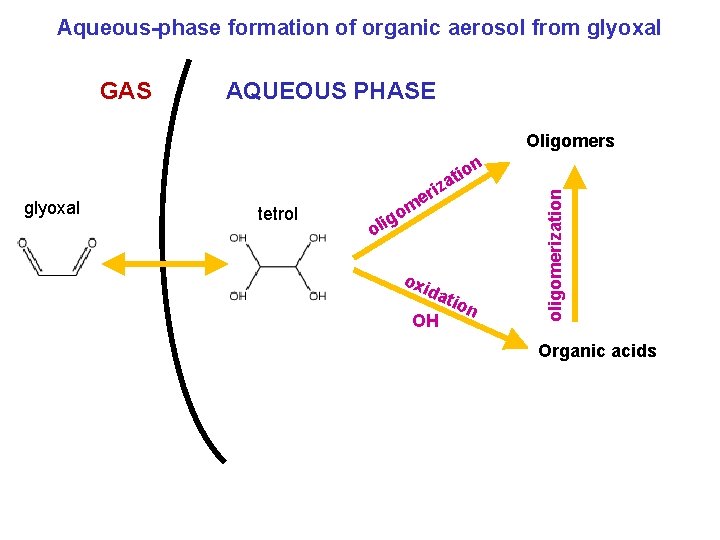
Two models formation of secondary organic aerosol A. Classical model for reversible uptake by pre-existing organic aerosol GAS VOC oxidation semi-volatile gas ORGANIC PHASE semi-volatile aerosol B. Alternate model for irreversible uptake by aqueous aerosol GAS VOC oxidation water-soluble gas AQUEOUS PHASE dissolved gas oxidation complexation oligomerization nonvolatile species
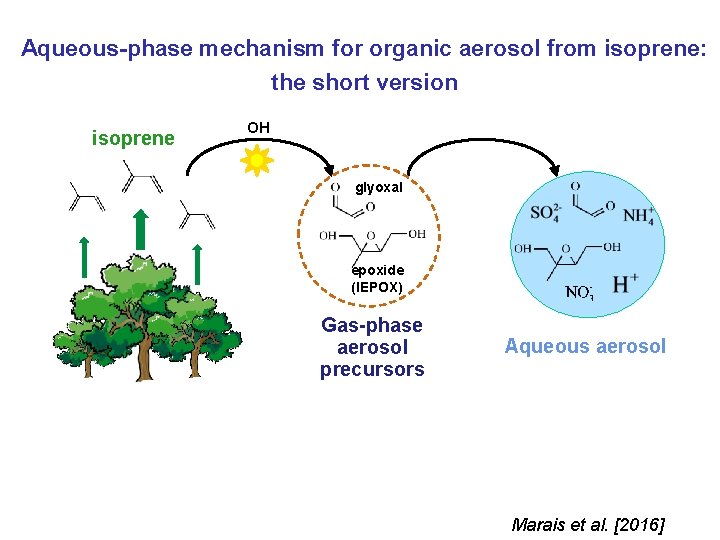
Aqueous-phase mechanism for organic aerosol from isoprene: the short version isoprene OH glyoxal epoxide (IEPOX) Gas-phase aerosol precursors Aqueous aerosol Marais et al. [2016]
Aqueous-phase formation of organic aerosol from glyoxal GAS AQUEOUS PHASE Oligomers glyoxal tetrol o g oli riz e m oxi dat OH ion oligomerization n o ati Organic acids
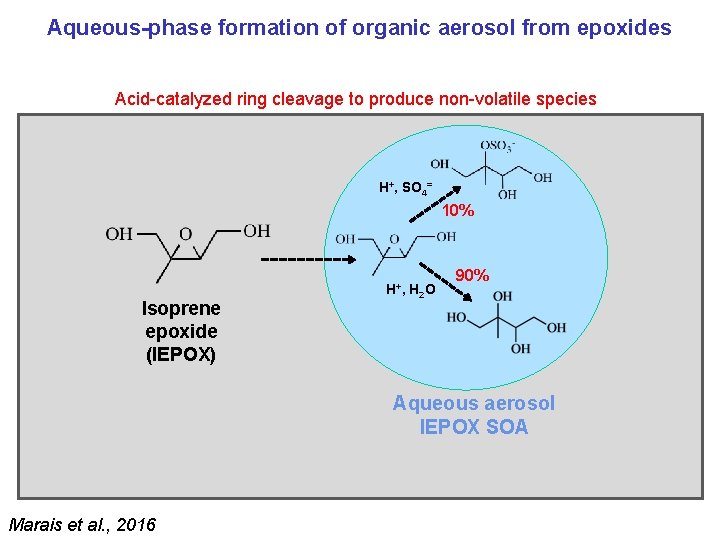
Aqueous-phase formation of organic aerosol from epoxides Acid-catalyzed ring cleavage to produce non-volatile species H+, SO 4= 10% Isoprene epoxide (IEPOX) H+, H 2 O 90% Aqueous aerosol IEPOX SOA Marais et al. , 2016
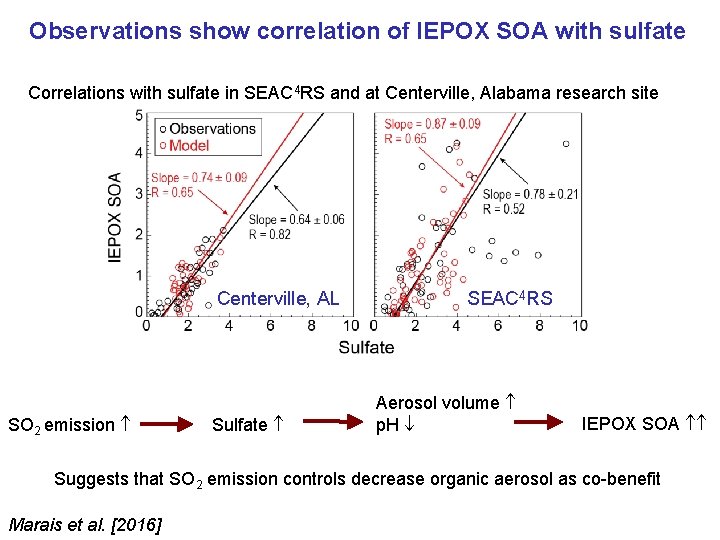
Observations show correlation of IEPOX SOA with sulfate Correlations with sulfate in SEAC 4 RS and at Centerville, Alabama research site Centerville, AL SO 2 emission Sulfate SEAC 4 RS Aerosol volume p. H IEPOX SOA Suggests that SO 2 emission controls decrease organic aerosol as co-benefit Marais et al. [2016]
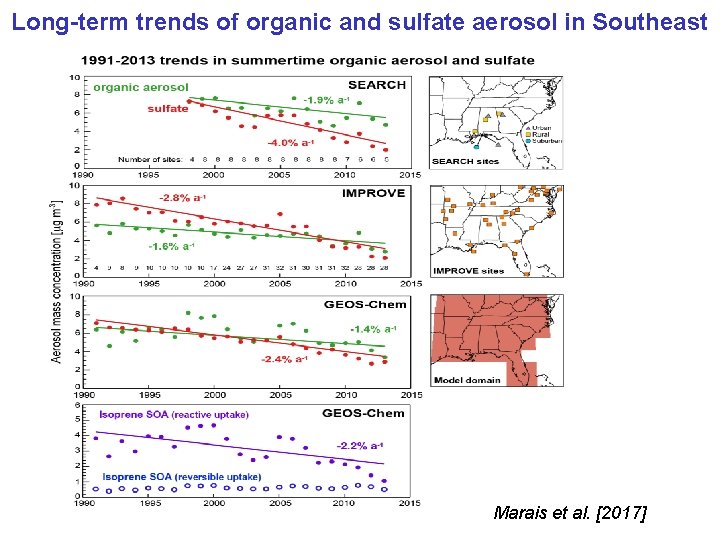
Long-term trends of organic and sulfate aerosol in Southeast Marais et al. [2017]
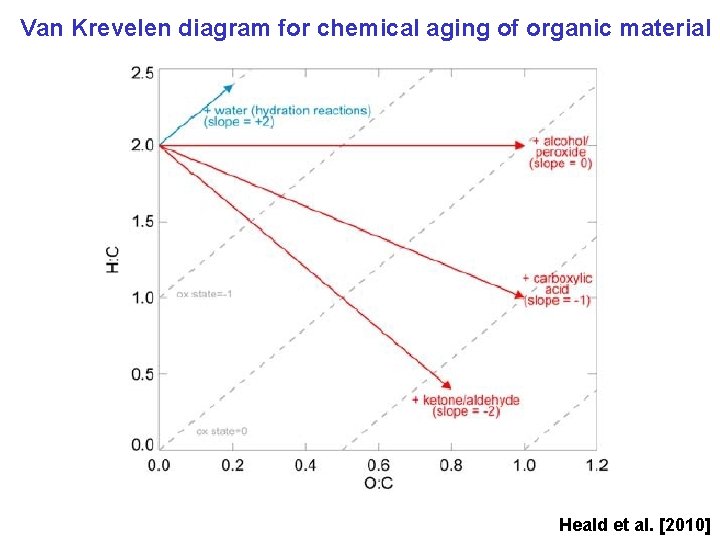
Van Krevelen diagram for chemical aging of organic material Heald et al. [2010]
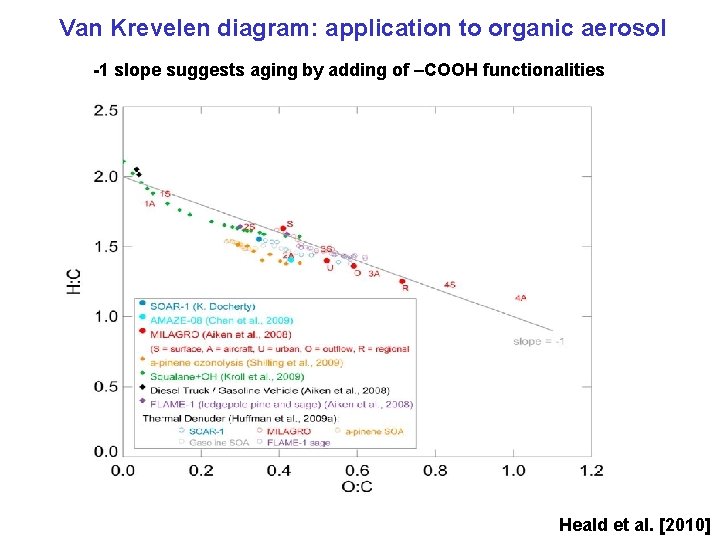
Van Krevelen diagram: application to organic aerosol -1 slope suggests aging by adding of –COOH functionalities Heald et al. [2010]
Questions 1. In Regime 2 of sulfate-nitrate-ammonium (SNA) aerosol formation, decreasing SO 2 emisssions can actually cause an increase in total aerosol mass. Why? [hint: sulfate has a molar mass of 96 g mol-1, nitrate has a molar mass of 62 g mol-1] 2. Whether secondary organic aerosol (SOA) forms in the organic phase or in the aqueous phase, there is a positive feedback effect in that the more aerosol you have, the more SOA you form. Explain.