PARTICLE THERAPY MASTERCLASS HandsOn Treatment Planning with mat


.")
 and start inverse optimization by clicking")

. Next, show the DVH by")

 and start inverse optimization by clicking")
. Next, show the DVH by")
: Region/Radiation Photons Protons Core 1. 0665 0.")

. Show the DVH by („Show")
: Region/Radiation(angles) Photons(0) Protons(0) Photons (0, 72, 144,")
")
 and start inverse optimization („Optimize“). Save the")
 using 5 beams with and without constraints:")

")

 and start inverse optimization („Optimize“).")
. Next, show the DVH by")

. Next, show the DVH by")

. Next, show the DVH by")
 using 5 photon beams, sigle proton beam")

")

 and save it („Save to GUI“).")


 using three proton beams, with and without")
")
- Slides: 45
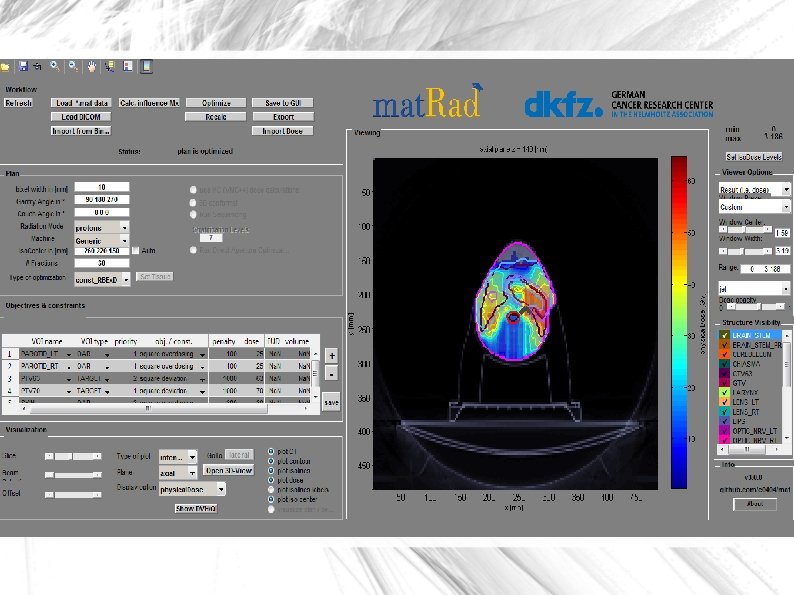
PARTICLE THERAPY MASTERCLASS Hands-On Treatment Planning with mat. Rad Workflow step by step instructions Amila Avdić
1 st Exercise First steps on the TG 119 phantom Radiotherapy treatment - photons vs. protons vs. carbon ions Analysing and comparing results
1. Load the TG 119 phantom via the Load *. mat button (TG 119. mat).
2. Set radiation modality to Photons and define one beam angle (gantry angle).
3. Trigger dose calculation viabutton („Calc. Influence Mx“) and start inverse optimization by clicking on („Optimize“).
4. Analyze the resulting dose distribution.
5. Save the optimization result via („Save to GUI“). Next, show the DVH by („Show DVH/QI”).
6. Change the radiation modality to: Protons and leave the beam angles unchanged.
7. Trigger dose calculation viabutton („Calc. Influence. Mx“) and start inverse optimization by clicking on („Optimize“).
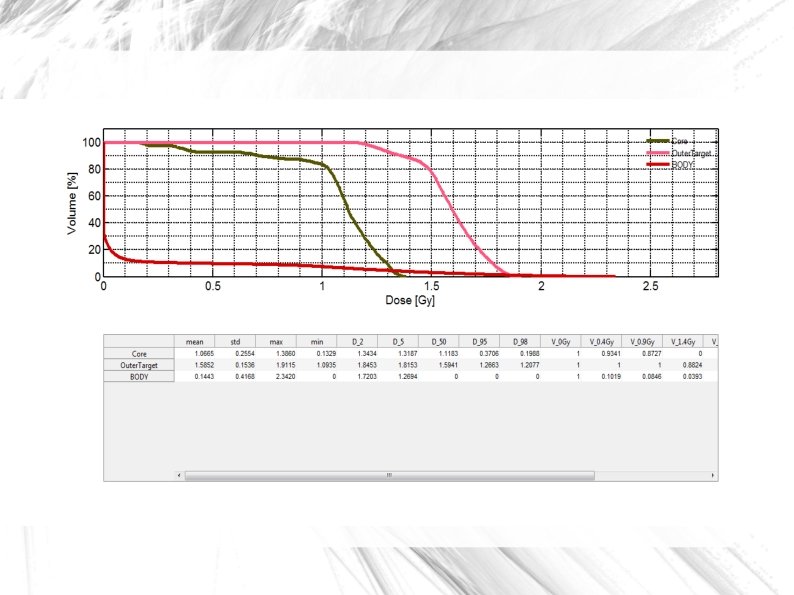
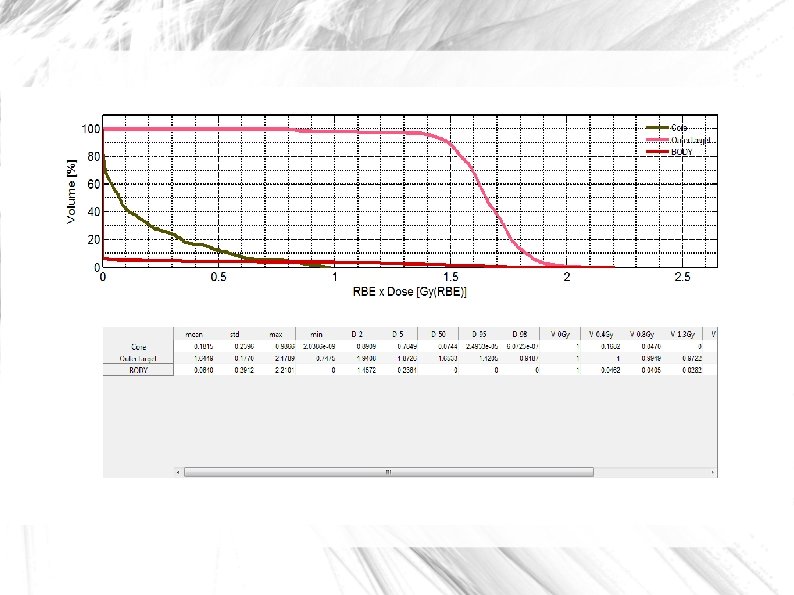
8. Save the optimization result via („Save to GUI“). Next, show the DVH by („Show DVH/QI”). Analyze the dose distribution.
Results Mean doses for different regions (Gy): Region/Radiation Photons Protons Core 1. 0665 0. 1815 Outer Target 1. 5852 1. 6449 Body 0. 1443 0. 0640 Photons deliver highest dose at the surface Protons deliver highest dose at the target (tumor) and protect sensitive organs
9. Try to define a better photon treatment plan by defining more beam angles (e. g. [0, 72, 144, 216, 288]). Trigger dose calculation („Calc. Influence Mx“) and start inverse optimization („Optimize“).
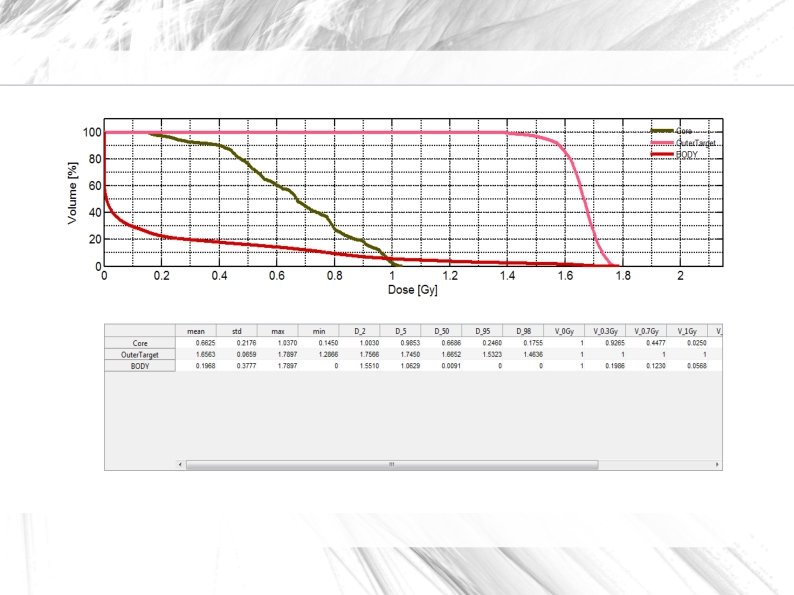
10. Save the optimization result via („Save to GUI“). Show the DVH by („Show DVH/QI”). Analyze resulting dose distribution.
Results Mean doses for different regions (Gy): Region/Radiation(angles) Photons(0) Protons(0) Photons (0, 72, 144, 216, 288) Core 1. 0665 0. 1815 0. 6625 Outer Target 1. 5852 1. 6449 1. 6563 Body 0. 1443 0. 0640 0. 1968 Treatment plan using multiple photon beams gives better results than single photon beam. Best results are obtained using protons.
11. Change optimization objective to improve the photon treatment plan. Use Table („Objectives &constraints“) and add for e. g. maximal dose for the core or minimal dose for the outer target.
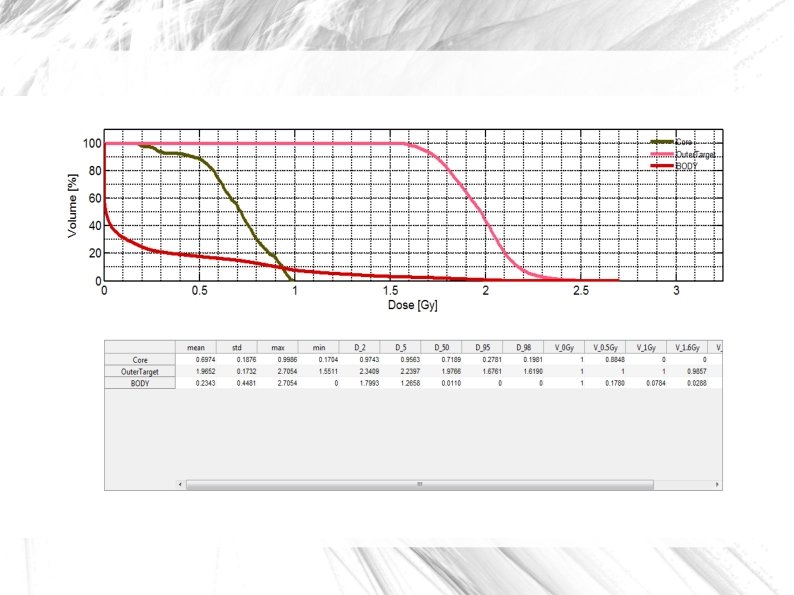
12. Trigger dose calculation („Calc. Influence Mx“) and start inverse optimization („Optimize“). Save the optimization result via („Save to GUI“). Next, show the DVH by („Show DVH/QI”).
Results Mean doses for different regions (Gy) using 5 beams with and without constraints: Region/Radiation With constraints Without constraints Core 0. 6625 0. 6974 Outer Target 1. 6563 1. 9652 Body 0. 1968 0. 2343
nd 2 Exercise Carbon ion treatment plan for a liver patient Defining treatment plan using photons and protons Analysing and comparing diferent treatment plans
1. Load the liver patient case via the Load *. mat button (LIVER. mat)
2. Define your own photon treatment plan with approx. 4 -5 beam directions.
3. Trigger dose calculation („Calc. Influence Mx“) and start inverse optimization („Optimize“).
4. Save the optimization result via („Save to GUI“). Next, show the DVH by („Show DVH/QI”). Analyze dose distribution.
5. Define your own proton treatment plan with one beam from e. g. 315°. Then trigger dose calculation („Calc. Influence Mx“) and start inverse optimization („Optimize“).
6. Save the optimization result via („Save to GUI“). Next, show the DVH by („Show DVH/QI”). Analyze the resulting dose distribution.
7. Create a carbon ion treatment with the exact same settings as used for the proton treatment plan – What difference can now be observed?
8. Save the optimization result via („Save to GUI“). Next, show the DVH by („Show DVH/QI”). Analyze the resulting dose distribution.
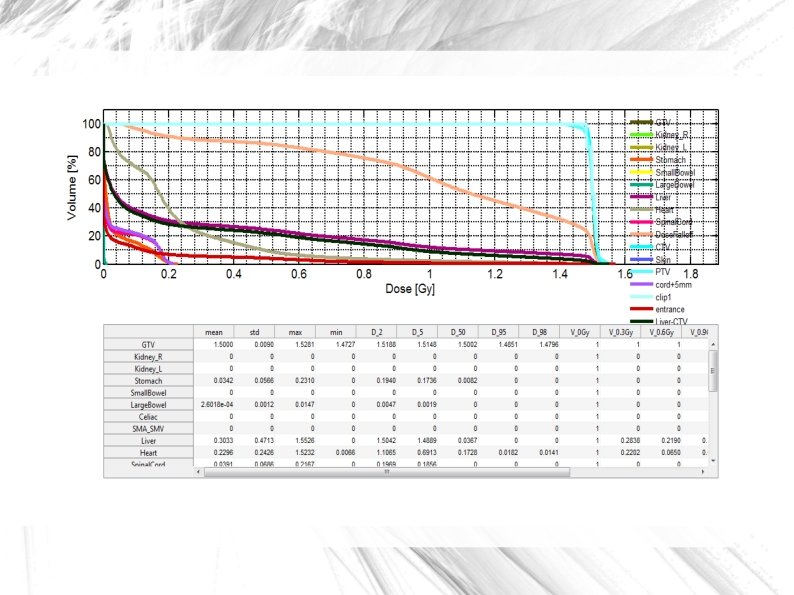
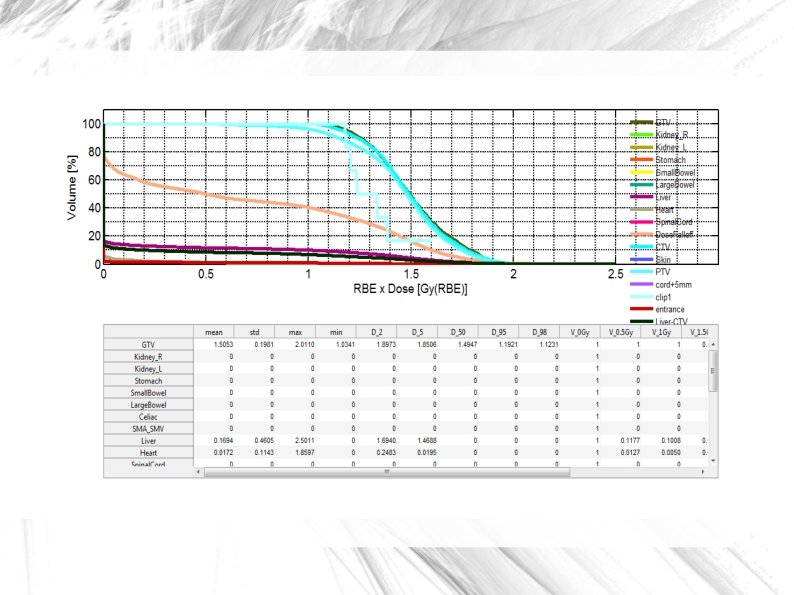
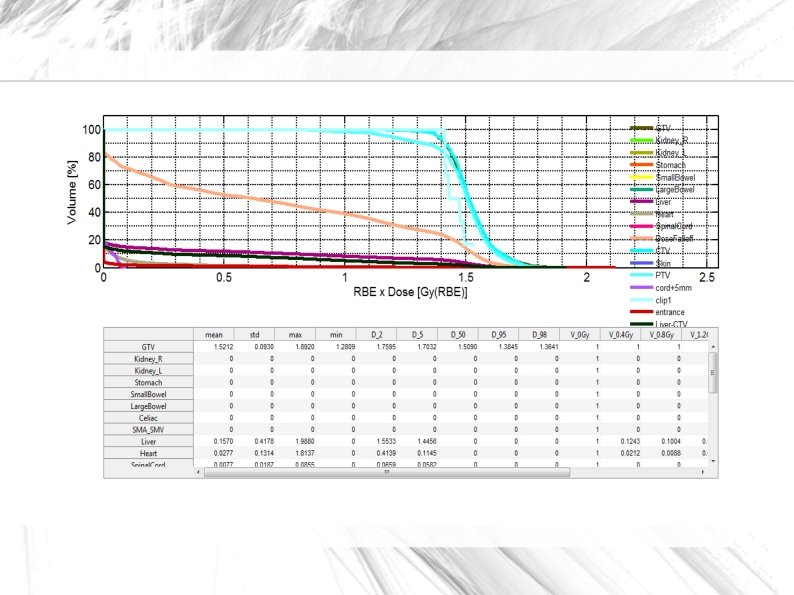
Results Mean doses for different regions (Gy) using 5 photon beams, sigle proton beam and carbon ion beam: Region/Radiation( Photons(0, 180, 22 angles) 5, 270, 315) Protons(315) Carbon(315) GTV 1. 5053 1. 5212 Kidneys 0 0 0 Stomach 0. 0342 0 0 Liver 0. 3033 0. 1694 0. 1570 Heart 0. 2296 0. 0172 0. 0277 Spinal Cord 0. 0391 0 0. 0077 CTV 1. 5015 1. 4981 1. 5236 PTV 1. 4991 1. 4595 1. 4868 Skin 0. 0568 0. 0179 0. 0162
rd 3 Exercise Treatment planning uncertainties Proton radiotherapy plan for patients head Simulating a patient positioning error Analysing and comparing resulting dose distributions
1. Load a head patient case (HEAD_AND_NECK or. ALDERSON. mat)
2. Add three proton beam angles on your own. Calculate and optimize the dose („Calc. Influence Mx“ & „Optimize“).
3. Analyze the result (dose& DVH) and save it („Save to GUI“).
4. Simulate a patient positioning error: Remove the hook at the auto iso-center checkbox and define a new iso-center. Recalculate the dose by clicking on the „Recalc“.
5. Moving “Slice” option find iso-center and analyze and compare the resulting dose distribution.
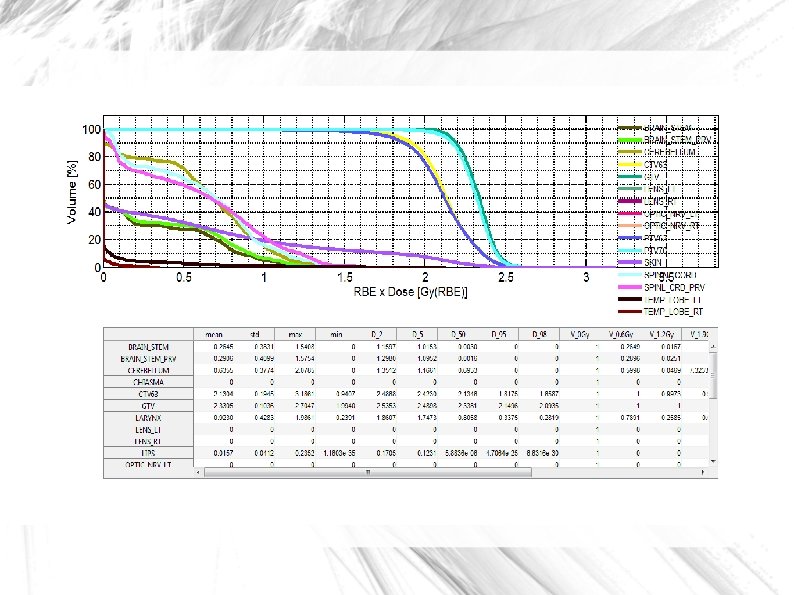
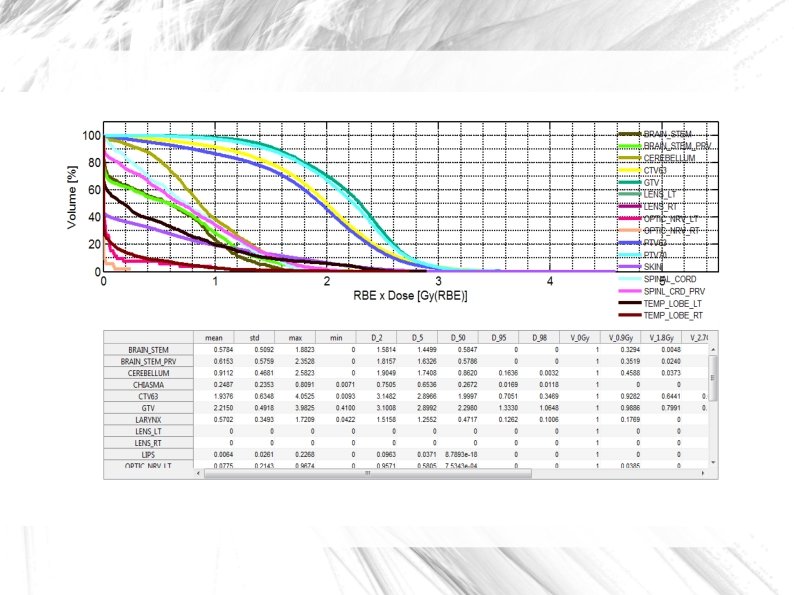
Results Mean doses for diferent regions (Gy) using three proton beams, with and without patients movement: Region/Iso-center Without movement With movement Brain Stem 0. 2645 0. 5784 Cerebellum 0. 6355 0. 9112 CTV 63 2. 1304 1. 9376 GTV 2. 3305 2. 2150 Lenses (L, D) 0, 0 Skin 0. 4682 0. 4555 Optic Nerv (L, D) 0, 0 0. 0775, 0. 0092 Spinal Cord 0. 6268 0. 7466 PTV 63 2. 1092 1. 8369 PTV 70 2. 3102 2. 1671
Thank you : )