
Particle Size Increasing in Crush Leach Operations Manuel


- Slides: 22
Particle Size Increasing in Crush Leach Operations Manuel Aragón Jose Luis Alvis
Contents • • • Objectives – Show the whole process for increasing the particle size in Pad 4 B to improve the permeability and receive more total Clays and Swelling Clays in the ore delivered to Hydro. – Review all the test developed at Lab and Industrial scale that supported this change. Antecedents in Pad 4 B (Clays content, Impacts on Production) Options to deal with Clays Aspects to be evaluated for size increasing (recovery, agglomeration and permeability tests, following up Decrepitation). Conclusions
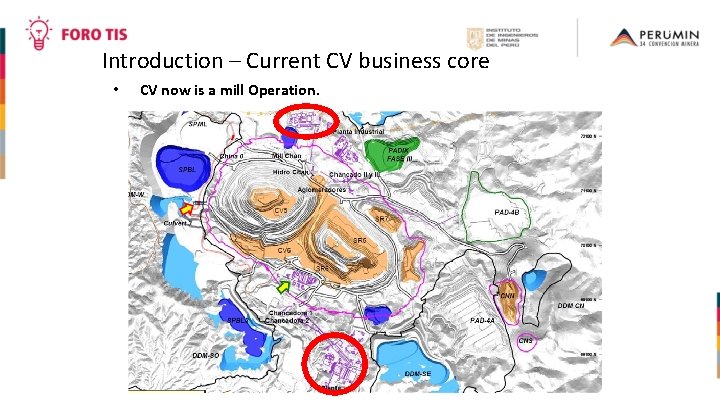
Introduction – Current CV business core • CV now is a mill Operation.
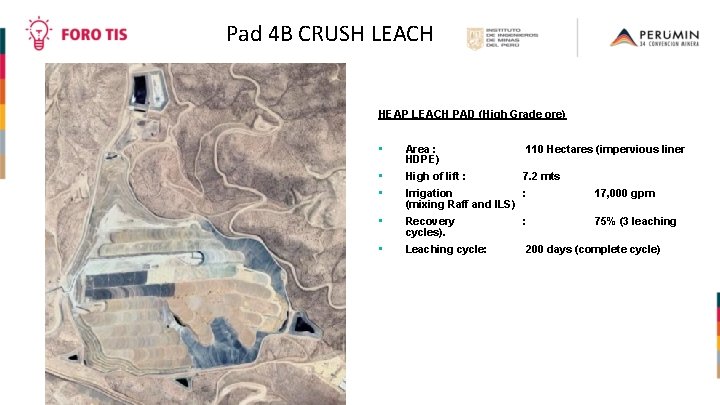
Pad 4 B CRUSH LEACH HEAP LEACH PAD (High Grade ore) • Area : HDPE) 110 Hectares (impervious liner • • High of lift : 7. 2 mts Irrigation : (mixing Raff and ILS) 17, 000 gpm • Recovery cycles). : 75% (3 leaching • Leaching cycle: 200 days (complete cycle)
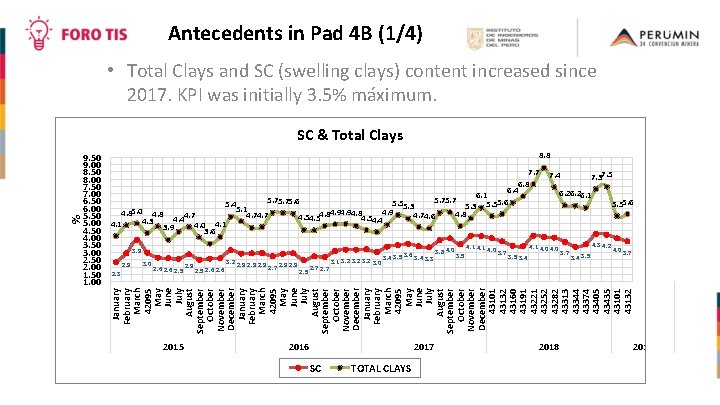
Antecedents in Pad 4 B (1/4) • Total Clays and SC (swelling clays) content increased since 2017. KPI was initially 3. 5% máximum. 8. 8 9. 50 9. 00 7. 7 7. 4 8. 50 7. 37. 5 8. 00 6. 8 7. 50 6. 4 6. 26. 1 7. 00 6. 1 5. 75. 75. 6 6. 50 5. 6 5. 55. 3 5. 55. 6 5. 4 5. 3 6. 00 5. 1 4. 94. 8 4. 9 4. 85. 0 4. 8 4. 7 4. 6 5. 50 4. 54. 4 4. 3 5. 00 4. 1 4. 0 4. 1 3. 9 4. 50 3. 6 4. 00 4. 3 4. 2 3. 50 4. 1 4. 0 3. 7 3. 9 3. 8 4. 0 3. 7 3. 00 3. 6 3. 5 3. 4 3. 3 3. 2 2. 50 3. 2 3. 1 3. 0 2. 9 2. 7 2. 00 2. 6 2. 5 2. 9 2. 5 2. 6 2. 5 1. 50 2. 3 1. 00 January February March 42095 May June July August September October November December 43101 43132 43160 43191 43221 43252 43282 43313 43344 43374 43405 43435 43101 43132 % SC & Total Clays 2015 2016 2017 SC TOTAL CLAYS 2018 2019
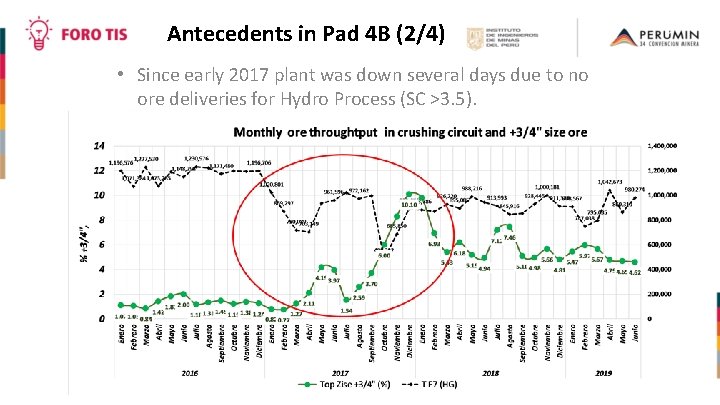
Antecedents in Pad 4 B (2/4) • Since early 2017 plant was down several days due to no ore deliveries for Hydro Process (SC >3. 5).
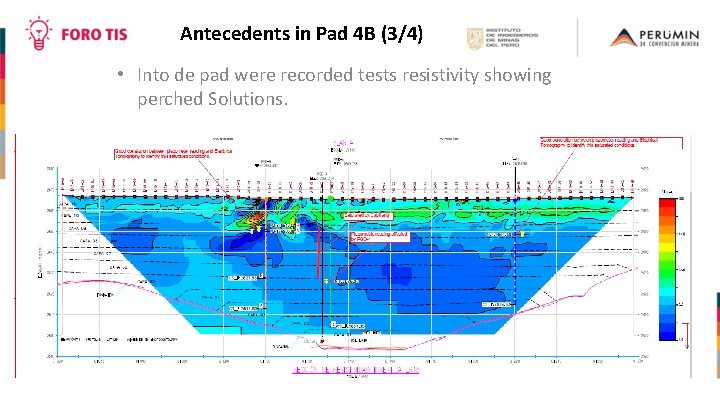
Antecedents in Pad 4 B (3/4) • Into de pad were recorded tests resistivity showing perched Solutions.
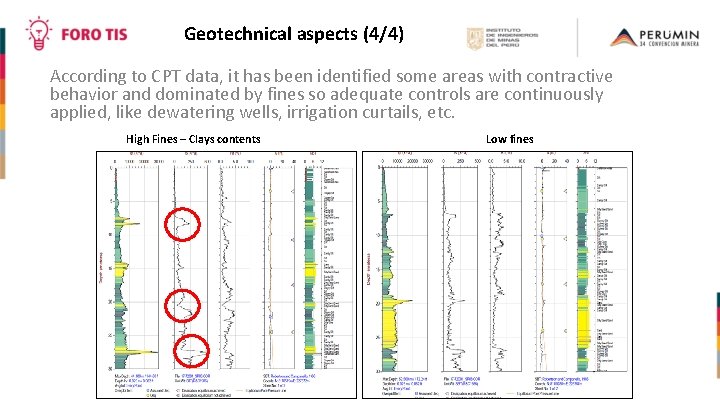
Geotechnical aspects (4/4) According to CPT data, it has been identified some areas with contractive behavior and dominated by fines so adequate controls are continuously applied, like dewatering wells, irrigation curtails, etc. High Fines – Clays contents Low fines
Options to deal with Clays 1. Increase particle size and lose some points in Recovery. 2. Improve blending in the Mine – Not an option for a mostly Mill Operation. 3. Improve blending in the primary crushing stockpile - But if you only receive high fines-clay material no coarse ore to blend. 4. Install addition drainage systems – Increase operating costs and no effective for all the pad extension. Recovery is also and issue due to PLS short circuit.
Aspects to be evaluated for size increasing 1. Effects on Cu recovery. 2. Maximum top size for optimal agglomeration. 3. Decrepitation and fines migration. 4. Effect on Heap Permeability
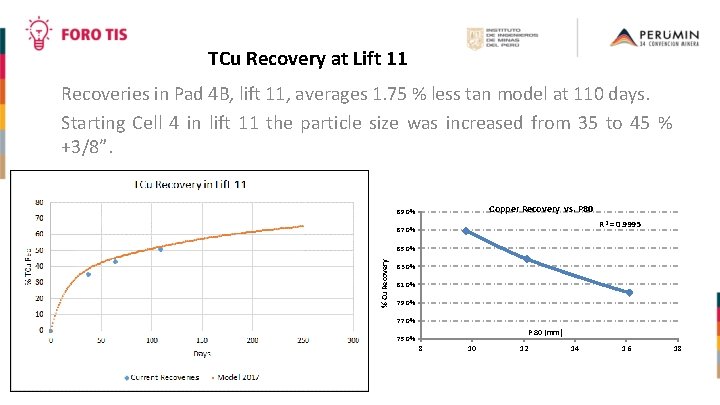
TCu Recovery at Lift 11 Recoveries in Pad 4 B, lift 11, averages 1. 75 % less tan model at 110 days. Starting Cell 4 in lift 11 the particle size was increased from 35 to 45 % +3/8”. Copper Recovery vs. P 80 89. 0% R 2 = 0. 9995 87. 0% % Cu Recovery 85. 0% 83. 0% 81. 0% 79. 0% 77. 0% P 80 (mm) 75. 0% 8 10 12 14 16 18
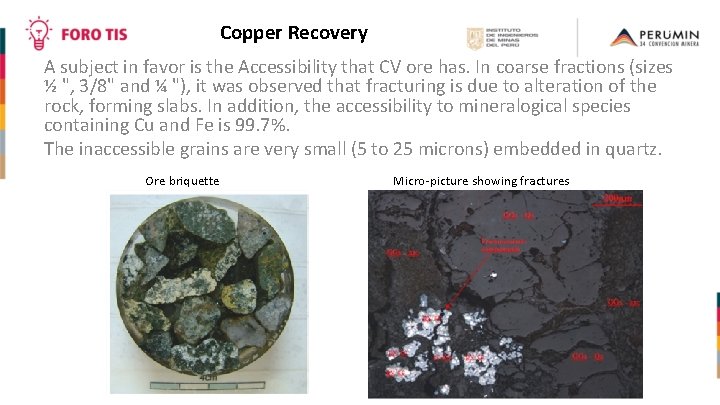
Copper Recovery A subject in favor is the Accessibility that CV ore has. In coarse fractions (sizes ½ ", 3/8" and ¼ "), it was observed that fracturing is due to alteration of the rock, forming slabs. In addition, the accessibility to mineralogical species containing Cu and Fe is 99. 7%. The inaccessible grains are very small (5 to 25 microns) embedded in quartz. Ore briquette Micro-picture showing fractures
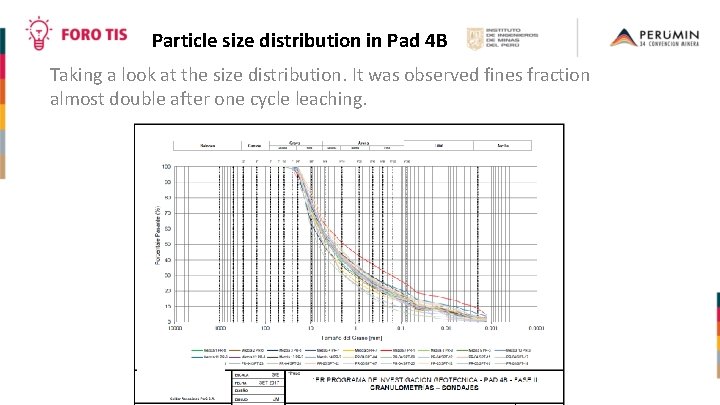
Particle size distribution in Pad 4 B Taking a look at the size distribution. It was observed fines fraction almost double after one cycle leaching.
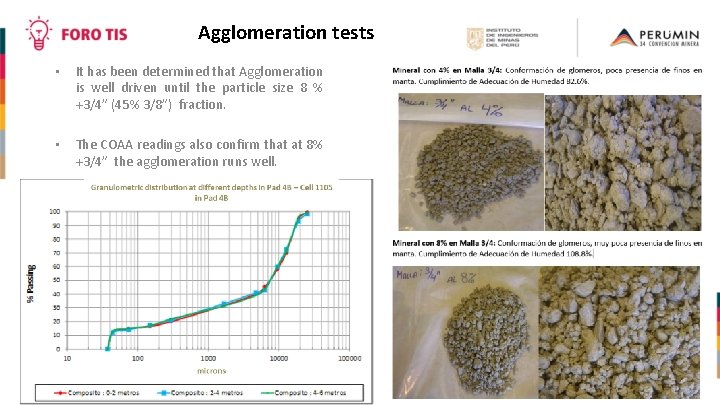
Agglomeration tests • It has been determined that Agglomeration is well driven until the particle size 8 % +3/4” (45% 3/8”) fraction. • The COAA readings also confirm that at 8% +3/4” the agglomeration runs well.
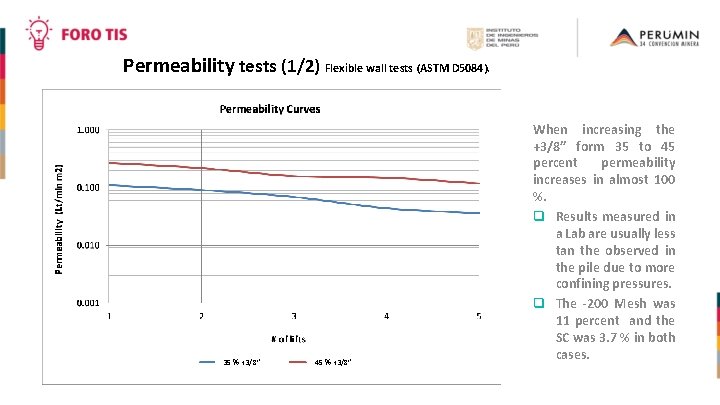
Permeability tests (1/2) Flexible wall tests (ASTM D 5084). 35 % +3/8” 45 % +3/8” When increasing the +3/8” form 35 to 45 percent permeability increases in almost 100 %. q Results measured in a Lab are usually less tan the observed in the pile due to more confining pressures. q The -200 Mesh was 11 percent and the SC was 3. 7 % in both cases.
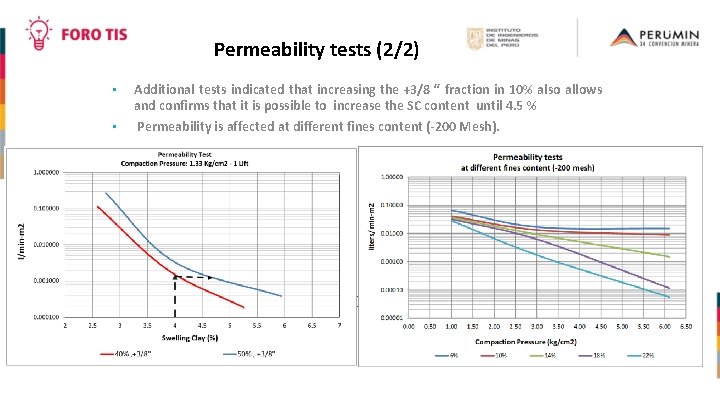
Permeability tests (2/2) • • Additional tests indicated that increasing the +3/8 “ fraction in 10% also allows and confirms that it is possible to increase the SC content until 4. 5 % Permeability is affected at different fines content (-200 Mesh).
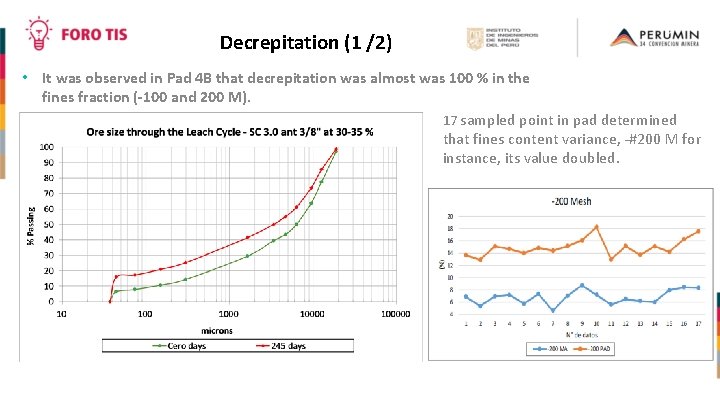
Decrepitation (1 /2) • It was observed in Pad 4 B that decrepitation was almost was 100 % in the fines fraction (-100 and 200 M). 17 sampled point in pad determined that fines content variance, -#200 M for instance, its value doubled.
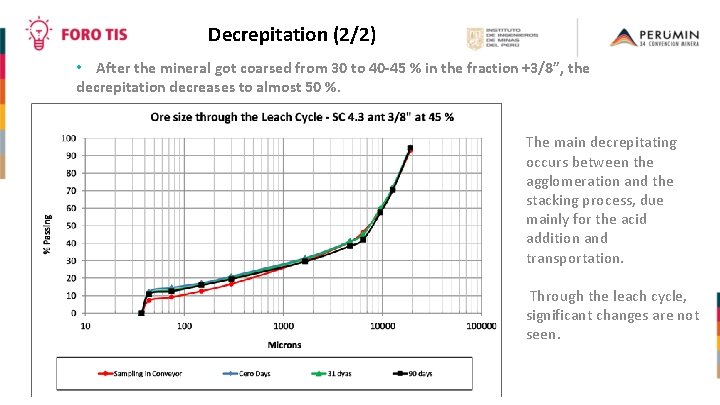
Decrepitation (2/2) • After the mineral got coarsed from 30 to 40 -45 % in the fraction +3/8”, the decrepitation decreases to almost 50 %. The main decrepitating occurs between the agglomeration and the stacking process, due mainly for the acid addition and transportation. Through the leach cycle, significant changes are not seen.
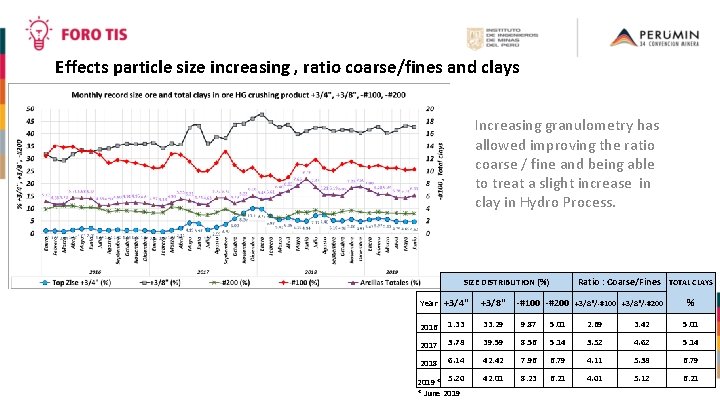
Effects particle size increasing , ratio coarse/fines and clays Increasing granulometry has allowed improving the ratio coarse / fine and being able to treat a slight increase in clay in Hydro Process. SIZE DISTRIBUTION (%) Year +3/4" +3/8" -#100 -#200 Ratio : Coarse/Fines TOTAL CLAYS +3/8"/-#100 +3/8"/-#200 % 2016 1. 33 33. 29 9. 87 5. 01 2. 69 3. 42 5. 01 2017 3. 78 39. 59 8. 56 5. 14 3. 52 4. 62 5. 14 2018 6. 14 42. 42 7. 96 6. 79 4. 11 5. 38 6. 79 2019* 5. 20 * June 2019 42. 01 8. 23 6. 21 4. 01 5. 12 6. 21
Conclusions (1/2) • It is possible to reach good agglomeration quality at 8% +3/4. • TCu Recovery is affected @ 3 % after the first leach cycle. • Permeability increases notably when the +3/8” fractions goes from 30 to 40 -45% +3/8”. • Even at 5 % as S-Clay the permeability keeps the same when the coarse fraction is increased (3/4” and 3/8”). • At 30 % +3/8” decrepitation almost double the fines fraction after the first leach cycle.
Conclusions (2/2) • When the coarser fractions are increased at 8% +3/4”, or 45 % the +3/8” fraction, decrepitation in the -200 M increases at average 50 %. • Decrepitation mostly occurs after the agglomeration and when the ore is stacked in the heap. • Finally, it is being observed that TCu recovery at 110 days in Lift 11, is 1. 75 % less tan the model, and the trend indicates that it will be getting closer at the end of the first Leach Cycle. • Actions to perform in the first Lifts (Vertical Wells, Vertical Gravel drains, etc).
Ladies and gentlemen Thank you very much for your attention