
Particle Analysis of Transmission Electron Microscopy Images NYCRI

- Slides: 9
Particle Analysis of Transmission Electron Microscopy Images NYCRI Student Researcher- Divya Krishna NASA Mentors- John Da. Ponte Ph. D. Thomas Sadowski Team Members – Monica Sawicki, Lisa Marinella, Paidemwoyo Munhutu
Nanotechnology [1] § 1 x 10 -9 meters (one billionth of a meter) § A Human Hair is about 80, 000 nanometers wide. § The nail on your little finger is about ten million nanometers across. § The material’s optical, electrical, mechanical, and chemical properties change at such minute sizes. § For Example - When aluminum is shrunk to about 20 – 30 nm it explodes thus making it ideal to add to rocket fuel. § Effects of Nanotechnology include § Stain-resistant nanopants made from fibers treated with fluorinated nanopolymer. § Spheres of silica, coated with a thin layer of gold and are about 120 nanometers, can infiltrate tumors when injected through a bloodstream. § Crude oil filter made from a white layer of zeolite nanocrystals that filters crude oil into diesel fuel.
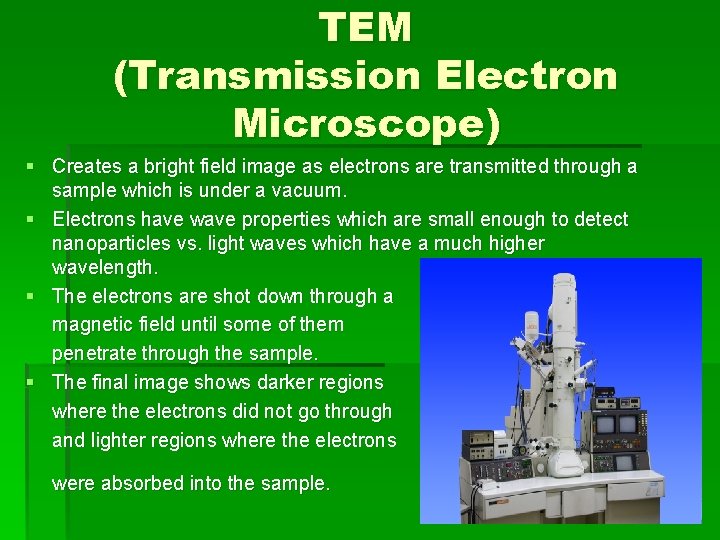
TEM (Transmission Electron Microscope) § Creates a bright field image as electrons are transmitted through a sample which is under a vacuum. § Electrons have wave properties which are small enough to detect nanoparticles vs. light waves which have a much higher wavelength. § The electrons are shot down through a magnetic field until some of them penetrate through the sample. § The final image shows darker regions where the electrons did not go through and lighter regions where the electrons were absorbed into the sample.
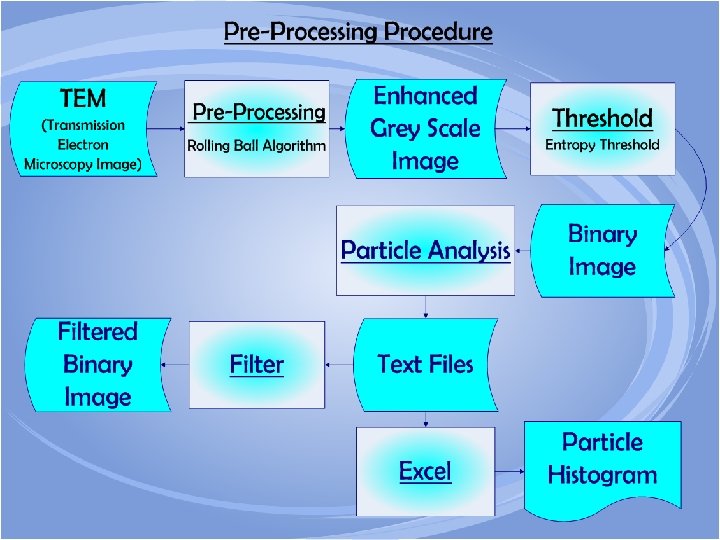
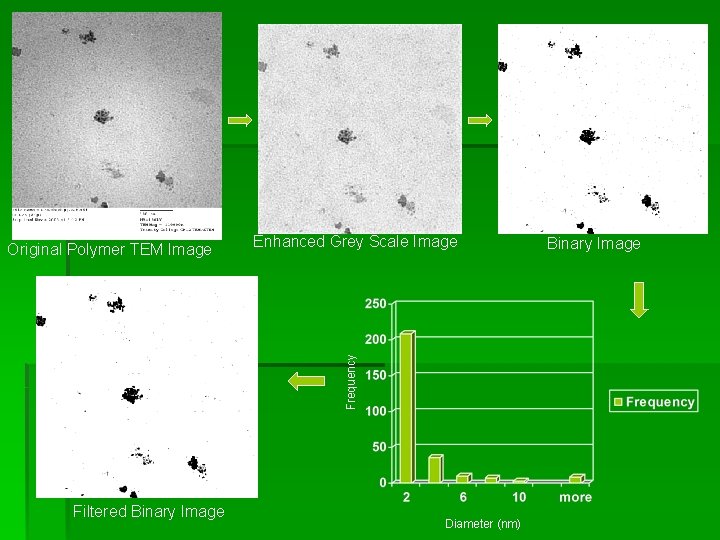
Project Overview § Platinum nanoparticle images were analyzed through an imaging software called Image. J [2] to find particle size and size distribution. § Several pre-processing techniques were experimented with including: § Rolling Ball Algorithm § Pseudo Flat Field Correction § Reasons for pre-processing include elimination of: § The Haloing effect § Excess amount of noise § Image contamination § Several thresholding algorithms were experimented with including: § Entropy Thresholding [3] § Kittler Thresholding [4] § Calvart-Riddler Thresholding [5] § Difficulties arising with the use of thresholding algorithms include: § Erosion of nanoparticles in binary image § Expansion of nanoparticles in binary image § Incorrect representation of original particle image
Enhanced Grey Scale Image Binary Image Frequency Original Monomer TEM Image Filtered Binary Image Diameter (nm)
Enhanced Grey Scale Image Frequency Original Polymer TEM Image Filtered Binary Image Diameter (nm) Binary Image
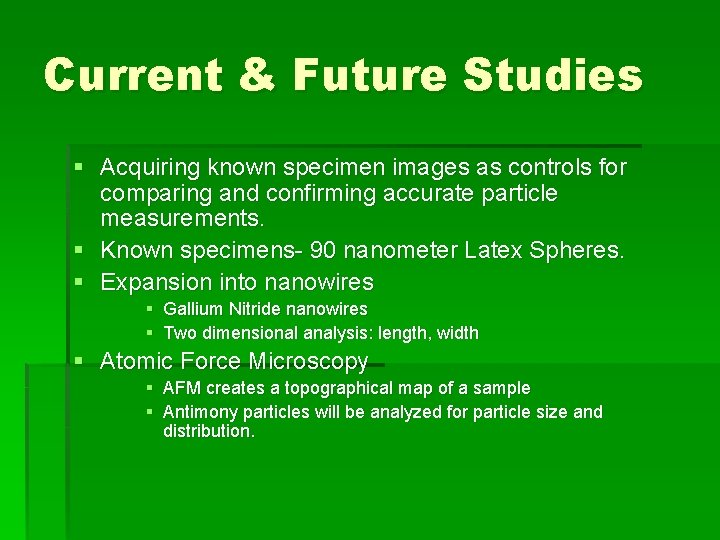
Current & Future Studies § Acquiring known specimen images as controls for comparing and confirming accurate particle measurements. § Known specimens- 90 nanometer Latex Spheres. § Expansion into nanowires § Gallium Nitride nanowires § Two dimensional analysis: length, width § Atomic Force Microscopy § AFM creates a topographical map of a sample § Antimony particles will be analyzed for particle size and distribution.
References 1. Kahn, Jennifer. “Nanotechnology” National Geographic, June, pages 100 -119, 2006. 2. Image. J - http: //rsb. info. nih. gov/ij/ 3. J. N. Kapur, P. K. Sahoo, and A. K. C. Wong, “A new method for gray-level picture thresholding using the entropy of the histogram, ” Graph. Models Image Process. 29, 273 -285 (1985) 4. J. Kittler and J. Illingworth, “On threshold selection using clustering criteria, ” IEEE Trans. Syst. Man Cybern. SMC-15, 652 -655 (1985) 5. T. W. Ridler and S. Calvard, “Picture thresholding using an iterative selction method, ” IEEE Trans. Syst. Man Cybern. SMC-8, 630 -632 (1978)