
PART III Growth Theory The Economy in the


- Slides: 63
PART III Growth Theory: The Economy in the Very Long Run Economic Growth I: Capital Accumulation and Population Growth Chapter 8 of Macroeconomics, 10 th edition, by N. Gregory Mankiw ECO 62 Udayan Roy
The Solow-Swan Model • This is a theory of macroeconomic dynamics • Using this theory, – you can predict where an economy will be tomorrow, the day after, and so on, if you know where it is today – you can predict the dynamic effects of changes in • the saving rate • the rate of population growth • and other factors
Two productive resources and one produced good • There are two productive resources: – Capital, K – Labor, L • These two productive resources are used to produce one – final good, Y
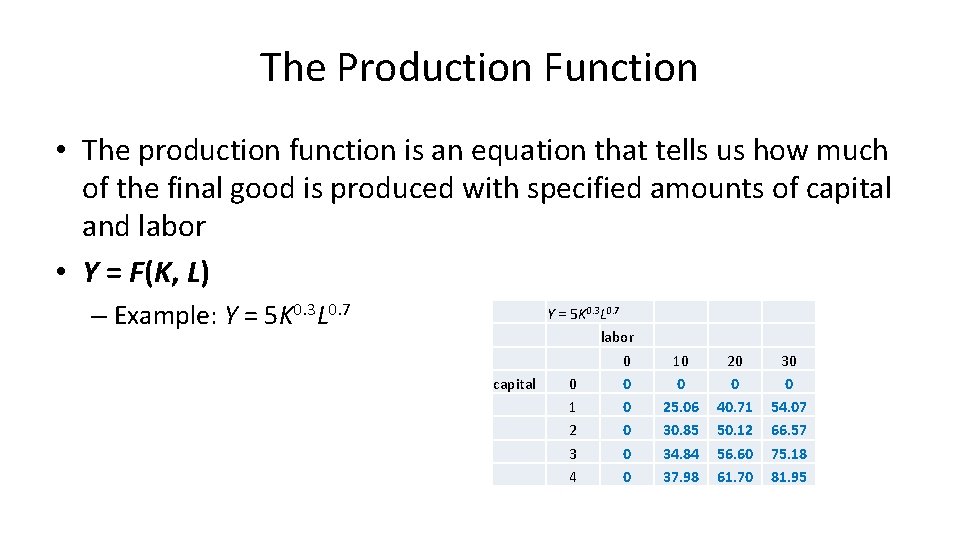
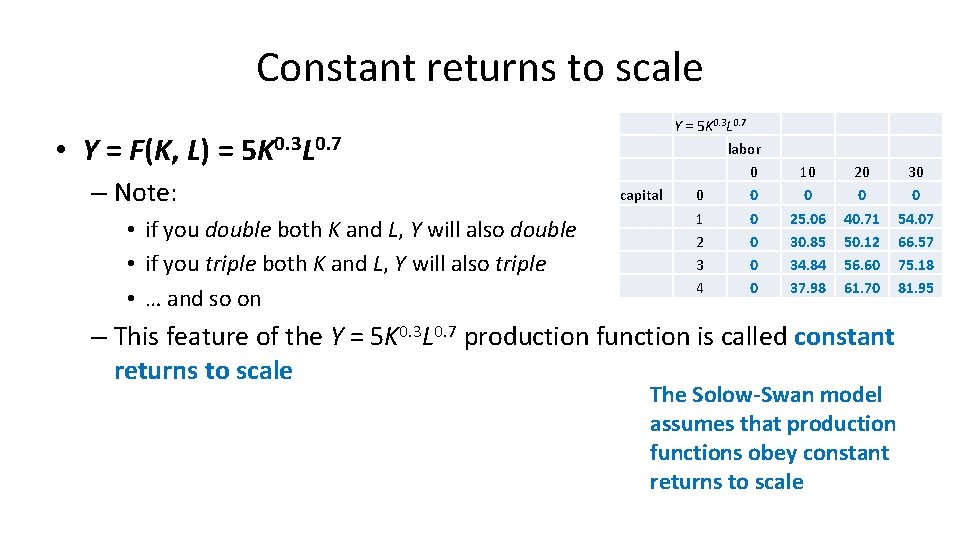
The Production Function • The production function is an equation that tells us how much of the final good is produced with specified amounts of capital and labor • Y = F(K, L) – Example: Y = 5 K 0. 3 L 0. 7 labor 0 capital 0 0 1 0 2 0 3 0 4 0 10 0 25. 06 30. 85 34. 84 37. 98 20 0 40. 71 50. 12 56. 60 61. 70 30 0 54. 07 66. 57 75. 18 81. 95
Constant returns to scale • Y = F(K, L) = 5 K 0. 3 L 0. 7 – Note: • if you double both K and L, Y will also double • if you triple both K and L, Y will also triple • … and so on Y = 5 K 0. 3 L 0. 7 labor 0 capital 0 0 1 0 2 0 3 0 4 0 10 0 25. 06 30. 85 34. 84 37. 98 20 0 40. 71 50. 12 56. 60 61. 70 – This feature of the Y = 5 K 0. 3 L 0. 7 production function is called constant returns to scale The Solow-Swan model assumes that production functions obey constant returns to scale 30 0 54. 07 66. 57 75. 18 81. 95
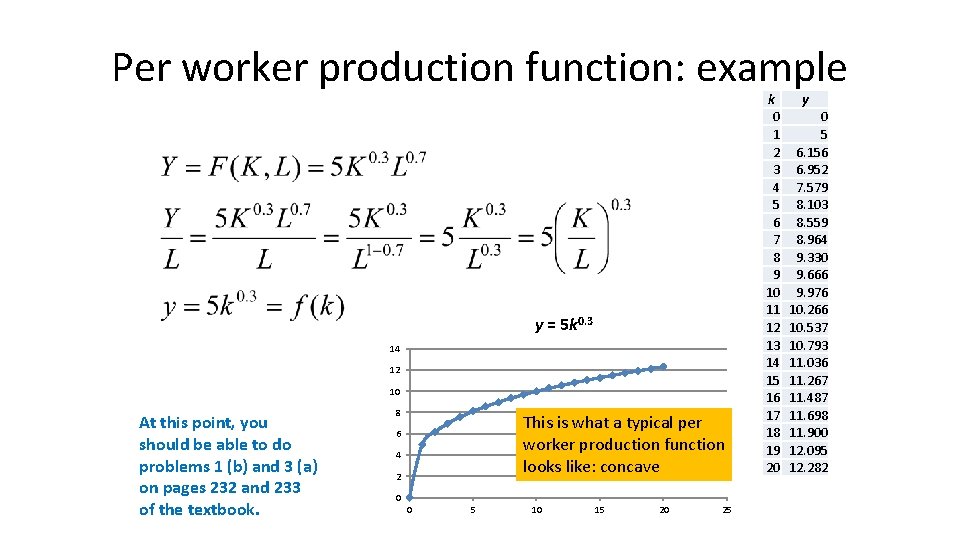
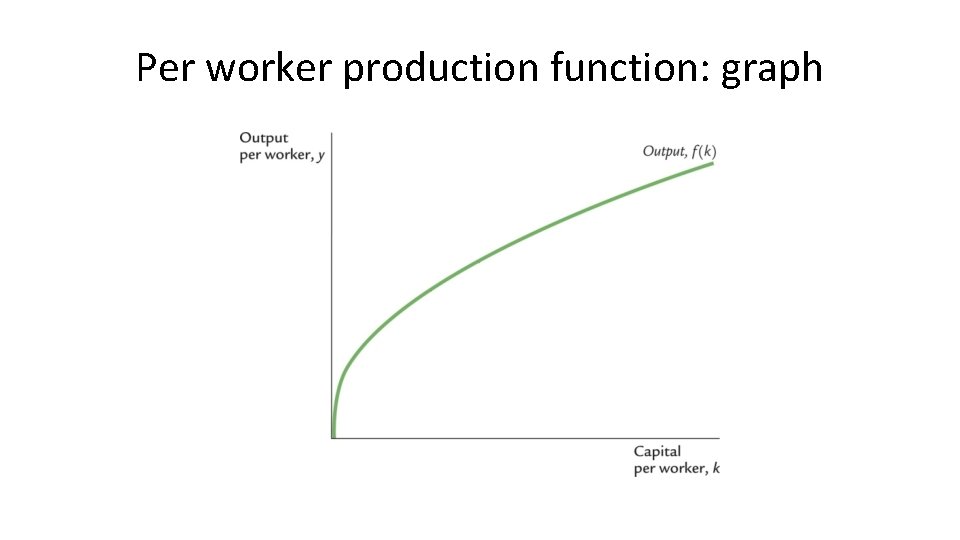
Per worker production function: example y = 5 k 0. 3 14 12 10 At this point, you should be able to do problems 1 (b) and 3 (a) on pages 232 and 233 of the textbook. 8 This is what a typical per worker production function looks like: concave 6 4 2 0 0 5 10 15 20 25 k 0 1 2 3 4 5 6 7 8 9 10 11 12 13 14 15 16 17 18 19 20 y 0 5 6. 156 6. 952 7. 579 8. 103 8. 559 8. 964 9. 330 9. 666 9. 976 10. 266 10. 537 10. 793 11. 036 11. 267 11. 487 11. 698 11. 900 12. 095 12. 282
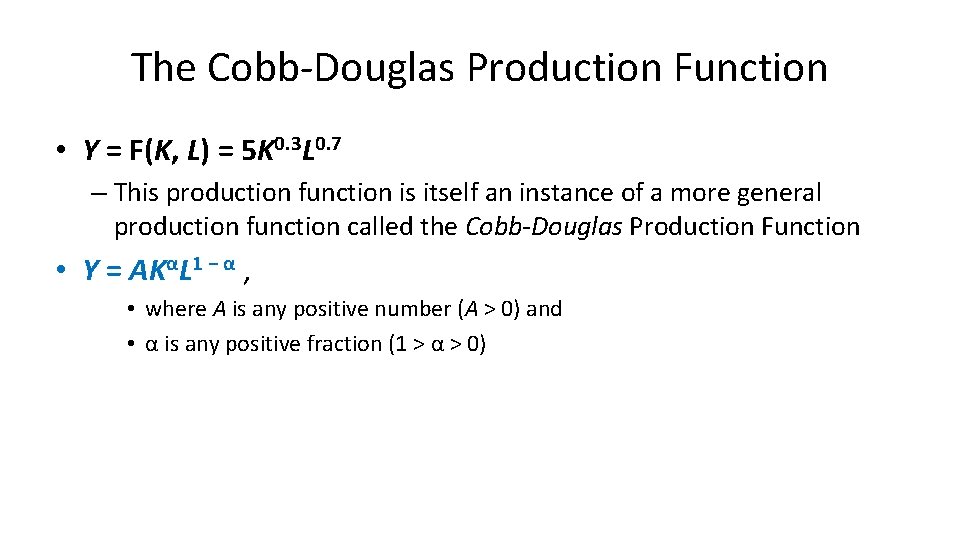
The Cobb-Douglas Production Function • Y = F(K, L) = 5 K 0. 3 L 0. 7 – This production function is itself an instance of a more general production function called the Cobb-Douglas Production Function • Y = AKαL 1 − α , • where A is any positive number (A > 0) and • α is any positive fraction (1 > α > 0)
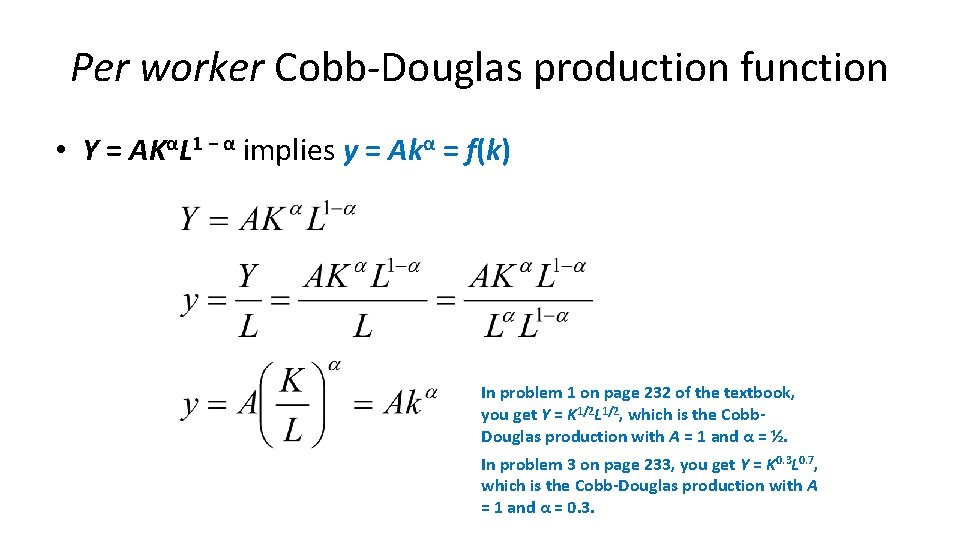
Per worker Cobb-Douglas production function • Y = AKαL 1 − α implies y = Akα = f(k) In problem 1 on page 232 of the textbook, you get Y = K 1/2 L 1/2, which is the Cobb. Douglas production with A = 1 and α = ½. In problem 3 on page 233, you get Y = K 0. 3 L 0. 7, which is the Cobb-Douglas production with A = 1 and α = 0. 3.
Per worker production function: graph
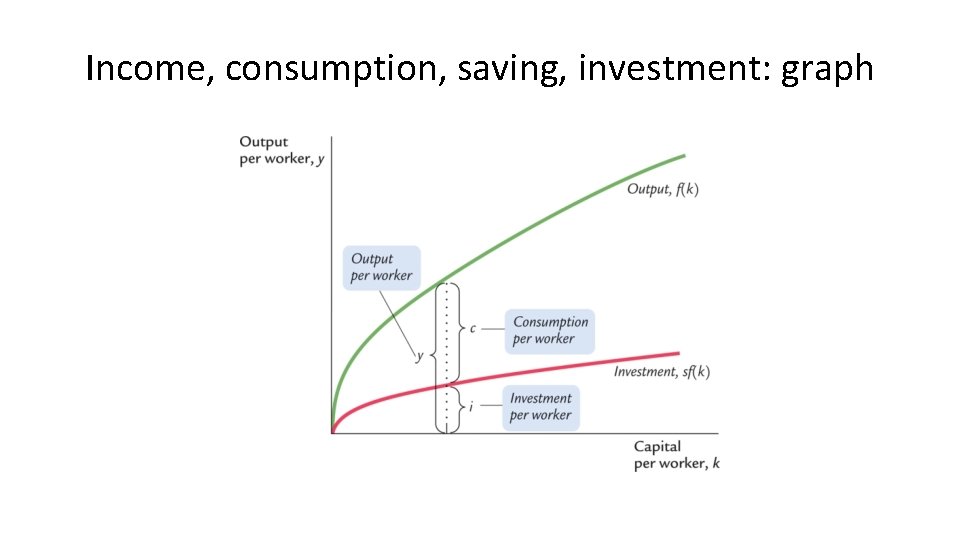
Income, consumption, saving, investment • Output = income • The Solow-Swan model assumes that each individual saves a constant fraction, s, of his or her income • Therefore, saving per worker = sy = sf(k) • This saving becomes an addition to the existing capital stock • Consumption per worker is denoted c = y – sy = (1 – s)y
Income, consumption, saving, investment: graph
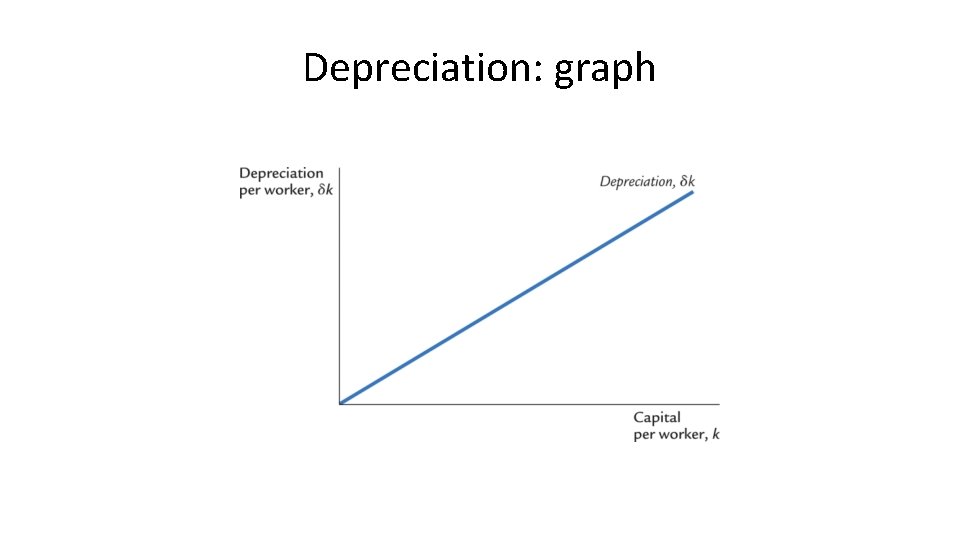
Depreciation • But part of the existing capital stock wears out • This is called depreciation • The Solow-Swan model assumes that a constant fraction, δ, of the existing capital stock wears out in every period • That is, an individual who currently has k units of capital will lose δk units of capital though depreciation (or, wear and tear)
Depreciation • Although 0 < δ < 1 is the fraction of existing capital that wears out every period, in some cases—as in problem 1 (c) on page 219 of the textbook—depreciation is expressed as a percentage. • In such cases, care must be taken to convert the percentage value to a fraction – For example, if depreciation is given as 5 percent, you need to set δ = 5/100 = 0. 05
Depreciation: graph
DYNAMICS
Dynamics: what time is it? • We’ll attach a subscript to each variable to denote what date we’re talking about • For example, kt will denote the economy’s per worker stock of capital on date t and kt+1 will denote the per worker stock of capital on date t + 1
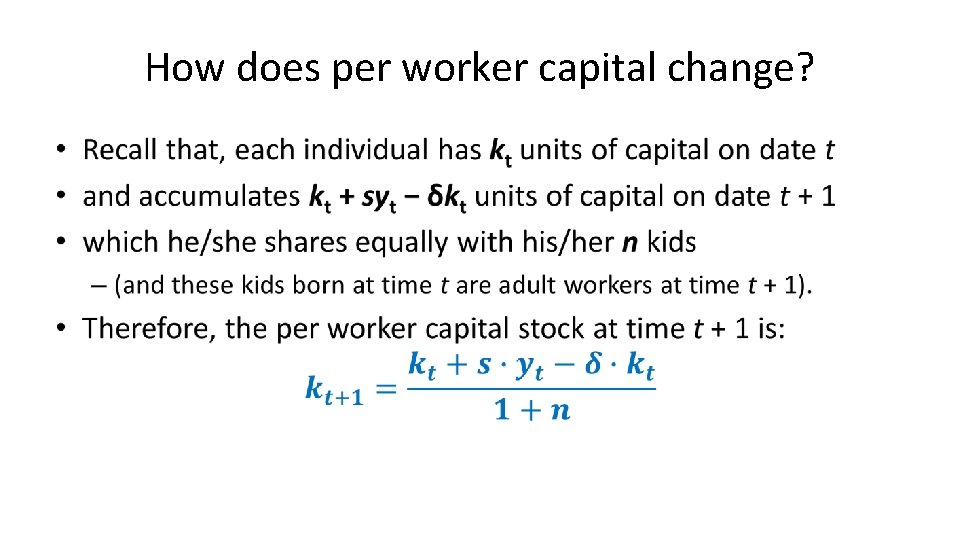
How does per worker capital change? A worker has kt units of capital on date t He or she adds syt units of capital through saving and loses δkt units of capital through depreciation So, each worker accumulates kt + syt − δkt units of capital on date t + 1 • Does this mean kt+1 = kt + syt − δkt? • Not quite! • •
Population Growth • The Solow-Swan model assumes that each individual has n kids in each period • The kids become adult workers in the period immediately after they are born – and, like every other worker, have n kids of their own – and so on
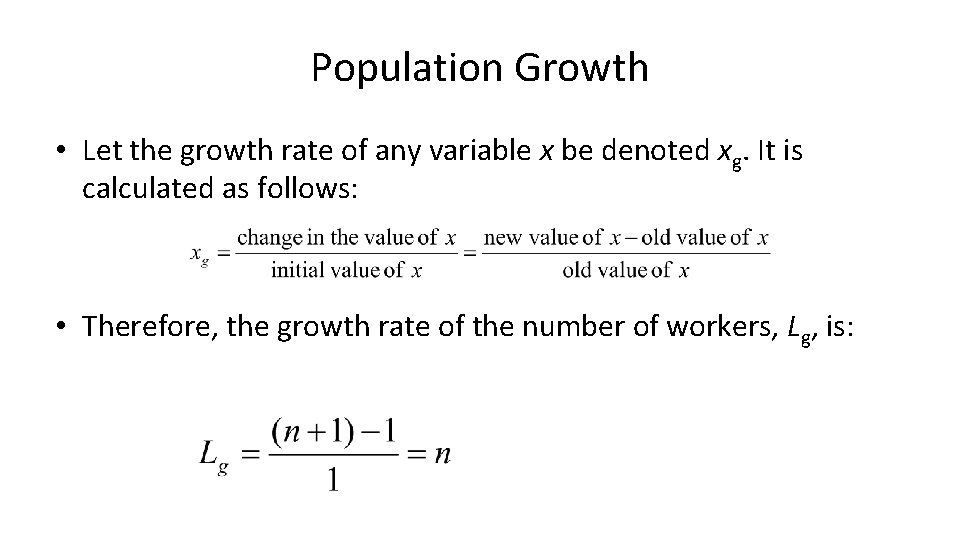
Population Growth • Let the growth rate of any variable x be denoted xg. It is calculated as follows: • Therefore, the growth rate of the number of workers, Lg, is:
How does per worker capital change? •
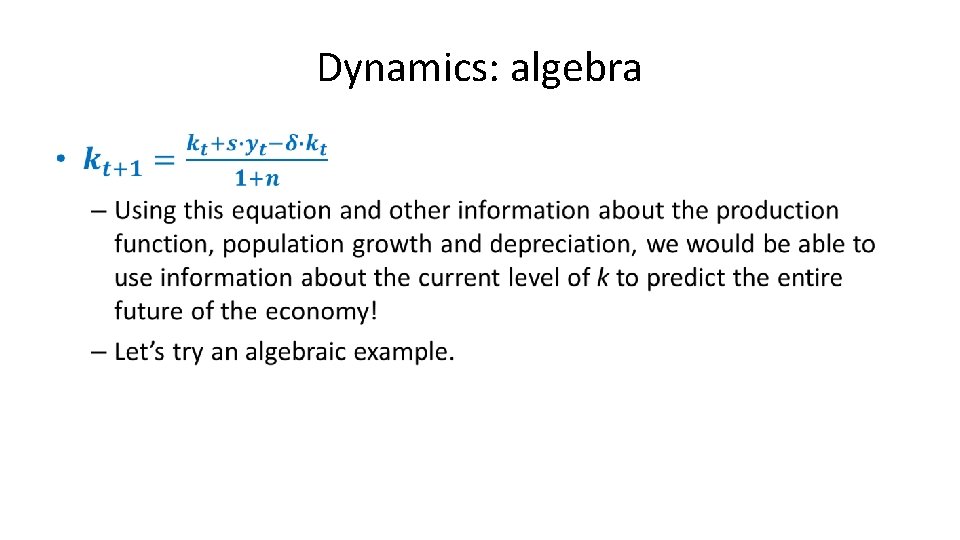
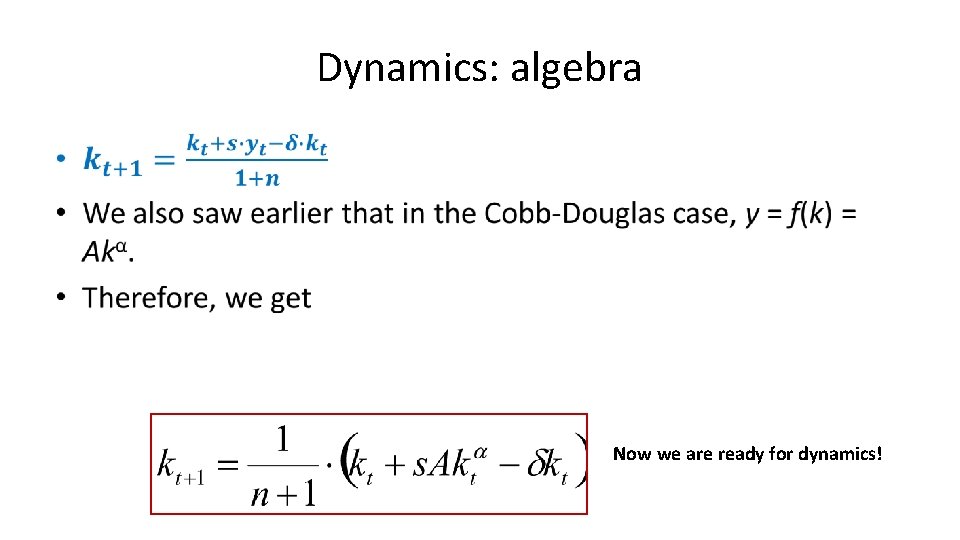
Dynamics: algebra •
Dynamics: algebra • Now we are ready for dynamics!
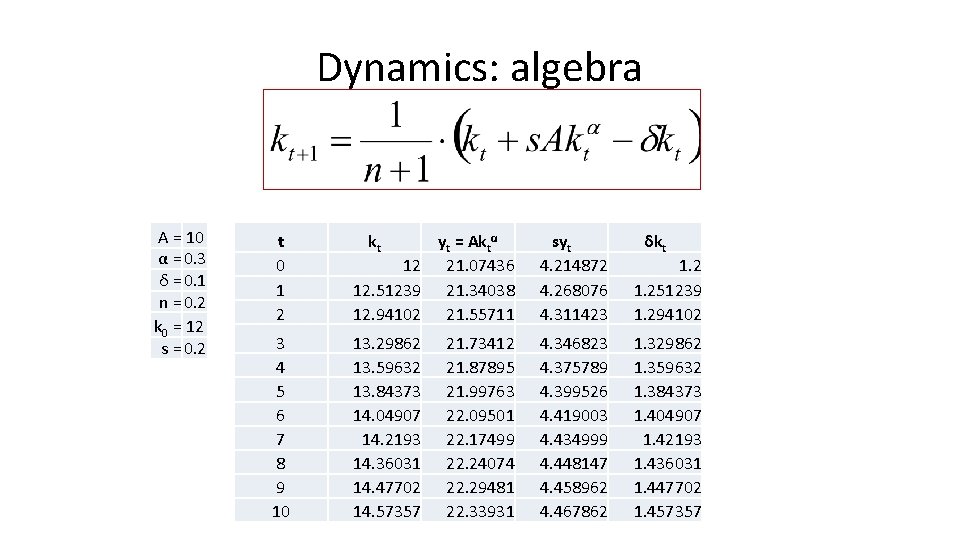
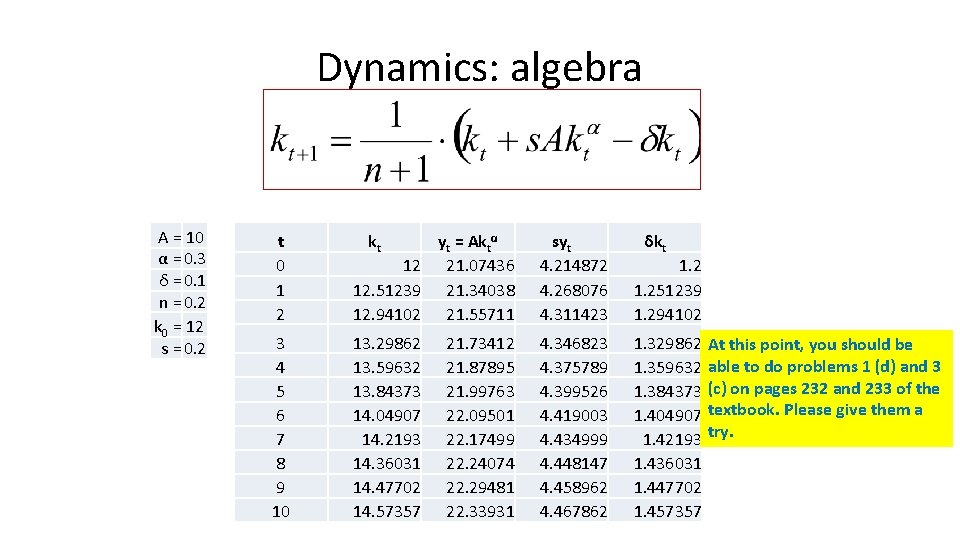
Dynamics: algebra A = 10 α = 0. 3 δ = 0. 1 n = 0. 2 k 0 = 12 s = 0. 2 t 0 1 2 kt yt = Aktα 12 21. 07436 12. 51239 21. 34038 12. 94102 21. 55711 syt 4. 214872 4. 268076 4. 311423 1. 251239 1. 294102 3 4 5 6 7 8 9 10 13. 29862 13. 59632 13. 84373 14. 04907 14. 2193 14. 36031 14. 47702 14. 57357 4. 346823 4. 375789 4. 399526 4. 419003 4. 434999 4. 448147 4. 458962 4. 467862 1. 329862 1. 359632 1. 384373 1. 404907 1. 42193 1. 436031 1. 447702 1. 457357 21. 73412 21. 87895 21. 99763 22. 09501 22. 17499 22. 24074 22. 29481 22. 33931 δkt
Dynamics: algebra A = 10 α = 0. 3 δ = 0. 1 n = 0. 2 k 0 = 12 s = 0. 2 t 0 1 2 kt yt = Aktα 12 21. 07436 12. 51239 21. 34038 12. 94102 21. 55711 syt 4. 214872 4. 268076 4. 311423 1. 251239 1. 294102 3 4 5 6 7 8 9 10 13. 29862 13. 59632 13. 84373 14. 04907 14. 2193 14. 36031 14. 47702 14. 57357 4. 346823 4. 375789 4. 399526 4. 419003 4. 434999 4. 448147 4. 458962 4. 467862 1. 329862 1. 359632 1. 384373 1. 404907 1. 42193 1. 436031 1. 447702 1. 457357 21. 73412 21. 87895 21. 99763 22. 09501 22. 17499 22. 24074 22. 29481 22. 33931 δkt At this point, you should be able to do problems 1 (d) and 3 (c) on pages 232 and 233 of the textbook. Please give them a try.
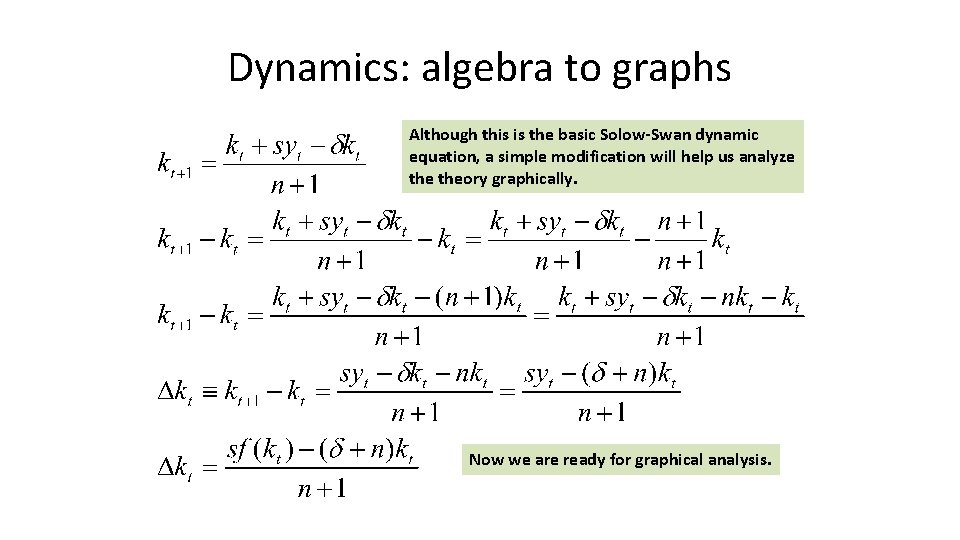
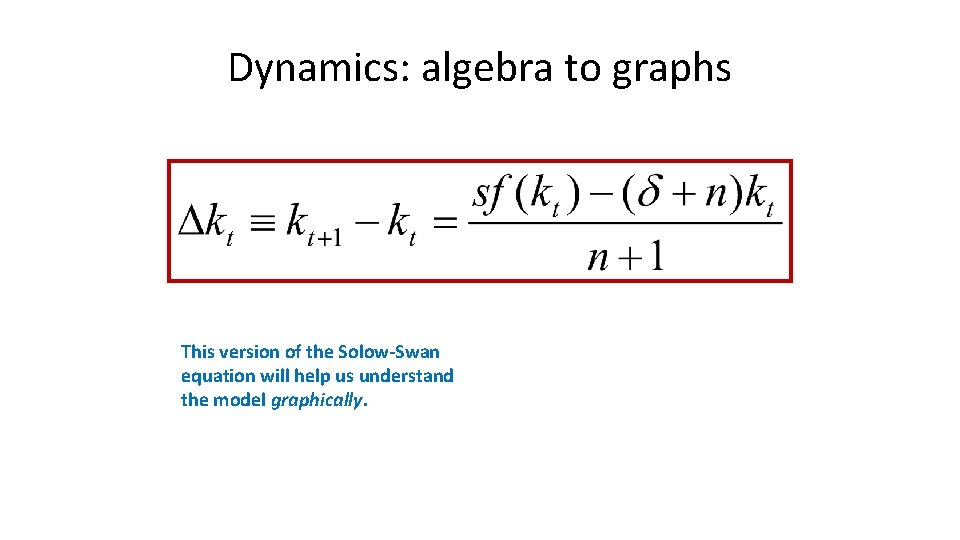
Dynamics: algebra to graphs Although this is the basic Solow-Swan dynamic equation, a simple modification will help us analyze theory graphically. Now we are ready for graphical analysis.
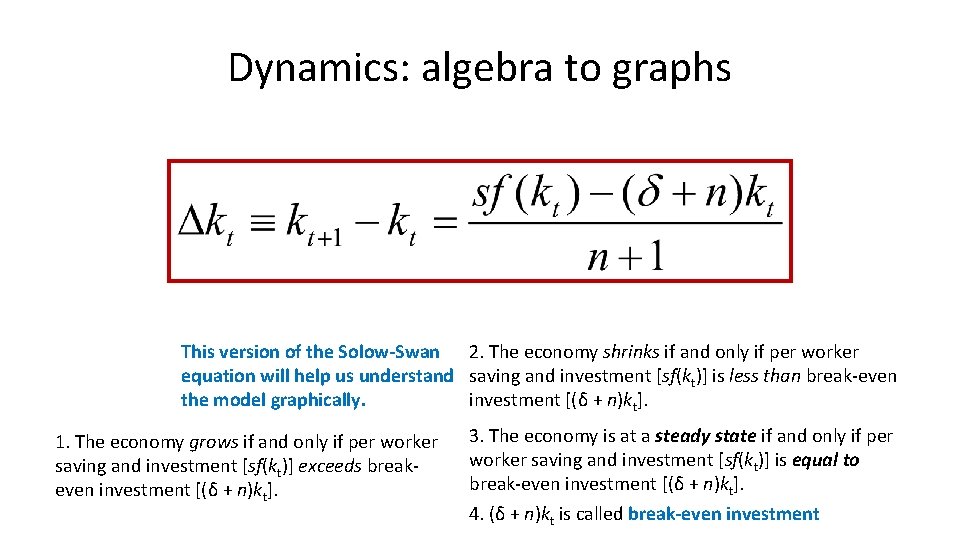
Dynamics: algebra to graphs This version of the Solow-Swan equation will help us understand the model graphically.
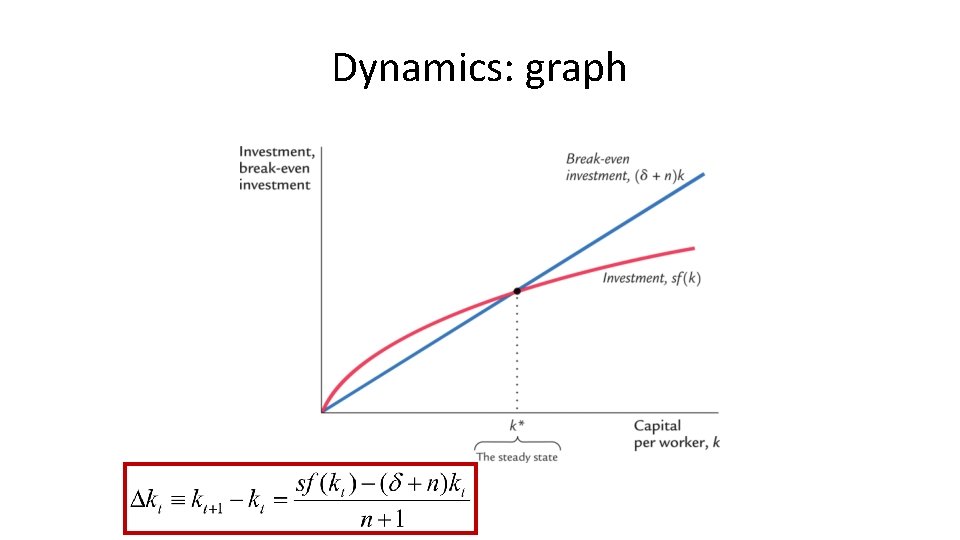
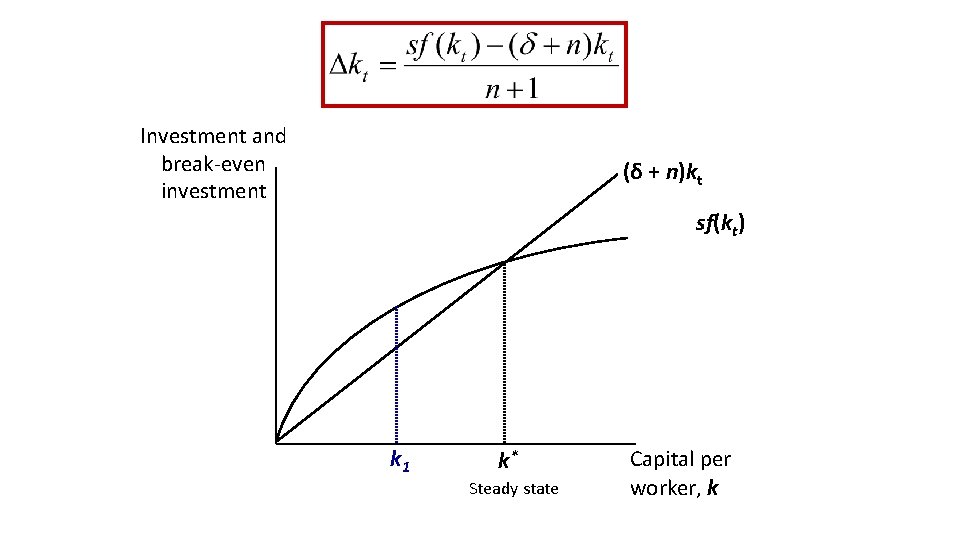
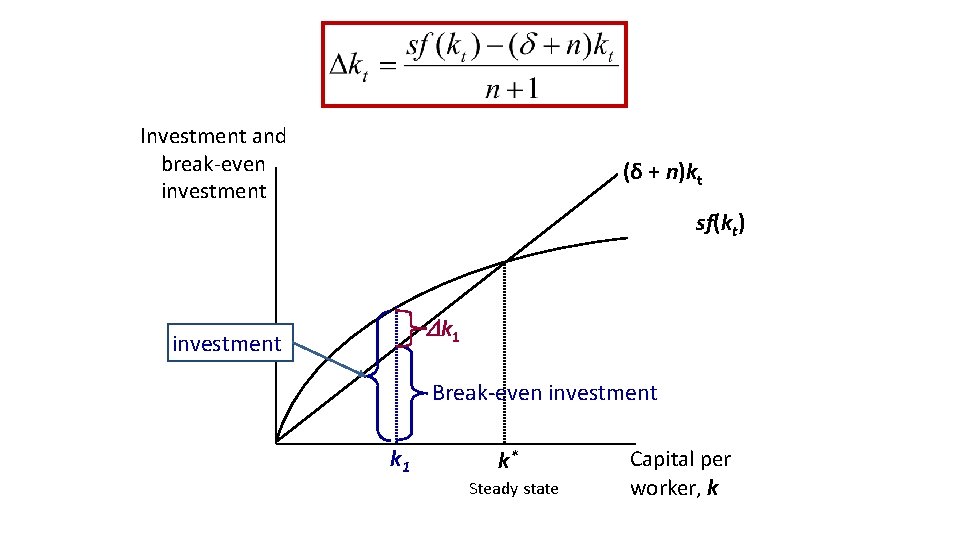
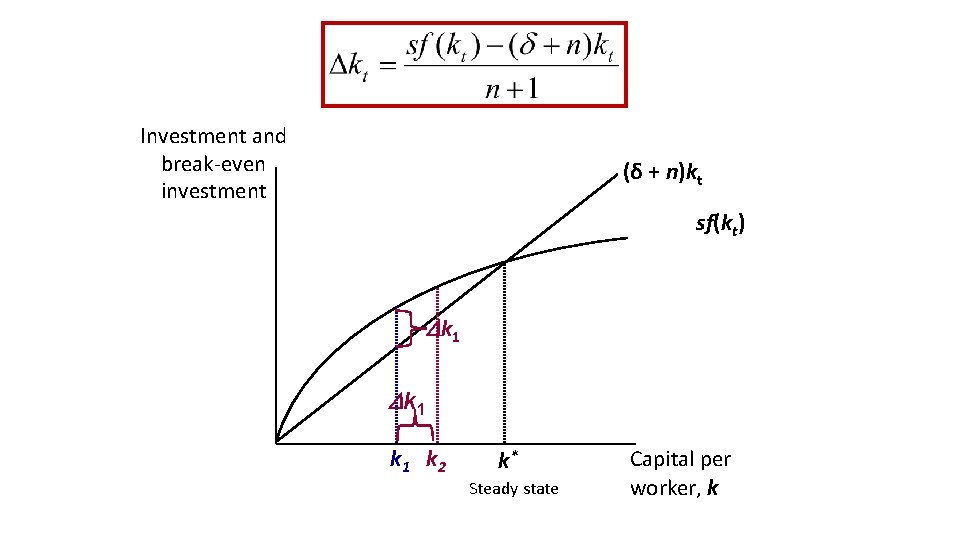
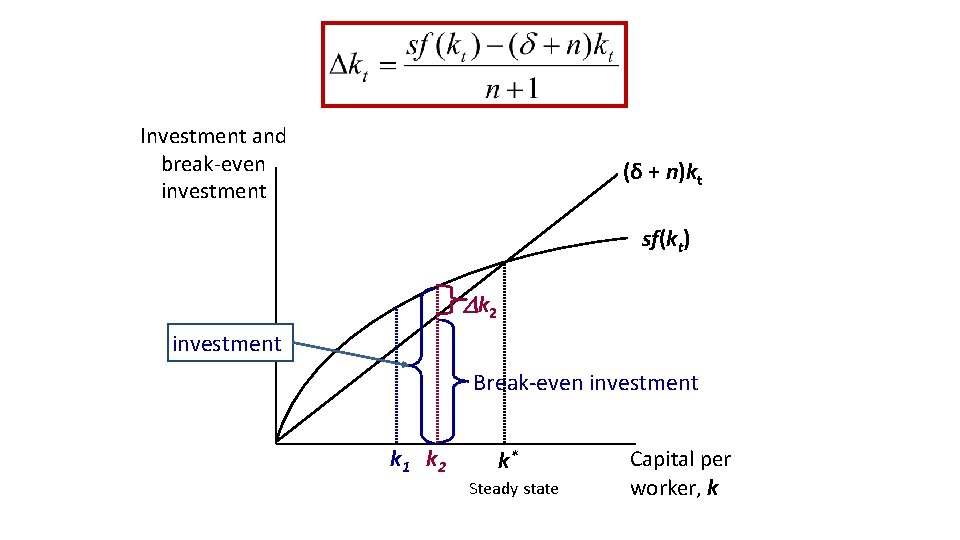
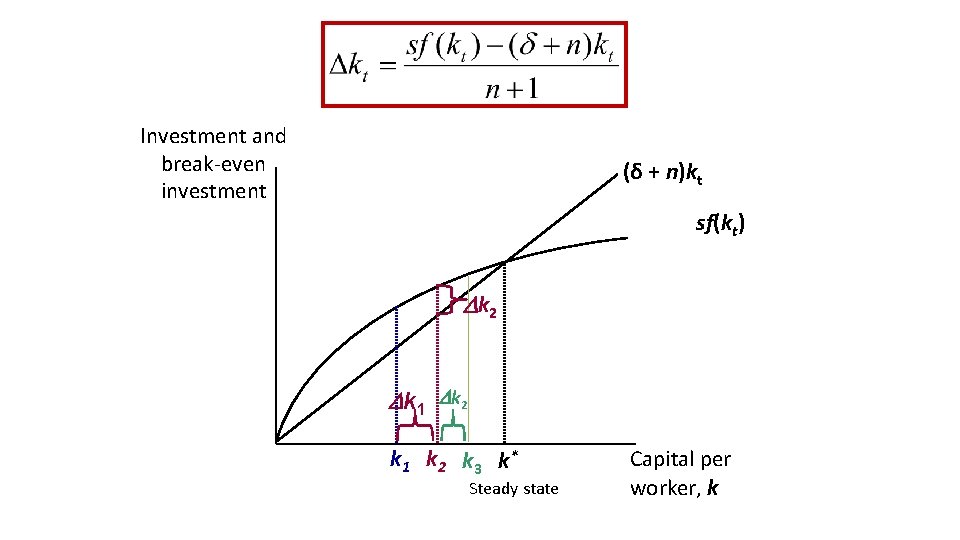
Dynamics: algebra to graphs This version of the Solow-Swan 2. The economy shrinks if and only if per worker equation will help us understand saving and investment [sf(kt)] is less than break-even the model graphically. investment [(δ + n)kt]. 1. The economy grows if and only if per worker saving and investment [sf(kt)] exceeds breakeven investment [(δ + n)kt]. 3. The economy is at a steady state if and only if per worker saving and investment [sf(kt)] is equal to break-even investment [(δ + n)kt]. 4. (δ + n)kt is called break-even investment
Dynamics: graph
Investment and break-even investment (δ + n)kt sf(kt) k 1 k * Steady state Capital per worker, k
Investment and break-even investment (δ + n)kt sf(kt) k 1 investment Break-even investment k 1 k * Steady state Capital per worker, k
Investment and break-even investment (δ + n)kt sf(kt) k 1 k 1 k 2 k * Steady state Capital per worker, k
Investment and break-even investment (δ + n)kt sf(kt) k 2 investment Break-even investment k 1 k 2 k * Steady state Capital per worker, k
Investment and break-even investment (δ + n)kt sf(kt) k 2 k 1 k 2 k 1 k 2 k 3 k * Steady state Capital per worker, k
STEADY STATE: ALGEBRA
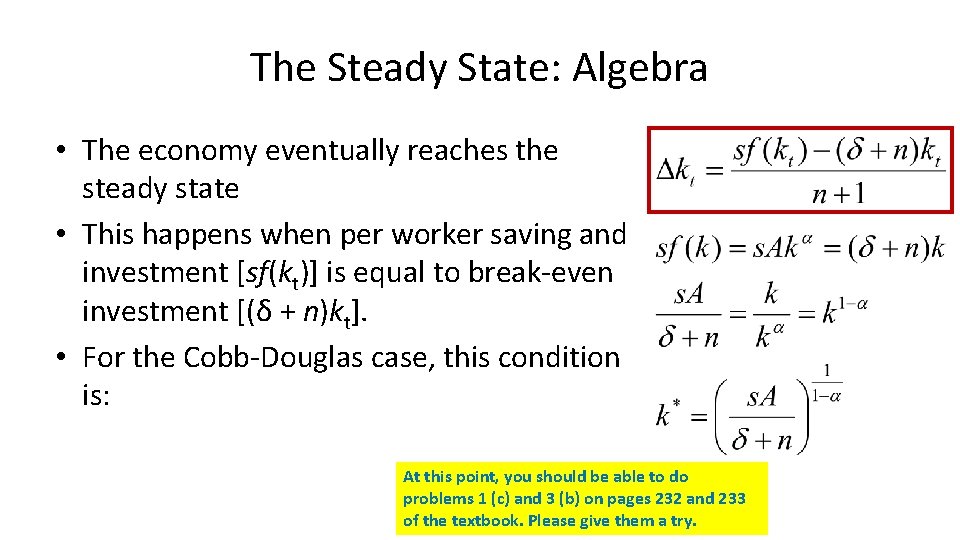
The Steady State: Algebra • The economy eventually reaches the steady state • This happens when per worker saving and investment [sf(kt)] is equal to break-even investment [(δ + n)kt]. • For the Cobb-Douglas case, this condition is: At this point, you should be able to do problems 1 (c) and 3 (b) on pages 232 and 233 of the textbook. Please give them a try.
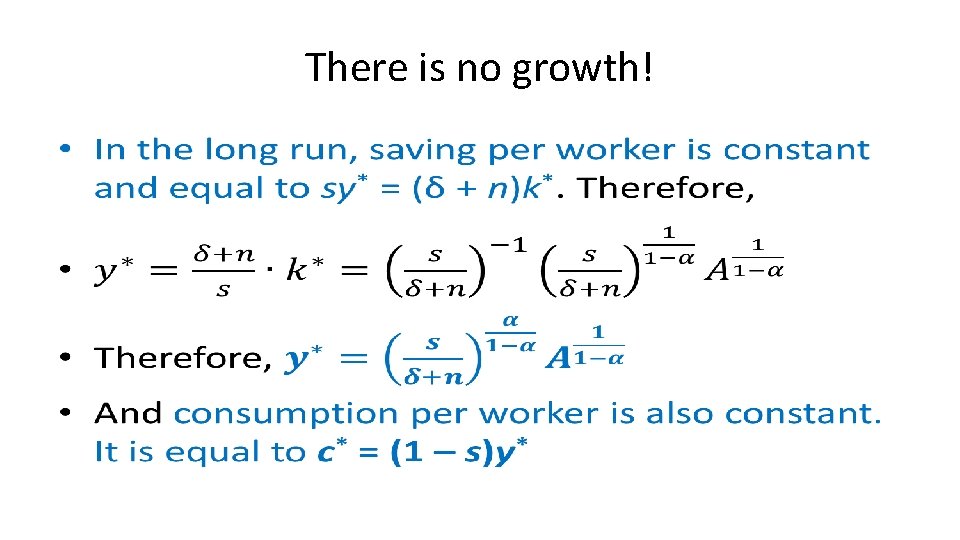
There is no growth! •
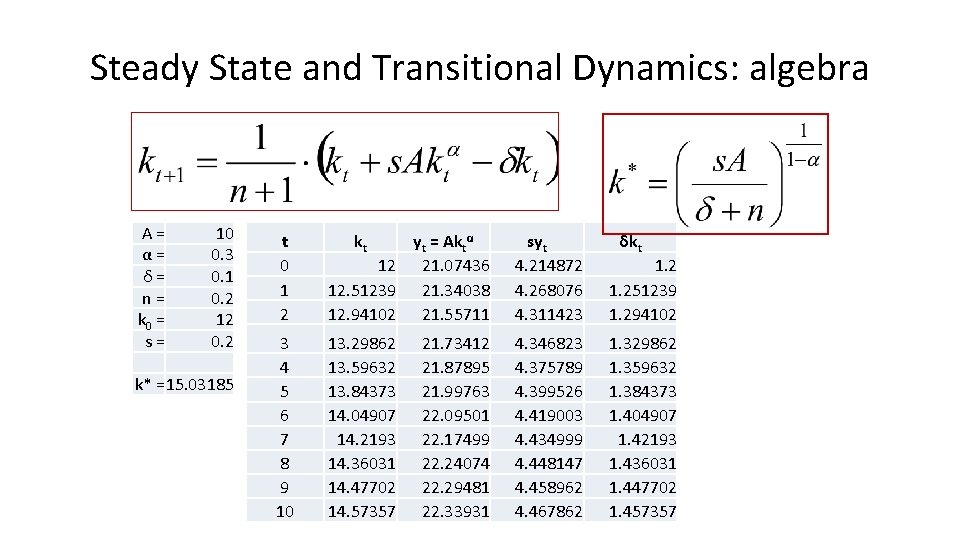
Steady State and Transitional Dynamics: algebra A = α = δ = n = k 0 = s = 10 0. 3 0. 1 0. 2 12 0. 2 k* =15. 03185 t 0 1 2 kt yt = Aktα 12 21. 07436 12. 51239 21. 34038 12. 94102 21. 55711 syt 4. 214872 4. 268076 4. 311423 1. 251239 1. 294102 3 4 5 6 7 8 9 10 13. 29862 13. 59632 13. 84373 14. 04907 14. 2193 14. 36031 14. 47702 14. 57357 4. 346823 4. 375789 4. 399526 4. 419003 4. 434999 4. 448147 4. 458962 4. 467862 1. 329862 1. 359632 1. 384373 1. 404907 1. 42193 1. 436031 1. 447702 1. 457357 21. 73412 21. 87895 21. 99763 22. 09501 22. 17499 22. 24074 22. 29481 22. 33931 δkt
SOLOW-SWAN PREDICTIONS FOR THE STEADY STATE
There is no growth! • The Solow-Swan model predicts that – Every economy will end up at the steady-state; in the long run, the growth rate is zero! • That is, k = k* and y = f(k*) = y* – Growth is possible—temporarily!—only if the economy’s per worker stock of capital is less than the steady state per worker stock of capital (k < k*) • If k < k*, the smaller the value of k, the faster the growth of k and y
There is no growth! • • • So, in the long run: Capital per worker, k = k*, is constant Output per worker, y = f(k*) = y*, is constant Saving per worker, sy*, is constant Consumption per worker, c* = y* – sy* = (1 – s)y*, is also constant.
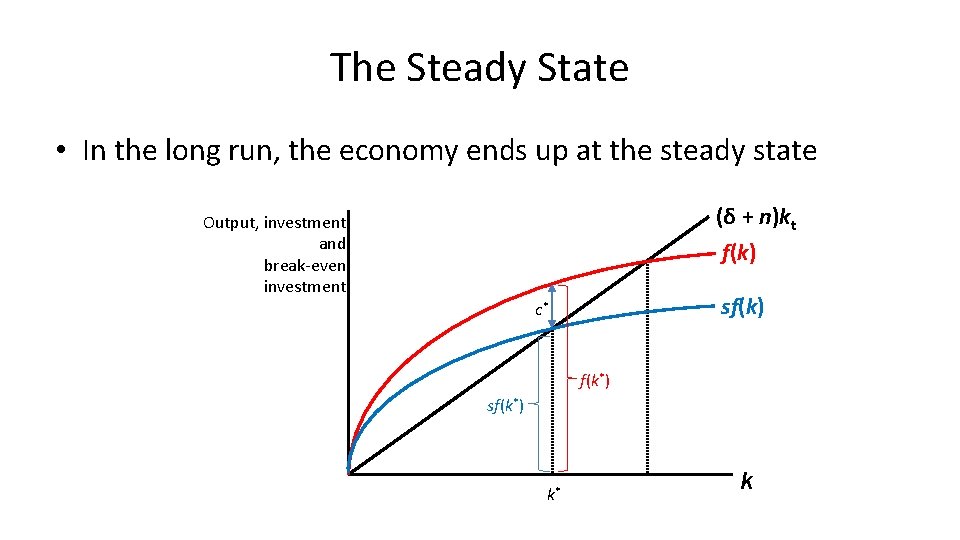
The Steady State • In the long run, the economy ends up at the steady state (δ + n)kt f(k) Output, investment and break-even investment sf(k) c* f(k*) sf(k*) k* k
What might be the long-run consequences of: The destruction of physical capital (perhaps by war or natural disaster) An increase in the saving rate An increase in the rate of population growth SOLOW-SWAN PREDICTIONS FOR CHANGES TO THE STEADY STATE
A sudden fall in capital per worker • A sudden decrease in k could be caused by: – Earthquake or war that destroys capital but not people – Immigration – A decrease in u • What does the Solow-Swan model say will be the result of this?
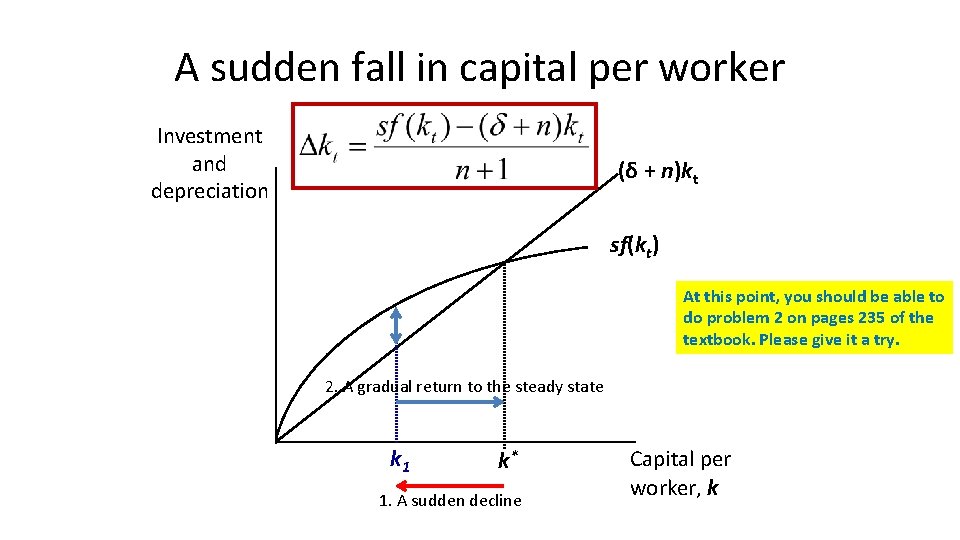
A sudden fall in capital per worker Investment and depreciation (δ + n)kt sf(kt) At this point, you should be able to do problem 2 on pages 235 of the textbook. Please give it a try. 2. A gradual return to the steady state k 1 k * 1. A sudden decline Capital per worker, k
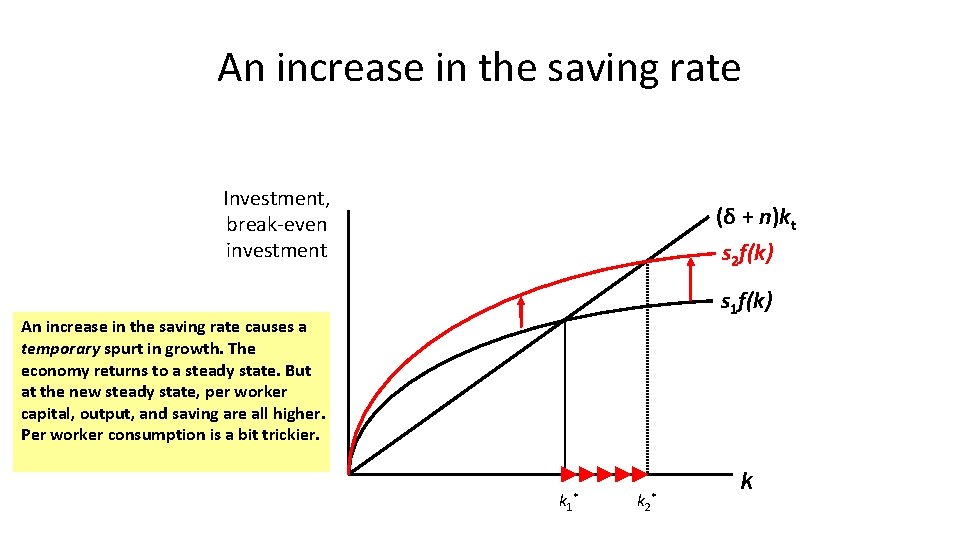
An increase in the saving rate Investment, break-even investment (δ + n)kt s 2 f(k) s 1 f(k) An increase in the saving rate causes a temporary spurt in growth. The economy returns to a steady state. But at the new steady state, per worker capital, output, and saving are all higher. Per worker consumption is a bit trickier. k 1* k 2* k
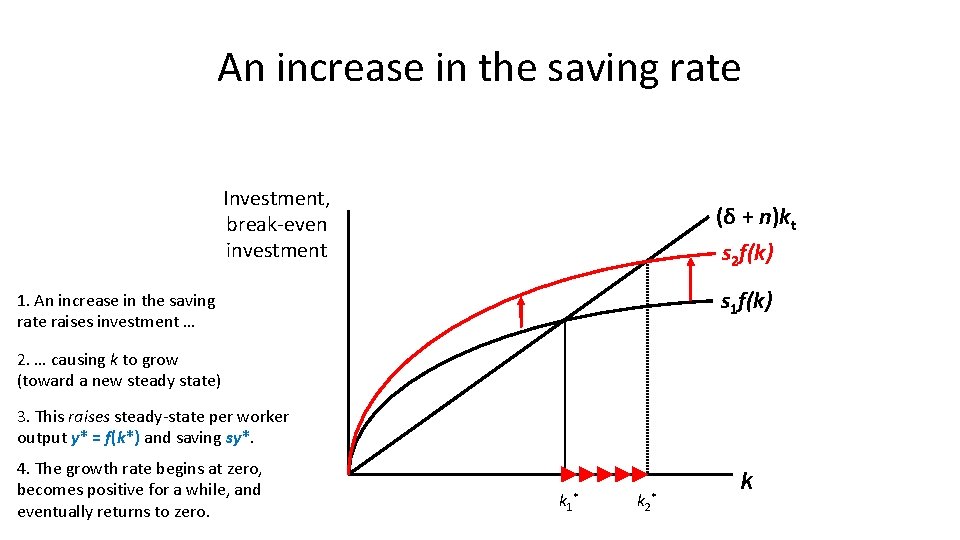
An increase in the saving rate Investment, break-even investment (δ + n)kt s 2 f(k) s 1 f(k) 1. An increase in the saving rate raises investment … 2. … causing k to grow (toward a new steady state) 3. This raises steady-state per worker output y* = f(k*) and saving sy*. 4. The growth rate begins at zero, becomes positive for a while, and eventually returns to zero. k 1* k 2* k
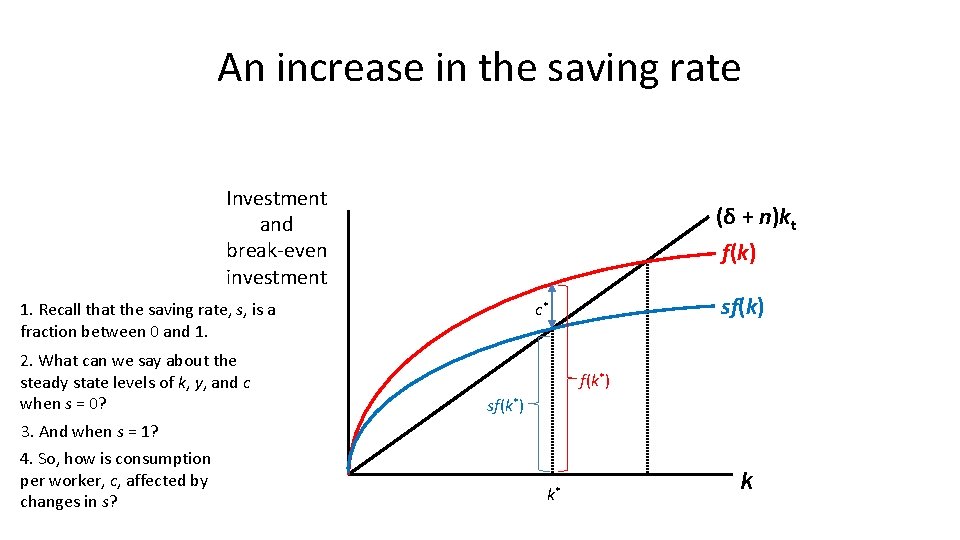
An increase in the saving rate Investment and break-even investment (δ + n)kt f(k) 1. Recall that the saving rate, s, is a fraction between 0 and 1. 2. What can we say about the steady state levels of k, y, and c when s = 0? sf(k) c* f(k*) sf(k*) 3. And when s = 1? 4. So, how is consumption per worker, c, affected by changes in s? k* k
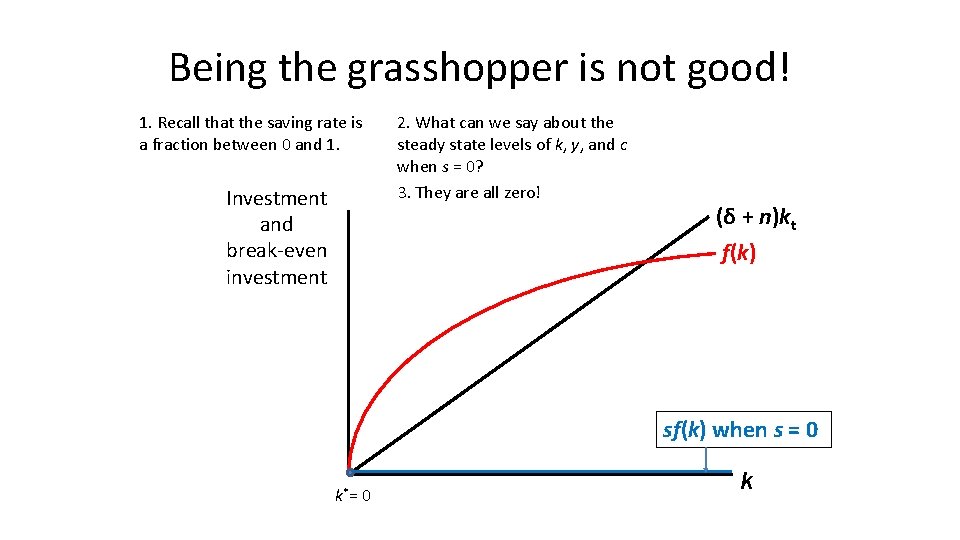
Being the grasshopper is not good! 1. Recall that the saving rate is a fraction between 0 and 1. Investment and break-even investment 2. What can we say about the steady state levels of k, y, and c when s = 0? 3. They are all zero! (δ + n)kt f(k) sf(k) when s = 0 k*= 0 k
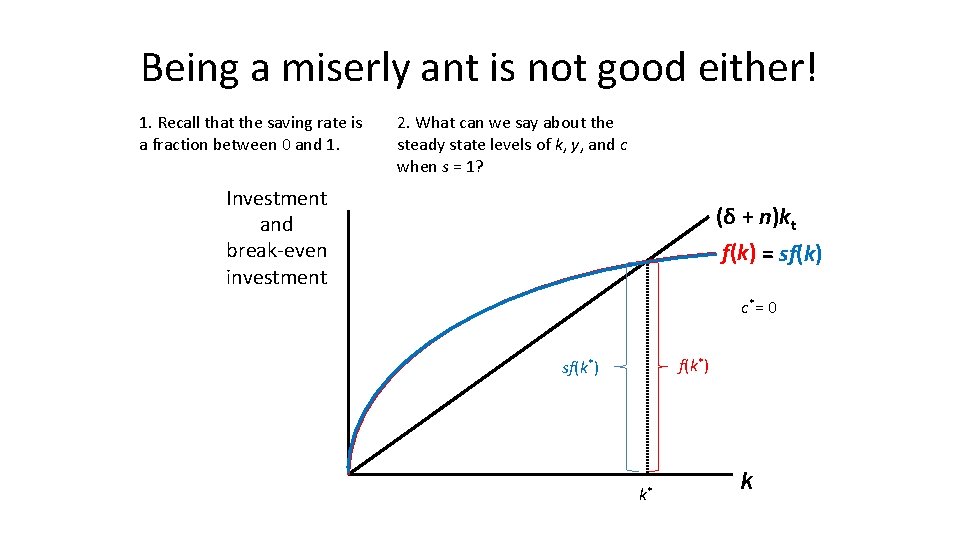
Being a miserly ant is not good either! 1. Recall that the saving rate is a fraction between 0 and 1. 2. What can we say about the steady state levels of k, y, and c when s = 1? Investment and break-even investment (δ + n)kt f(k) = sf(k) c*= 0 f(k*) sf(k*) k* k
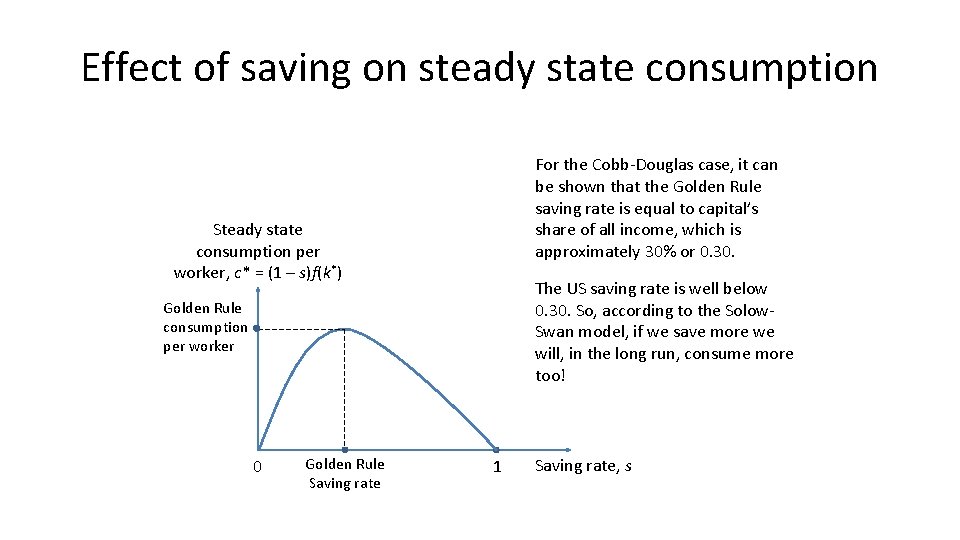
Effect of saving on steady state consumption For the Cobb-Douglas case, it can be shown that the Golden Rule saving rate is equal to capital’s share of all income, which is approximately 30% or 0. 30. Steady state consumption per worker, c* = (1 – s)f(k*) The US saving rate is well below 0. 30. So, according to the Solow. Swan model, if we save more we will, in the long run, consume more too! Golden Rule consumption per worker 0 Golden Rule Saving rate 1 Saving rate, s
What do we get for thrift? • In the long run, a higher rate of saving and investment gives us – A higher per worker income – But not a faster rate of growth • And consumption per worker, c* = (1 – s)y*, may increase or decrease or stay unchanged when s increases. At this point, you should be able to do problem 4 on page 233 of the textbook. Please try it.
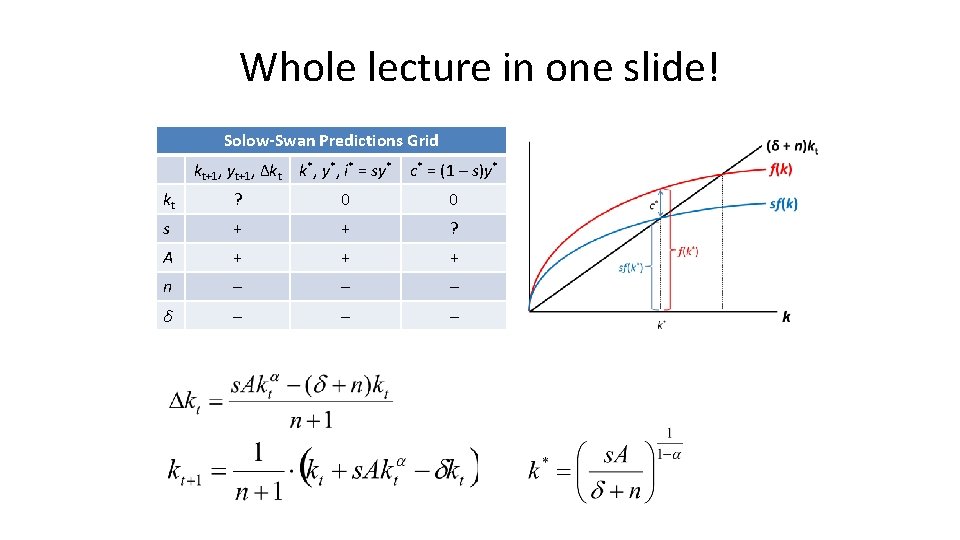
Whole lecture in one slide! Solow-Swan Predictions Grid kt+1, yt+1, Δkt k*, y*, i* = sy* c* = (1 – s)y* kt ? 0 0 s + + ? A + + + n – – – δ – – –
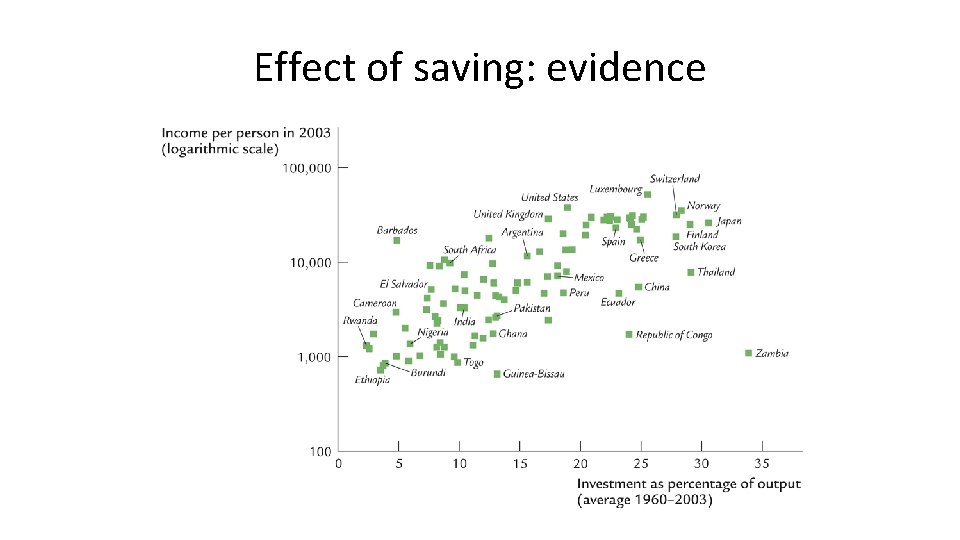
Effect of saving: evidence
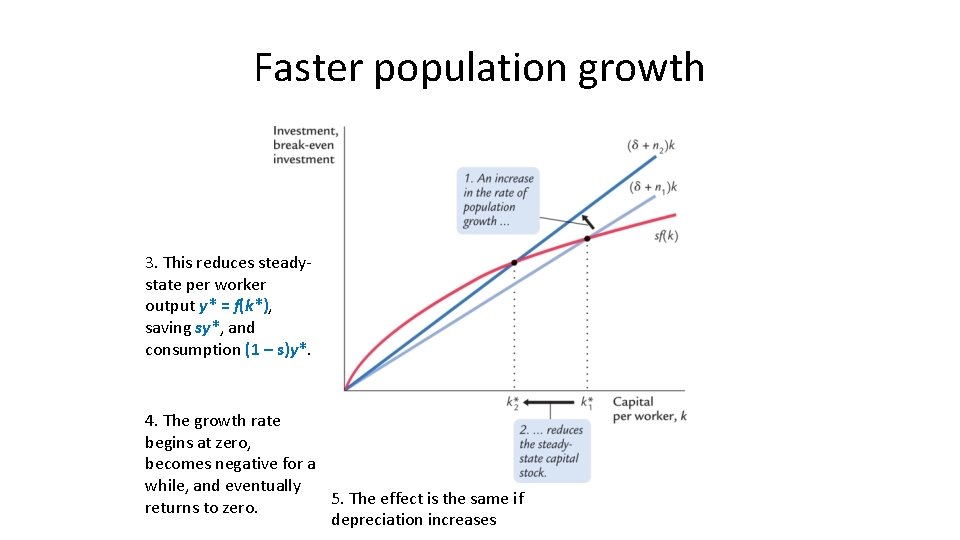
Faster population growth 3. This reduces steadystate per worker output y* = f(k*), saving sy*, and consumption (1 – s)y*. 4. The growth rate begins at zero, becomes negative for a while, and eventually 5. The effect is the same if returns to zero. depreciation increases
What do we get for having fewer kids? • In the long run, a lower rate of population growth gives us – A higher per worker income – But not a faster rate of growth At this point, you should be able to do problem 6 on page 233 of the textbook. Please try it.
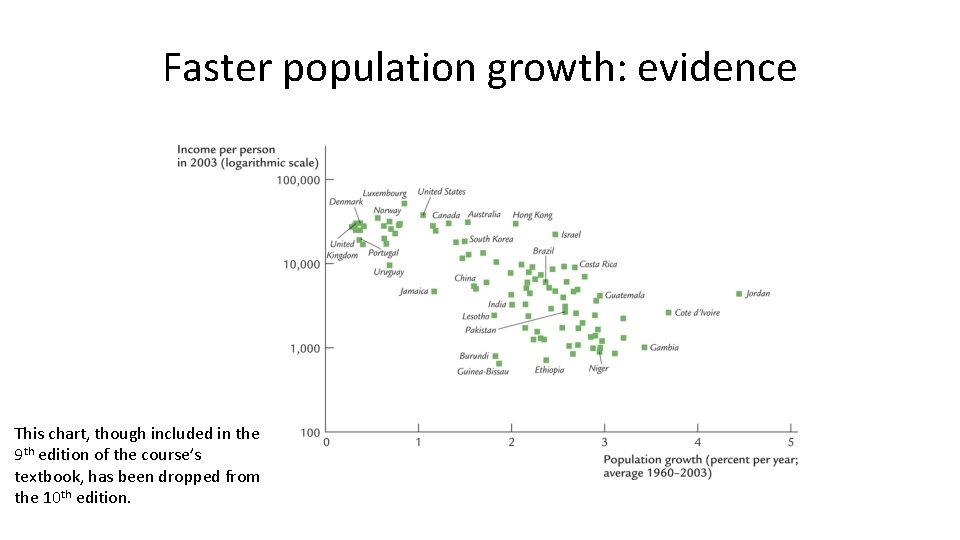
Faster population growth: evidence This chart, though included in the 9 th edition of the course’s textbook, has been dropped from the 10 th edition.
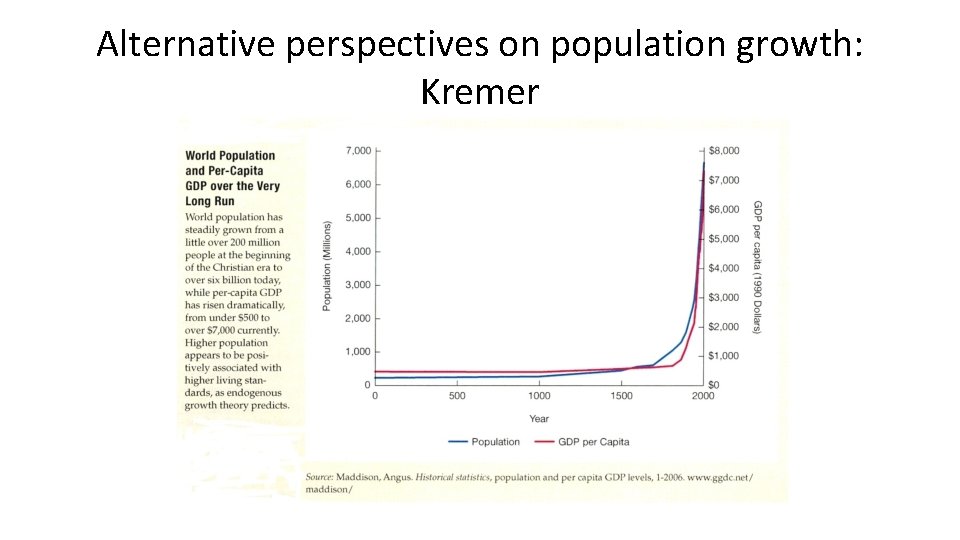
Alternative perspectives on population growth The Malthusian Model (1798) – Predicts population growth will outstrip the Earth’s ability to produce food, leading to the impoverishment of humanity. – Since Malthus, world population has increased sixfold, yet living standards are higher than ever. – Malthus neglected the effects of technological progress.
Alternative perspectives on population growth The Kremerian Model (1993) – Posits that population growth contributes to economic growth. – More people = more geniuses, scientists & engineers, so faster technological progress. – Evidence, from very long historical periods: • As world pop. growth rate increased, so did rate of growth in living standards • Historically, regions with larger populations have enjoyed faster growth.
Alternative perspectives on population growth: Kremer
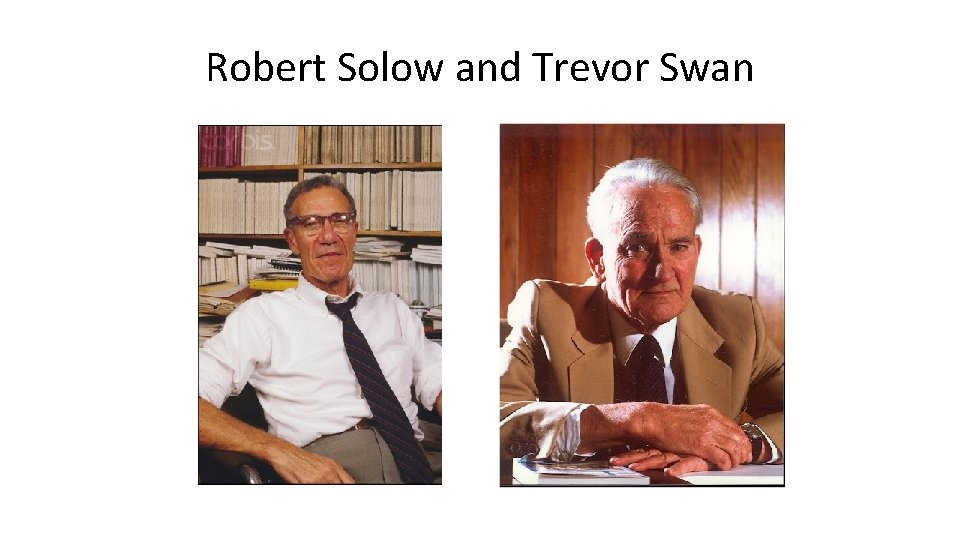
Robert Solow and Trevor Swan
Solow-Swan Model • Video: https: //youtu. be/e. VAS-t 83 Tx 0 (Intro to the Solow Model of Economic Growth) • Video: https: //youtu. be/Sljs. Iac. QDbc (Physical Capital and Diminishing Returns) • Video: https: //youtu. be/LQR 7 r. O-I 96 A (The Solow Model and the Steady State) • Video: https: //youtu. be/SVWX 4 Xjl 4 Os (Human Capital & Conditional Convergence)
Growth and Ideas • Video: https: //youtu. be/-y. PDlow. SL 1 w (The Solow Model and Ideas) • Video: https: //youtu. be/1 m. XBg-BVr. J 0 (The Economics of Ideas) • Video: https: //youtu. be/Jz 0 VXPPZOi. U (Patents, Prizes, and Subsidies) • Video: https: //youtu. be/Ip 2 -Qa 50 u. BI (Alex Tabarrok on how ideas trump crises) • Video: https: //youtu. be/4 zh. Pb. YYa. V 5 Y (The Idea Equation)
Solow-Swan (Going Deeper) • https: //youtu. be/Iq. Uux. EQUt 4 I (The Solow Model 1 Introduction) • https: //youtu. be/Mms. SIo. Gtyh 4 (The Solow Model 2: Comparative Statics) • https: //youtu. be/l. G 4 m_4 uh. ZIA (The Solow Model 3 -- Taking the Model to Data) • https: //youtu. be/S 1 x. Ri 5 JPDa. M (The Solow Model 4 Productivity)