PART III Fund Types and Comparative Performance Efficient


, largely in jest, that a blindfolded chimpanzee")


 500 Index is the most popular index")


")


 have also found a strong relationship between")


- Slides: 85
PART III Fund Types and Comparative Performance, Efficient Markets, Asset Allocation, and Morningstar Analysis
Chapter 7 Efficient Markets and Mutual Fund Investing : The Advantages of Index Funds
JUSTIFICATION FOR USING INDEX FUNDS • Traditionally, the justification for using index funds has been the argument that our securities markets tend to be reasonably efficient. The efficient market hypothesis (EMH) has been a central proposition of the field of finance for over 40 years. Eugene Fama (1970) in an early survey of EMH defines an efficient market as one in which security prices always fully reflect all available information.
• When information arises about an individual company or about the stock market as a whole, that information gets reflected in share prices without delay. Thus, even an uninformed investor will find that the current tableau of share prices accurately reflects all the information that is known to the market. In such a situation, it would be fruitless for an active portfolio manager to switch from security to security in a vain attempt to buy “undervalued” securities and sell “overvalued” ones.
• Such an attempt to gain above-average returns would accomplish nothing but to increase transactions charges as well as the taxes that must be paid by the mutual fund shareowner. • The EMH is associated with the view that stock market price movements approximate those of a random walk. If new information develops randomly, then so will market prices, making the stock market unpredictable apart from its long-run uptrend.
• Thus, neither technical analysis—an attempt to derive the future movement of stock prices by studying charts depicting the past movements of market prices—nor fundamental analysis—the attempt to predict future stock returns from a “fundamental” analysis of accounting data, future corporate investment strategies, competitive conditions, and the like—will allow professional portfolio managers to achieve abnormal (risk-adjusted) returns.
• I have suggested (Malkiel, 1973), largely in jest, that a blindfolded chimpanzee throwing darts at the stock pages could select a portfolio that would do as well as the experts. In fact, the correct analogy is to throw a towel over the stock pages and simply buy an index fund, which buys and holds all the stocks making up a broad stockmarket index. • In recent years, many financial economists have come to question the efficient market hypothesis. At least ex-post, there seem to be several instances where market prices failed to reflect available information.
• One celebrated example during the late 1900 s is when 3 Com spun off 5 percent of the Palm shares it owned. Based on the market price of Palm, the 95 percent of Palm still owned by 3 Com was worth more than the total capitalization of the parent company. Moreover, periods of large-scale irrationality, such as the technology-Internet bubble of the late 1990 s extending into early 2000, have convinced many analysts, such as Robert Shiller (2000), that the EMH should be rejected.
• In addition, some financial econometricians have suggested that stock prices are, to a significant extent, predictable from past returns or on the basis of certain valuation metrics, such as dividend yields and price-earning ratios. See, for example, Campbell and Shiller (1988 a, b), De. Bondt and Thaler (1995), Fama and French (1988), and Lo and Mac. Kinlay (1999). • But indexing can be an optimal strategy even if markets are occasionally or even often inefficient. To understand why this must be so, consider the next logic. All of the securities in any market must be held by someone. These investors as a whole must earn the overall return of the market.
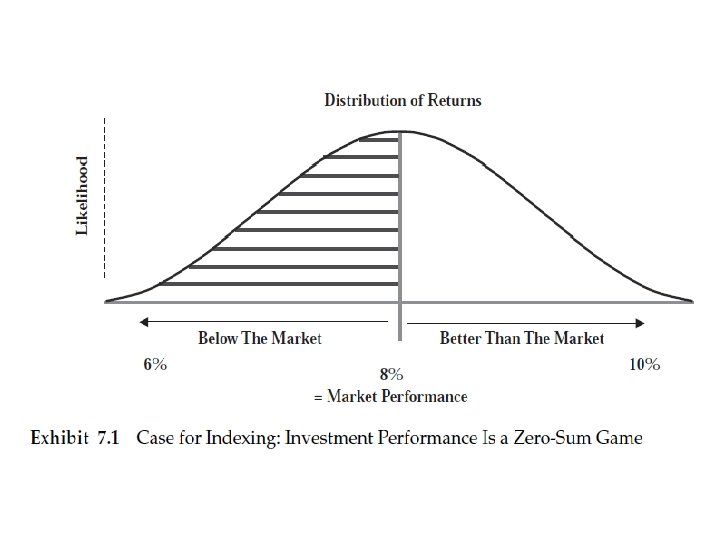
• If the market produces an overall return of 8 percent in any average year, then investors as a group must earn the same 8 percent before any investment expenses. Of course, there always some stocks that produce aboveaverage returns, and some investors will earn above-average returns in any particular period. But not everyone can be above average. We cannot live in Garrison Keillor’s mythical Lake Wobegon, where all the children are above average. Thus, investing must be a zero-sum game, as is illustrated in Exhibit 7. 1.
• If some investors are fortunate enough to be holding the best-performing stocks, then some other investors must be holding the poorerperforming ones. All investors as a group hold all the stocks, and it must be the case that they earn the overall market average return before expenses. • But mutual funds charge a variety of expenses. There are, for example, administrative costs of collecting and distributing dividends and preparing reports for the fund’s shareowners and for the government. There also investment management costs for the portfolio managers who perform the research analyses to determine which securities the fund will own.
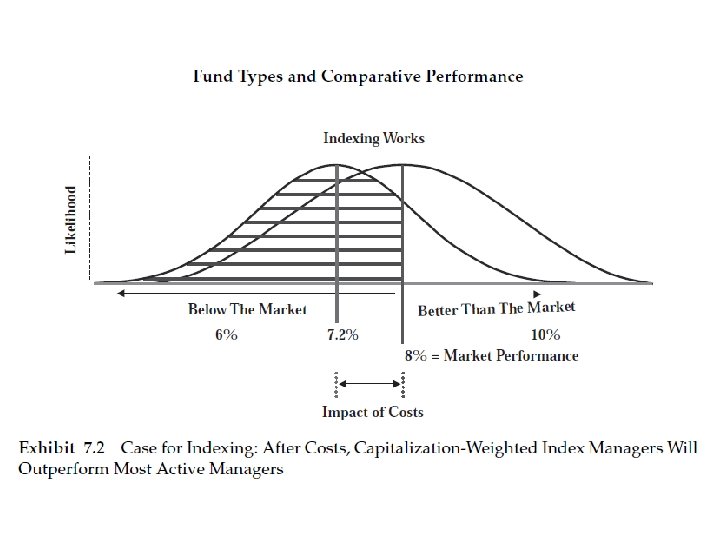
• Suppose that these costs amount to 8/10 of one percentage point per year, or 80 basis points. In that case, the situation will resemble that depicted in Exhibit 7. 2. • If in an average year the market produces an 8 percent rate of return, the average investor will earn only 7. 2 percent after expenses. Moreover, after expenses, most investors will underperform the overall market average, based on the total capitalization of all the outstanding stocks. After expenses, investing will not be a zero-sum game; investing will be a negative-sum game.
• From this analysis, the advantages of indexing can be seen clearly. Since index funds do not hire security analysts to pick what are believed to be the best securities and since index funds are buy-and-hold investors who generate limited turnover, index funds can be managed at minimal expense. Indeed, low-cost index funds and ETFs can be acquired at expense ratios of 10 basis points or less (i. e. , less than 1/10 of 1 percent). The advantage of indexing is that it allows the investor to achieve the market return at minimal expense.
• We can summarize the advantages of index funds in this way. If markets are reasonably efficient and generally reflect whatever information is available, then there will be little scope for professional investors to select portfolios of stocks that outperform the market. Stocks of companies with superior prospects will already have their prices fully reflect those prospects. Therefore, active management is unlikely to find large numbers of mispriced securities that will result in consistent above-average results.
• But even if markets are often or even usually inefficient, it still must follow that most investment managers will underperform the market. All investors as a group must earn the average market return before expenses. The underperformance of active managers must reflect the additional expenses that they incur in running active portfolios. In the next section, we examine the evidence based on the historical returns of equity mutual funds to test whether indexing is an effective strategy in practice.
EVIDENCE FROM U. S. INDEX FUNDS • Evidence from actively versus passively managed equity mutual funds in the United States strongly supports the efficient market hypothesis. Most investors have been better off investing in index funds. Passive index funds typically provide higher net returns to the investor than actively managed mutual funds.
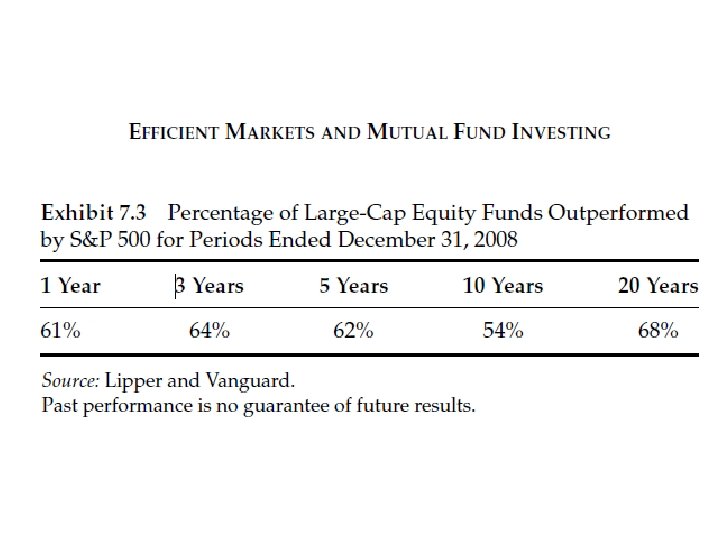
• The Standard & Poor’s (S&P) 500 Index is the most popular index of large-capitalization (large-cap) stocks in the United States. The index represents about 80 percent of the total capitalization of the U. S. equity market. The most popular index funds in the United States (as well as very popular ETFs) have been indexed to the S&P 500 or to an equivalent 500 -stock large-capitalization index (see Exhibit 7. 3).
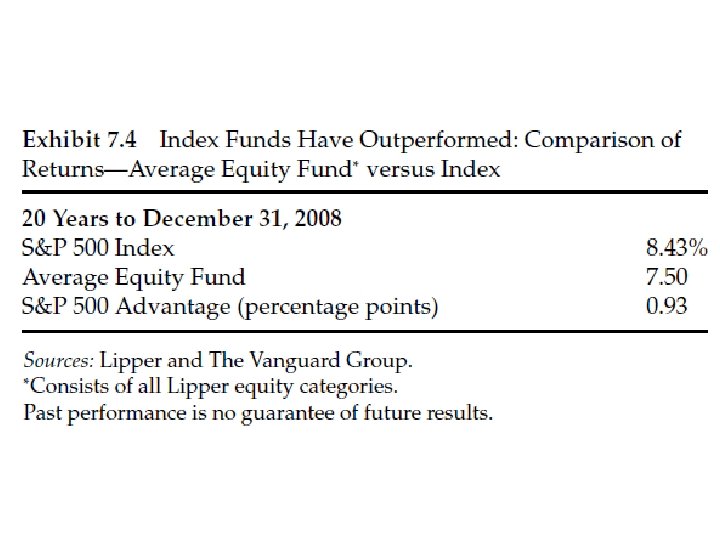
• Exhibit 7. 3 shows that over long periods of time, over 60 percent of actively managed large-cap equity mutual funds in the United States have been outperformed by an S&P 500 Index fund (see Exhibit 7. 4). • Exhibit 7. 4 shows that the average equity mutual fund in the United States (including all categories of funds) has underperformed the index by almost 1 percentage point per year over the 20 years ending December 31, 2008. This difference can be explained by the higher expenses of actively managed funds.
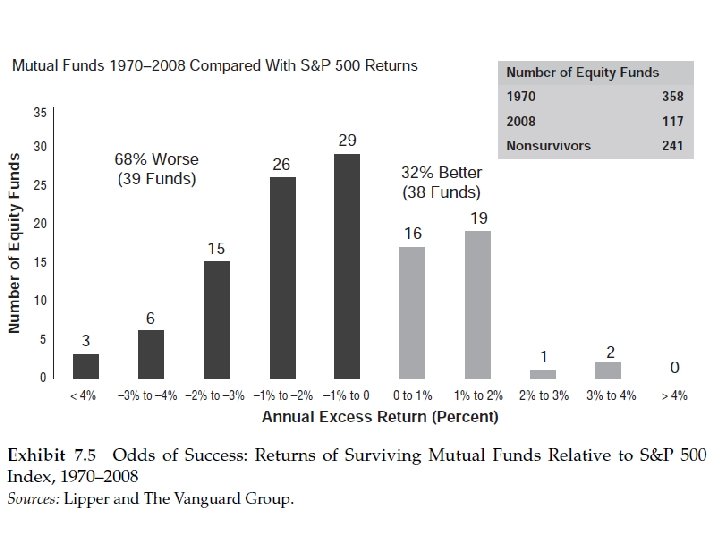
• The typical active fund carries an expense ratio that is considerably higher than that of a passive index fund. Moreover, active funds have much higher portfolio turnover, leading to higher trading costs (see Exhibit 7. 5). • An example of the superiority of index fund investing over the long run is shown in Exhibit 7. 5. The exhibit compares the performance of all the U. S. equity funds that existed in 1970 with the return of the S&P 500 stock index. There were 358 equity mutual funds in existence in 1970. Note that only 117 of these funds survived until 2008. The other 241 funds were closed or were merged into other funds.
• These 241 nonsurvivors were undoubtedly the poorer-performing funds since the more successful funds tend to stay in business. Thus, these data are tainted by “survivorship bias. ” We can only compare the long-run performance of surviving funds with the S&P 500 stock index. The exhibit shows that most actively managed mutual funds experienced performance that was inferior to the index. Indeed, one can count on the fingers of one’s hands the number of equity mutual funds that outperformed the S&P 500 stock index by more than two percentage points or more per year (see Exhibit 7. 6).
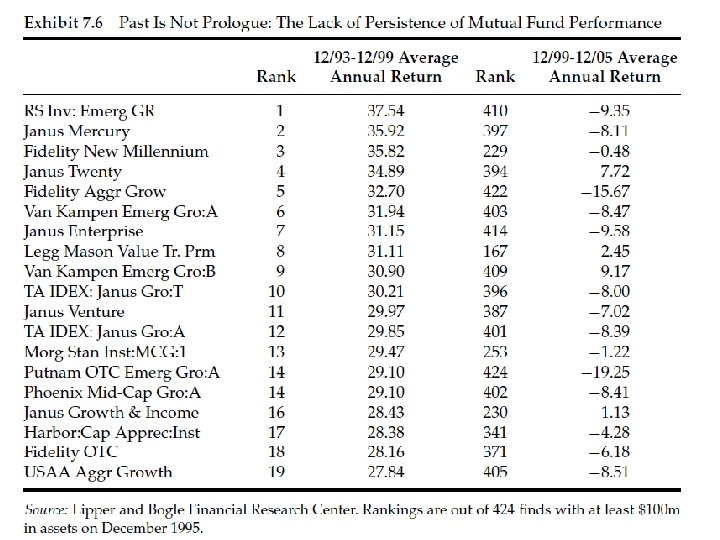
• Exhibit 7. 6 documents the lack of persistence in equity fund performance in a rather dramatic way. The exhibit lists the topperforming 19 U. S. equity mutual funds over the period from December 1993 through December 1999. These were the funds that enjoyed average annual returns that were at least twice as large as the returns for the stock market as a whole. The portfolio managers of these funds were lionized by the press and treated like rock stars in the popular financial magazines.
• Their above-average returns were generated, however, by concentrating their portfolios in stocks tied to the Internet. A worldwide bubble in such stocks burst during the first quarter of 2000. The exhibit shows that during the next six year period, these funds suffered severe losses and significantly underperformed the stock market as a whole.
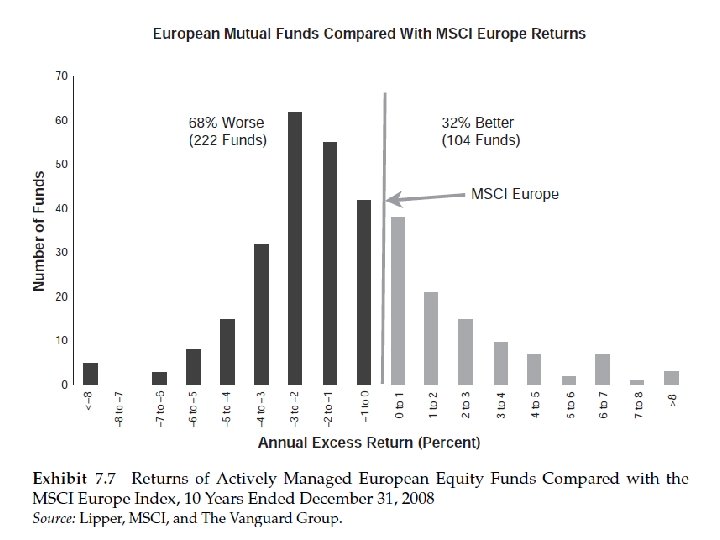
EVIDENCE IN FAVOR OF PASSIVE MANAGEMENT IN WORLD FINANCIAL MARKETS • Does the evidence in favor of passive management hold outside the United States? The United States has very liquid, transparent, and efficient stock markets. This may not be the case in the rest of the world, particularly in the world’s less developed emerging markets. In this section, I examine the case for indexing the markets outside the United States (see Exhibit 7. 7).
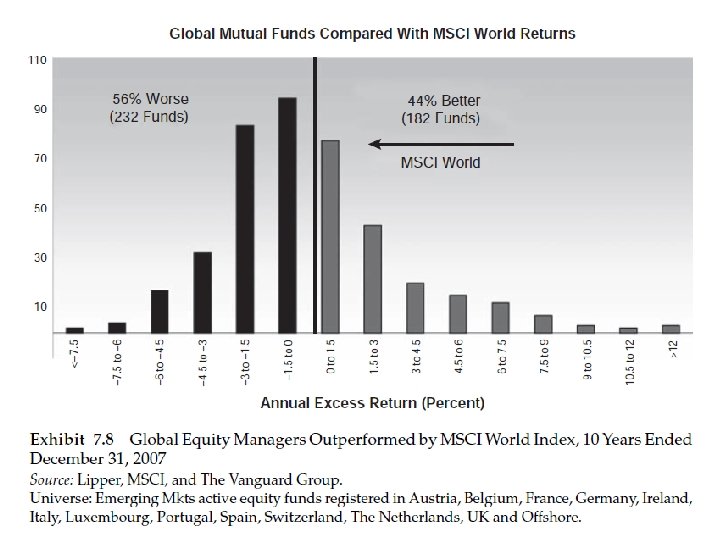
• Turning first to Europe, we can examine the performance of active European portfolio managers. Exhibit 7. 7 presents the comparison. We see that over two-thirds of the actively managed large-cap European funds were outperformed by the MSCI Europe index. Similar results can be shown for global equity managers. Exhibit 7. 8 examines the investment returns earned by 414 global equity managers compared with the MSCI World Index.
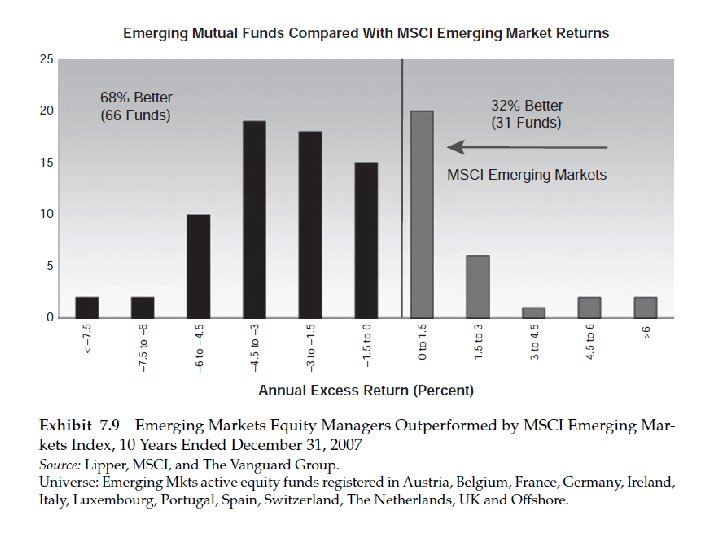
• Well over half of the active managers failed to outperform the passive world index. Even in emerging markets, many of which are far less efficient than markets in the developed countries, passive management appears to be a winning strategy. Exhibit 7. 9 indicates that about two-thirds of the active managers of emergingmarket funds were outdistanced by the index. Paradoxically, the very inefficiency of the trading markets in many emerging markets, with relatively large bid–ask spreads and a variety of transactions charges (including stamp taxes on security transactions), makes it difficult for active managers to outperform even in less efficient markets.
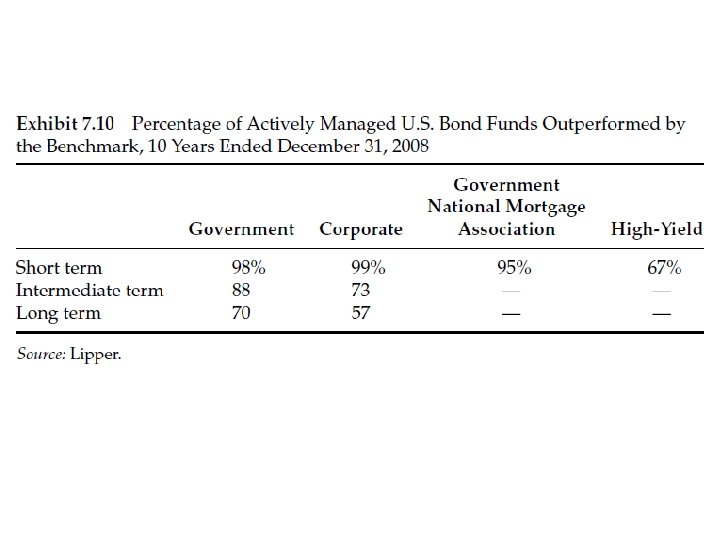
ACTIVE VERSUS PASSIVE MANAGEMENT IN THE BOND MARKET • Next I examine the efficiency of passive management in the bond markets of the United States and Europe. Exhibit 7. 10 presents the results for the United States. It appears that indexing is a particularly effective strategy in the bond markets. Bond funds appear to be commodity-type products.
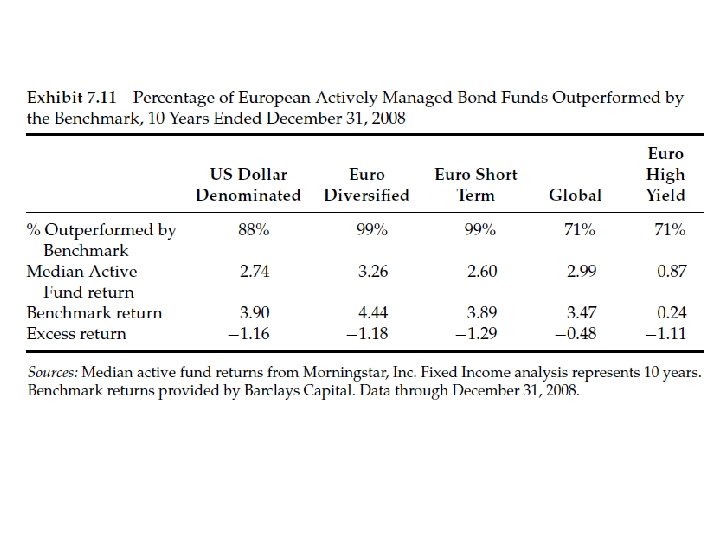
• Because passively managed funds charge lower management fees, it turns out that very few active bond portfolio managers are able to achieve net investment returns after expenses that match the net returns of lowcost bond index funds. In Europe, few of the active bond managers were able to outperform their respective benchmarks. Exhibit 7. 11 shows the results for the 10 -year period ending December 31, 2008.
COSTS ARE IMPORTANT DETERMINANTS OF NET RETURNS • Not all index funds investing in U. S. equities are created equal. There are some domestic index funds with annual expense ratios of as much as 100 basis points (one percentage point per year).
• A high expense ratio destroys a basic advantage of index funds. Every basis point of expenses lowers the net return earned by the investor. Some U. S. index funds and exchange-traded (index) funds are available with an annual expense ratio of 10 basis points (1/10 of 1 percent) per year or less. These are the funds an investor should favor. Index funds with expense ratios greater than 20 basis points per year should be avoided. The industry average expense ratio for actively managed funds is about 100 basis points per year.
• Foreign index funds and ETFs tend to have higher expense ratios than domestic funds. Low-expense broad international index funds (indexed to the Morgan Stanley Capital International EAFE index of equities in developed foreign markets) might carry an expense ratio of about 25 basis points. (The industry average expense ratio is over 150 basis points for actively managed non-U. S. funds. ) EAFE stands for Europe, Australasia and the Far East, and this index contains all the large corporations in the developed nations of the world that are domiciled outside the United States.
• Index funds specializing in emerging markets carry even higher expense ratios. Low-cost funds and ETFs may have annual expense ratios between 25 and 50 basis points. In addition, there may be a small purchase charge to defray the fund’s costs of buying securities in the less liquid emerging markets. While sales loads (charges of 300 basis points or more) should be avoided by investors, purchase charges of 50 basis points or less for funds that hold illiquid securities are often required.
• Similarly, index funds holding emerging market or other illiquid securities may impose redemption charges on investors who liquidate their fund shares after a very short holding period. Such charges are meant to discourage short-term trading that would subject the fund to potentially large trading costs, which hurt the long-term owners of the fund’s shares.
• Costs are just as important for actively managed as they are for passive index funds. A statistical analysis of the net returns from all diversified mutual funds over the 14 -year period 1994 through 2008 reveals that the higher the net returns to investors are, the lower the expense ratio of the fund. Moreover, the higher net returns earned by fund investors, the lower is portfolio turnover (i. e. , the less the portfolio manager tends to trade). Excessive trading generates transaction charges in addition to the portfolio manager’s fees and administrative costs.
• Portfolio turnover therefore tends to reduce the net returns available to the investor. In addition, trading can often be very tax inefficient. To the extent that high turnover tends to generate realized capital gains (and often short-term capital gains that are taxed at regular income tax rates), portfolio turnover reduces after-tax returns even further. Investors who hold their funds in taxable accounts will want to avoid funds that employ substantial portfolio turnover.
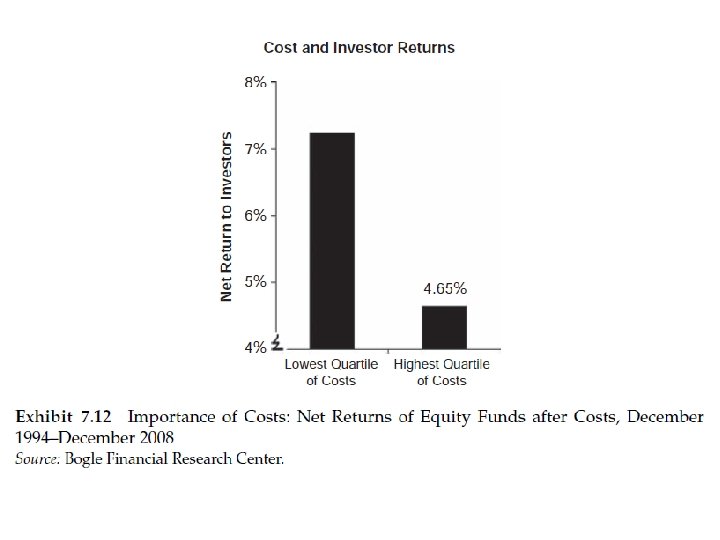
• Exhibit 7. 12 shows the effect of expenses on net returns. The exhibit compares the net returns of all diversified equity mutual funds that have high versus low expense ratios. The high-expense funds in the exhibit have expense ratios in the top quartile (the top one-quarter) of all funds, while low-expense funds are considered those with bottom-quartile expense ratios. In preparing the exhibit, expenses are calculated by adding the explicit expense ratio of the fund to estimated turnover costs. Every one percentage point of turnover is assumed to increase expenses by one basis point.
• As the exhibit indicates, the net returns to investors from the funds with the lowest explicit expenses and turnover are more than 200 basis points higher than the returns of the high-expenses funds. In judging the merits of actively managed funds, investors should prefer those with low expenses and low portfolio turnover. Of course, index funds and ETFs, with their rock-bottom expense ratios and very low turnover, are the quintessential funds designed to minimize investment costs.
MUTUAL FUNDS VERSUS ETFs • As indicated, ETFs are index funds that trade like stocks. They can be bought and sold at any time during the trading day, unlike mutual funds, which can be purchased and redeemed only at their net asset value calculated at the end of each trading day. How should an investor decide whether to buy index mutual funds or exchange-traded funds?
l ETFs have three important advantages. Ø 1. They tend to carry lower expense ratios than mutual funds. Ø 2. They can, at least in theory, be more tax efficient than mutual funds. If a mutual fund was forced to sell appreciated securities to meet redemptions from the holders of the fund’s shares, it could be required to realize capital gains that must be apportioned to the fund’s shareholders.
• ETFs create and redeem shares only in large blocks and only with large investors and traders. Because the creation and redemption of units of ETFs serve to ensure that the ETF sells at (or very close to) net asset value, any sales of securities to meet redemptions are not considered taxable events.
Ø 3. ETFs can be traded during the day, not simply at the closing net asset value at the end of the day. This third advantage should be treated with some skepticism, however. Investors are unlikely to benefit from timing their purchases and sales during the trading day. Indeed, to the extent that investors attempt to “time” the market with ETFs, they are unlikely to improve their return over those earned by the buy-and-hold investor.
• ETFs have a disadvantage, however, in that purchases and sales incur brokerage charges. Transactions in (no-load) mutual index funds do not incur transaction charges. Even if a discount broker is used to purchase and sell ETF shares, there are commissions to pay as well as the bid–ask spread. (Purchases are made at the “ask” price while sales are made at the “bid” price, which is lower. Therefore, an investor who purchases at one time and sells at another will incur the cost of the bid– ask spread. )
• How should an investor trade off the lower annual costs of many ETFs with the additional transactions charges involved with buying and selling ETFs? • The answer is relatively straightforward. If you will be investing a large sum in an index fund (say $10, 000 or more), you are likely to be better off with a low-cost ETF. If, however, you are making periodic contributions (say $100 a month) into an index fund that is part of your retirement portfolio, a mutual fund is far and away the better alternative.
• The transactions costs of putting small amounts regularly into an ETF are likely to be prohibitive. Similarly, if you are retired and are drawing money out of your retirement nest egg, you will be better off keeping the money you will soon need in mutual funds rather than in ETFs. In any event, there a wide variety of expense ratios for different mutual funds and ETFs. Some mutual funds have even lower annual expenses than ETFs. Before making any fund investment decision, be sure to check the actual charges associated with any investment you are considering.
STOCK MARKET RETURNS VERSUS INVESTOR RETURNS • It is customary in calculating mutual fund returns (as well as the historical returns from equity investments in general) to measure the returns earned by a buy-and-hold investor who buys at the start of the period being measured and holds the investments until the end of the period. Thus, when Ibbotson Associates (2008) reports that equity returns in the United States have averaged 9. 6 percent per annum from 1926 through 2008, those are the returns earned by an investor who buys at the start of 1926 and holds throughout the entire period.
• The actual returns of investors are determined, however, not only by the average annual returns of the market index, but also by the timing of their purchases and sales in and out of the market. Moreover, individual investors may deliberately move in and out of various market sectors over time. Hence, the actual returns of individual investors may differ substantially both from overall stock market returns and also from the long-run rates of return of the mutual funds they hold.
• We can measure the actual returns earned by equity investors by calculating dollar-weighted returns rather than returns to the buy-andhold investor. A simple numerical example, taken from an article by Ilia Dichev (2007), will illuminate the difference between buy-andhold returns and investor returns. Suppose an investor buys 100 shares of XYZ Company at $10 per share at the start of period 1. By the end of period 1, the stock doubles to $20 per share, at which time the investor purchases another 100 shares. Then the stock falls back to $10 per share at the end of period 2.
• The normal return calculation yields the result of a zero rate of return over the two-year period. (The stock started and ended at $10 per share. ) That would be the correct return for the investor who bought at the start of period 1 and sold at the end of period 2. But for our hypothetical investor who bought 100 shares both at $10 and $20 per share and then sold at the end of period 2 at $10, the result was a negative return ($3, 000 was invested and then sold at the end of period 2 for $2, 000).
• Indeed, that investor’s internal rate of return was − 26. 8 percent per annum. While the buy-andhold return gives a reasonable estimate of the return for holding the stock over the entire period, it will be a very poor measure of the actual returns of investors whose capital flows in and out of the market vary over time. • When there are significant correlations between the timing of capital contributions into the equity market and withdrawals from the market, then dollar-weighted returns will tend to differ from buy-and-hold returns. There is considerable evidence that capital flows into the equity market are significantly correlated with past returns.
• One of the insights from the field of behavioral finance is that investors are often influenced by herd behavior. They tend to buy stocks when everyone is optimistic and sell stocks during times of ubiquitous pessimism. Specifically, individuals tend to put money into the stock market after the market has experienced relatively high returns and optimism prevails and take money out of the stock market following periods in which the market has declined. See, for example, Ikenberry, Lakonishok, and Vermaelen (1995) and Loughran and Ritter (1995).
• Because of these correlations, dollar-weighted returns will differ systematically from buy-andhold returns. Dichev (2007) found that the return differential is substantial. The return differential was 1. 3 percentage points for exchange-traded stocks during the period 1926 to 2002. The return differential between dollar-weighted and buyand-hold returns for Nasdaq stocks was 5. 3 percentage points per year from 1973 to 2002. In all cases the dollar-weighted returns are lower than the buy-and-hold returns because individual investors tend to add money to their investments at particularly inopportune times.
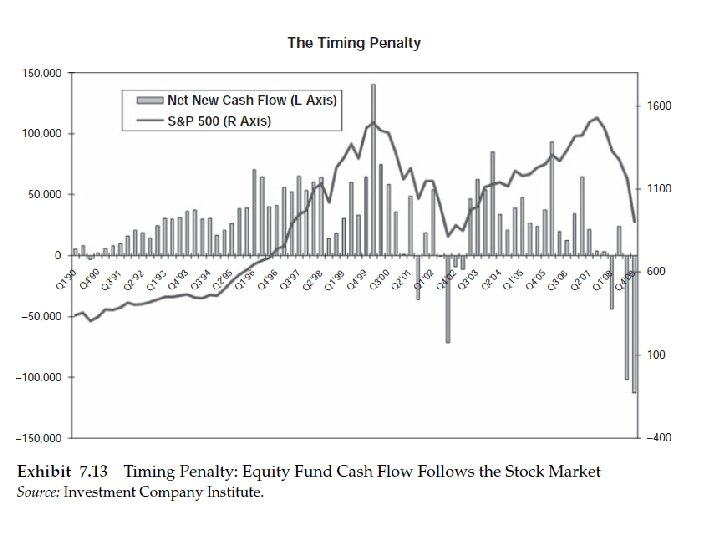
• The next two exhibits illustrate the problem. Exhibit 7. 13 superimposes data on cash flows into equity mutual funds with the behavior of the S&P 500 stock index. The exhibit shows that new cash flows into equity mutual funds are significantly higher following increases in stock prices. Indeed, the largest inflows into equity mutual funds occurred during the last quarter of 1999 and the first quarter of 2000, exactly at the peak of the Internet bubble in the stock market.
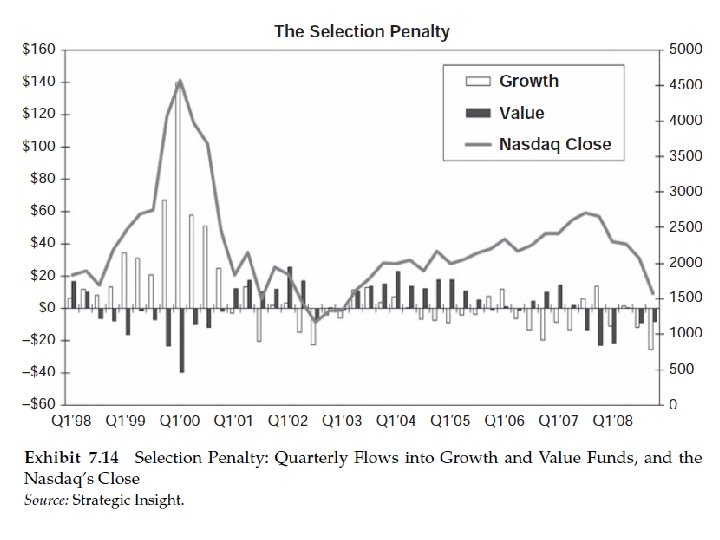
• The exhibit also shows that record withdrawals from equity mutual funds occurred during the third quarter of 2002, just at the bottom of the stock market. Huge withdrawals were also made as the stock market sank in the fourth quarter of 2008. • This tendency of individuals to put their money in the stock market (and take money out) at inopportune times is what I have called the timing penalty. The situation is even worse, however, because investors also suffer from what can be called the selection penalty, shown in Exhibit 7. 14.
• Not only did more money flow into the stock market than ever before during the Internet bubble, but those fund flows were concentrated in high-technology growth mutual funds, precisely the part of the market that turned out to be the most overvalued. Note that during the fourth quarter of 1999 and first quarter of 2000, there were significant outflows from “value” mutual funds, precisely the funds with the most attractive relative valuations. So not only did more money flow into the market at an inopportune time, but investors tended to put their money into exactly the kinds of stocks that were experiencing the biggest recent gains.
• This tendency of investors to follow what have recently been the attractive sectors in the stock market is another factor responsible for the substantial differential between buy-andhold returns and dollar-weighted returns. The tendency for investors to alter the composition of their mutual fund portfolios exaggerates the differentials between the overall returns to the stock market and the returns earned by the average investor that result from inopportune market timing.
STYLE OR FACTOR TILTS IN MUTUAL FUNDS • Many mutual funds, whether actively managed or indexed, employ certain style or factor tilts in composing their portfolios. For example, some mutual funds specialize in smaller companies—those whose market capitalizations are below the average capitalization for traded companies in general. Other funds concentrate on so-called value stocks—those stocks that sell at relatively low multiples of their book values and earnings.
• Some indexed market mutual funds are broken up into value and growth components or into small-cap and large-cap portfolios. The Morningstar mutual fund service uses nine breakdowns to describe the style focus of the fund. Funds are categorized by a nine-box grid, where funds are categorized on one axis as being invested in small-, medium-, and large-cap stocks, and on the other axis by style (i. e. , invested in value or growth stocks or in a blend of the two).
• Considerable recent interest had been shown in a new set of indices that are weighted by certain fundamental factors, such as sales, earnings, dividends, or book values, rather than by capitalization. The best known of the new fundamentally weighted indices that claim to improve on cap-weighted indexes is the Research Affiliates Fundamental Index TM (RAFI). The RAFI index contains 1, 000 stocks weighted by fundamental measures of book value, earnings, and so on, and has outperformed traditional large -cap indices, such as the S&P 500 Index and the Russell 1000 by margins of over 300 basis points per year during the early 2000 s.
• Such performance has emboldened the proponents of the Fundamental Index. TM (FI) to claim that this new method of indexing could replace the old paradigm of capitalizationweighted indexing. See, for example, Arnott, Hsu, and Moore (2005) and Arnott, Hsu, and West (2008). • In my judgment, the reason for the ability of FI portfolios to outperform certain market benchmarks during the period from 2000 through 2006 is that FI relies on the two factor tilts that researchers have understood for years.
• To the extent that earnings and book values are some of the factors used to weight stocks in the portfolio, FI will systematically overweight value stocks and underweight growth stocks. Moreover, since FI underweights stocks with high market capitalizations relative to fundamental factors, there will be a tendency for an FI portfolio to contain smaller-capitalization stocks than those in a traditional cap-weighted index.
• Along literature in empirical finance has isolated a value effect in asset pricing. Studies such as Basu (1983) and Keim (1988) have shown that stocks selling at low prices relative to their earnings (P/E) and book values (P/BV) have generated higher returns for investors. Similar results have been shown for stocks selling at low multiples to their sales. One can interpret such findings as being inconsistent with efficient markets.
• Portfolios made up of stocks with low P/BV ratios earn excess risk-adjusted returns when risk is measured by beta from the Capital Asset Pricing Model (CAPM). But any test of market efficiency is a joint test of the relationship of return to P/BV and the efficacy of CAPM’s beta to fully measure risk. According to Fama and French (1992), the ratio of price to book value itself is a risk measure; therefore, the larger returns generated by low P/BV stocks are simply compensation for risk.
• Investigators such as Banz (1981) have also found a strong relationship between company size (measured by total market capitalization) and returns. Smaller firms appear to generate higher returns than large firms. Again, the interpretation of these results is controversial. The excess returns of small firms can be interpreted as an inefficiency. The interpretation of Fama and French, however, is that both P/BV and size are risk factors in addition to beta. Low P/BV stocks are often those in some financial distress, and small stocks may be far more sensitive to economic shocks than are larger firms.
• Over the period from 2000 through 2005, there was a particularly strong value effect as well as a small-firm effect. The bursting of the Internet bubble in early 2000 produced extremely poor returns for the overpriced large-cap growth stocks that were the market leaders during the late 1990 s. FI portfolios were not alone in performing very well over the early 2000 s. Managed as well as index funds focusing on value and small-cap stocks all tended to outperform the broad market indexes.
• One direct method of measuring the factor tilts inherent in FI portfolios is to perform a regression analysis of the monthly FI returns in the United States against a Fama-French three -factor model. Fama and French (1993) argue that the CAPM should be augmented by two additional risk factors: company size and the market price to book (M/B) ratio. Thus, risk is captured by CAPM’s beta, M/B, and an equity capitalization (size) measure.
• If one performs such a regression over the period from January 1979 through December 2008, it is possible to show that the FI return can be fully explained by the three Fama-French risk factors, as has been shown by Jun and Malkiel (2008). The coefficient of determination of a regression of FI returns and the three Fama-French risk factors is 0. 96, and all of the coefficients of the factors are highly significant. Moreover, a zero alpha, or excess return, is generated by the FI method of weighting the portfolio. In addition, it is possible to replicate the FI returns with a variety of ETFs that employ similar factor tilts.
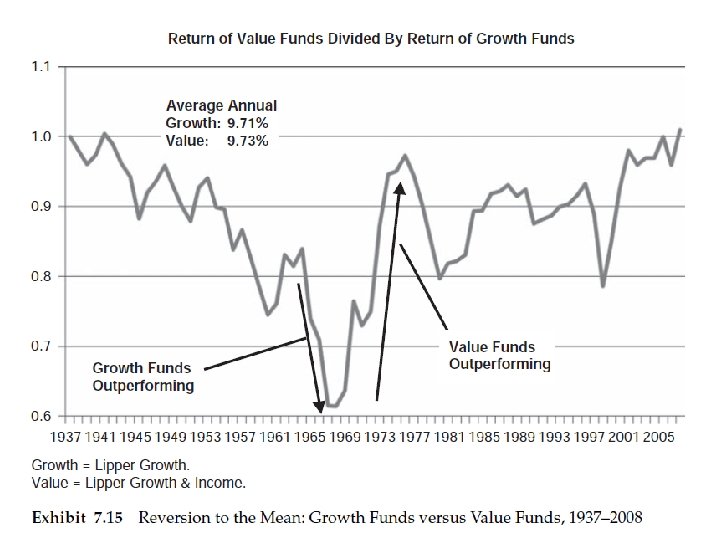
• We need also to maintain some degree of skepticism concerning the long-term productivity of value and size portfolio tilts. From the mid-1960 s to the present, value mutual fund managers have usually outperformed growth managers (although not during the late 1990 s). Fama and French (1992) come to the same conclusion. In earlier periods, however, from the late 1930 s to the mid-1960 s, growth stocks appeared to be the persistent winners.
• There appears to be considerable mean reversion evident in the time series when measured over a very long time period. Indeed, Exhibit 7. 15, which measures the relative performance between mutual funds with growth and value mandates, shows that, over more than a 70 -year period, the performance of both types of funds was essentially the same. A similar kind of mean reversion can be shown to exist between large - and small-capitalization stocks.
CONCLUSIONS • This chapter has examined the efficiency of equity and bond markets and the efficacy of passive (index fund) compared with active portfolio management. If securities markets were characteristically inefficient, we would expect professional portfolio managers to achieve excess performance over the returns earned by the market as a whole.
• I interpret the inability of professional portfolio managers to outperform passive capitalization-weighted index funds as powerful evidence that securities markets around the world are generally efficient. To be sure, markets make mistakes—sometimes egregious ones, as during the time of the Internet bubble of late 1999 and early 2000. But there is no evidence that professional investors are able to recognize such mispricing ex ante and to adjust their portfolios.
• As a result, many professional portfolio managers have adopted what is called a core– satellite strategy. The core of the portfolio is invested in low-cost index funds. This guarantees broad diversification and no risk that at least a part of the portfolio will underperform a broad market benchmark. Satellite portfolios can employ specialized and undiversified equity managers with far less risk than if the entire portfolio were actively managed.