PART II Methods for Causal Inference PART II


 •")


, Rosenzweig-Wolpin (2000) 69")


 introduce “as-if random” noise")


: Making explicit the difference between identification and estimation Why do observational studies")
: Explicitly represent your identifying and estimating assumptions. Identifying assumption: All the arrows")
: Refute your assumptions, and analyze your estimate’s sensitivity to violations Identifying assumption:")


 102")
 103")


- Slides: 109
PART II. Methods for Causal Inference
PART II. Methods for Causal Inference Observational Studies Natural Experiments Refutations
Review: Treatment, Outcome and Confound X • T Y X T Y
Review: Treatment, Outcome and Confound X • T Y X T Y
g n i n n u R Review: Exercise, Cholesterol, and Age e l p exam • Age Exercise Cholesterol
g n i n n u R Review: Exercise, Cholesterol, and Age e l p exam • Age B n n a c e w f i ut, what ? e n e v r e t Exercise n i y l e v i t c ot a Cholesterol
Part II. A. Observational Studies “Simulating randomized experiments" Conditioning on Key Variables Matching and Stratification Weighting Regression Doubly Robust Synthetic Controls
Part II. A. Observational Studies “Simulating randomized experiments" Conditioning on Key Variables Matching and Stratification Weighting Regression Doubly Robust Synthetic Controls
Cholesterol Stationary Biking
Cholesterol Stationary Biking
Age 40 Cholesterol 35 30 25 20 Stationary Biking
Age 40 Cholesterol 35 30 25 20 Stationary Biking
Recapping what just happened • At first, more stationary biking seems to lead to higher cholesterol • But, we realize that there is a confounder, age, that influences both stationary biking and cholesterol • We condition on age (by analyzing each age group separately) • And find stationary biking now seems to lead to lower cholesterol
What are the assumptions we made? • Assumption: age is the only confounder • “Ignorability” or “selection on observables” assumption • How do we know what we must condition on? • Assumption: effect of stationary biking doesn’t depend on friends’ exercise • Stable Unit Treatment Value (SUTVA) assumption • Are there network effects? • Assumption: our observations of exercise/no-exercise cover similar people • “Common support” or “Overlap” assumption • Also: data is not covering all combinations of age and levels of exercise • Will our lessons generalize beyond the observed region?
A 1: Ignorability •
A 2. Stable Unit Treatment Value • er b m e r / ow n k e r e h e l p Do peo is? e n i h c a m x what a fa
A 3. Common support •
Advanced: How to know we have the right variables? Backdoor criterion 1. Use domain knowledge to build a model of the causal graph 2. Condition on enough variables to cover all backdoor paths Occupation Income Diet Age Exercise Cholesterol Caveat: Causal effect only if assumed graphical model is correct 18
What we just learned: Simple Conditioning Definition Conditioning calculates treatment effects by identifying groups of individuals with the same covariates, where individuals in one group are treated and in the other group are not. Intuition Example In the cartoon relationship between exercise and cholesterol, age is a confounder, as it influences both levels of exercise and cholesterol. By conditioning analysis on age, we can identify the effect of exercise. Keep in mind
Part II. A. Observational Studies “Simulating randomized experiments" Conditioning on Key Variables Matching and Stratification Weighting Simple Regression Doubly Robust Synthetic Controls
Avg Cholesterol = 200 Avg Cholesterol = 206
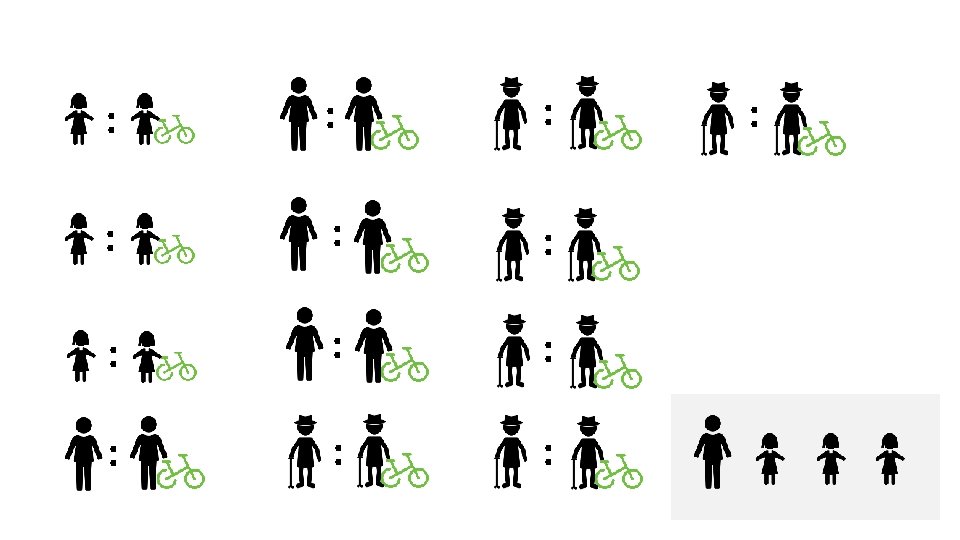
Matching • i : j
Exact Match •
Mahalanobis Distance •
Propensity Score •
How to match with propensity score •
Propensity score, FAQ Q: Wait, why does this work? A: Individuals with similar covariates get similar scores, and all individuals mapped to a similar score have similar treatment likelihoods. Q: What if my propensity score is not accurate? (i. e. , can’t tell who is treated) A: That’s ok. The role of the model is to balance covariates given a score; not to actually identify treated and untreated. Q: What if my propensity score is very accurate? (i. e. , can tell who is treated) A: Means we cannot disentangle covariates from treatment status. Any effect we observe could be due either to the treatment or to the correlated covariate. Consider redefining the treatment or general problem statement. Don’t dumb down model!
Propensity score matching python code # learn propensity score model psmodel = linear_model. Linear. Regression() psmodel. fit(covariates, treatment_status) data['ps'] = psmodel. predict(covariates) # find nearest neighbor matches control. Matcher = Nearest. Neighbors(). fit(untreated['ps’]) distances, match. Index = control. Match. kneighbors(treated['ps']) # iterate over matched pairs and sum difference in outcomes for i in range(numtreatedunits): treated_outcome = treated. iloc[i][outcome_name]. item() untreated_outcome = untreated. iloc[match. Index[i]][outcome_name]. item() att += treated_outcome - untreated_outcome # normalize att /= numtreatedunits
Advanced: Matching • When matching, should we allow replacement? • It’s a bias / variance trade-off • When matching, what if nearest neighbor is far away? • Use a caliper threshold to limit acceptable distance • What if not all treated individuals are matched to untreated? • This will bias results. Consider redefining original cohort / population to cleanly exclude treated who won’t have matches in untreated population. • Treatment should be a binary point treatment • Advanced variants allow multi-dose, and other treatment regimens
What we just learned: Matching Definition Matching calculates treatment effects by identifying pairs of similar individuals, where one is treated and the other is not. Intuition The paired individuals stand-in as the counterfactual observations for one another. Example In our cartoon, we create pairs of individuals matched exactly on their age. More generally, we can use Mahalanobis distance or propensity score matching to find similar individuals to be matched. Keep in mind Matching calculates the treatment effect on the treated population. We do not know what might happen if people who would never get treatment are suddenly treated.
180 200 190 240 230
From Matching to Stratification •
How to stratify with propensity score •
Propensity Score Stratification We can use propensity score to stratify populations 1. Calculate propensity scores per individual as in matching. 2. But instead of matching, stratify based on score. 3. Calculate average treatment effect as weighted average of outcome differences per strata. 4. Weight by number of treated in the population for ATE on treated. Propensity = 0. 0 Propensity = 1. 0
Propensity Score Stratification • Propensity = 0. 0 Propensity = 1. 0
Propensity score stratification python code # build propensity score model and assign each item a score as earlier… # create a column 'strata' for each element that marks what strata it belongs to data['strata'] = ((data['ps']. rank(ascending=True) / numrows) * num. Strata). round(0) data['T_y'] = data['T'] * data['outcome’] # T_y = outcome iff treated data['Tbar'] = 1 - data['treated’] # Tbar = 1 iff untreated data['Tbar_y'] = data['Tbar'] * data['outcome'] # Tbar_y = outcome iff untreated stratified = data. groupby('strata') # sum weighted outcomes over all strata (weight by treated population) outcomes = stratified. agg({'T': ['sum'], 'Tbar': ['sum'], 'T_y': ['sum'], 'Tbar_y': ['sum']}) # calculate per-strata effect outcomes[‘T_y_mean'] = outcomes[‘T_y_sum'] / outcomes['T'] outcomes[‘Tbar_y_mean'] = outcomes[‘Tbar_y_sum'] / outcomes['dbar_sum'] outcomes['effect'] = outcomes[‘T_y_mean'] - outcomes[‘Tbar_y_mean’] # weighted sum of effects over all strata att = (outcomes['effect'] * outcomes['T']). sum() / totaltreatmentpopulation
P. S. Stratification, Practical Considerations • How many strata do we pick? • • • Scale will depend on data. Want each stratum to have enough data in it. Conventional, small-data literature (e. g. , ~100 data points) picked 5. With 10 k to 1 M or more data points, I pick 100 to 1000 strata. Set strata boundaries to split observed population evenly Aside: why not always pick a small number of strata? It’s a bias-variance trade -off… • What if there aren’t enough treated or untreated individuals in some of my stratum to make a meaningful comparison? • This often happens near propensity score 0. 0 and near 1. 0 • Drop (“Clip”) these strata from analysis. Technically, you are now calculating a local-average-treatment-effect.
What we just learned: Stratification Definition Stratification calculates treatment effects by identifying groups of individuals with similar distributions of covariates, where individuals in one group are treated and in the other group are not. Intuition The difference in average outcome of paired groups tells us the effect of the treatment on that subpopulation. Observed confounds are balanced, due to covariate similarity across paired groups. Example In our cartoon example, we stratified based on propensity score into 3 strata. ATE is the weighted sum of differences in avg outcomes in each strata. Keep in mind Make sure there are enough comparable individuals in each strata
Part II. A. Observational Studies “Simulating randomized experiments" Conditioning on Key Variables Matching and Stratification Weighting Simple Regression Doubly Robust Synthetic Controls
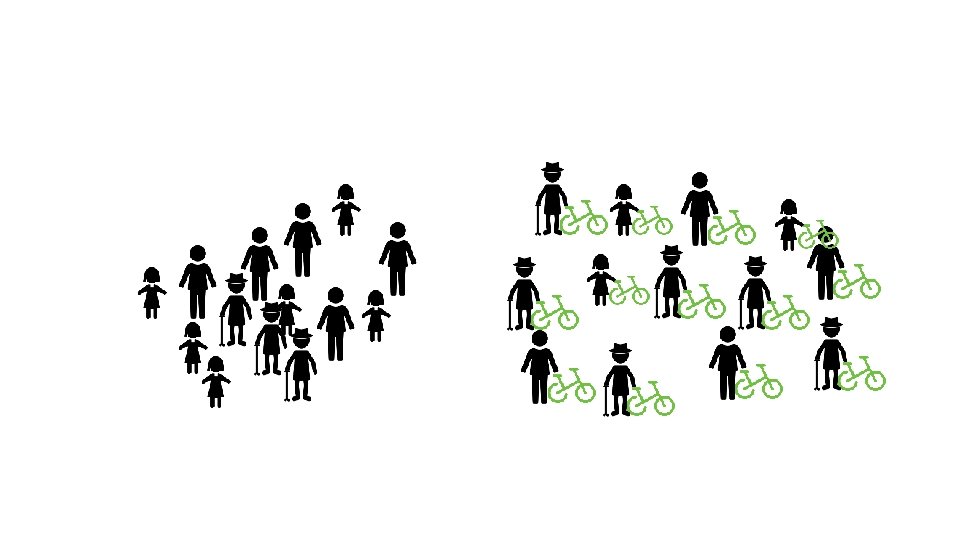
Weighting: An alternative to conditioning What if we assign weights to observations to simulate randomized experiment? Stratification weights strata results by number of treated Weighting by treated population ~ weighting by propensity score. Generalized weighting: Calculate effect by weighted sum over all individual outcomes Many weighting methods to generate a balanced dataset Propensity = 0. 0 Propensity = 1. 0
Weighting Stratification weights strata results by number of treated Weighting by treated population ~ weighting by propensity score. Generalized weighting: Calculate effect by weighted sum over all individual outcomes Many weighting methods to generate a balanced dataset Propensity = 0. 0 Propensity = 1. 0
Weighting •
Weighting: Caveats and Practical notes • 45
What we just learned: Weighting Definition Weighting calculates average treatment effect as the difference between the weighted sum of the treated and untreated populations Intuition Weights on each individual act to balance the distribution of covariates in the treated and untreated groups. (i. e. , break the dependence between treatment status and covariates) Keep in mind High variance when propensity scores are very high or very low Many variants of weighting schemes
Part II. A. Observational Studies “Simulating randomized experiments” Conditioning on Key Variables Matching and Stratification Weighting Simple Regression Doubly Robust Synthetic Controls
Regression (or supervised learning) •
Regression warnings Causal interpretation of regressions requires many assumptions. Threats to validity include: - Model correctness: e. g. , what if we use a linear model and causal relationship is non-linear - Multicollinearity: if covariates are correlated, can’t get accurate coefficients - Ignorability (Omitted variables): Omission of confounds will invalidate findings
What we just learned: Regression Definition Use a regression-based causal analysis, we interpret coefficients as the strength of causal relationship Example Modeling cholesterol as a function of exercise and age Keep in mind Analysis must be carefully designed to ensure causal interpretability, avoiding collinearity and including all relevant confounds Avoid unless you are absolutely sure of what you are doing.
Part II. A. Observational Studies “Simulating randomized experiments" Conditioning on Key Variables Matching and Stratification Weighting Simple Regression Doubly Robust Synthetic Controls
Doubly robust: Best of both worlds? • Both propensity score weighting and regression models require correctly specified models • E. g. , if propensity score or regression is modeled as a linear combination, but is non-linear, than it is not correctly specified • Doubly robust methods combine “best of” propensity score and regression methods • If either propensity score or regression is correctly specified, then doubly robust is correct.
DR: Combines 3 components •
Doubly Robust: Caveat If either propensity score or regression is correctly specified, then doubly robust is unbiased. Seems like doubly robust should be strictly better (less biased) than either propensity score weighting or regression But, if both propensity score or regression are slightly incorrect, then doubly robust estimator may become very biased
What we just learned: Doubly Robust Intuition Combine propensity score weighting and regression models to provide unbiased estimate when either propensity score or regression is correctly specified Keep in mind Fundamental assumptions (ignorability, etc) must still hold. If both models are slightly incorrect, doubly robust estimator can be more biased
Part II. A. Observational Studies “Simulating randomized experiments" Conditioning on Key Variables Matching and Stratification Weighting Simple Regression Doubly Robust Synthetic Controls
Synthetic control •
Synthetic controls: Intuition 1. Decide what the treatment will be 2. Pre-treatment stage: Observe the world for a while • Record the outcome we care • Record covariates that can help us predict our observed outcome, but will not be effected by the treatment. Use domain-knowledge / theory to identify these covariates. • Learn a model that predicts outcome based on covariates. 3. Post-treatment stage: • Keep recording outcome. This is now the treated outcome. • Predict untreated outcome using learned model and current covariates • ATE = Difference between observed outcome and prediction of untreated outcome
Example: policy change to encourage exercise Build model of cholesterol from pre-treatment data Age, Restaurants, Vegetable Prices, … Time Cholesterol Time Synthetic control (untreated) predicted from covariates Treatment effect is the difference between predicted control and observed (treated) outcome
What we just learned: Synthetic Controls Definition Calculate treatment effect by comparing observed outcomes of treated population with synthetic (predicted) outcomes of an untreated population Intuition If we can measure covariates that are unaffected by the treatment and predictive of untreated outcomes, then we can build a synthetic control Example Predicting effect of global policy change to encourage exercise on population-wide cholesterol Keep in mind Ignorability assumption must still hold; Relatedly, be concerned about generalizability/robustness of learned outcome model
PART II. Methods for Causal Inference Observational Studies Natural Experiments Refutations
Part II. B. Natural Experiments Simple natural experiment Instrumental Variables Regression Discontinuities
Natural experiments: What can we do without ignorability? Rather than assume ignorability over the entire dataset, find data subsets that approximate an experiment. “Natural” as if Nature conducted an experiment for you Common sources: Prior A/B tests, Lottery, any randomized policy, an external shock to the treatment. Allows common causes of T and Y, as long as the source is not affected by them.
Finding a natural experiment Example: Cholera cause estimation in 1850 s.
1854: London was having a devastating cholera outbreak 65
Enter John Snow. He found higher cholera deaths near a water pump, but could be just correlational. 66
V S & TER WA PANY COM H ET MB LA TER NY WA MPA CO New Idea: Two major water companies for London: one upstream and one downstream. Customers of each company distributed throughout city 67
S&V and Lambeth No difference in neighborhood, still an 8 -fold increase in cholera with the downstream company. 68
“Natural” experiments: exploit variation in observed data Dunning (2002), Rosenzweig-Wolpin (2000) 69
What we just learned: Simple natural experiment Definition Exploit “as-if random” assignment of treatments to measure outcome. Intuition When assignment of treatment is unrelated to the measured outcome and their common causes, we can treat it as if it is a randomized experiment to estimate treatment effect. Example What water company do you buy from? Keep in mind As-if random assignments of treatments are hard to find. Estimates very sensitive to violation of exclusion assumption.
As-if Random Part II. B. Natural Experiments Instrumental Variables Regression Discontinuities
Prior setup can be generalized as search for an “instrumental variable” Other factors [e. g. neighborhood] (U) As-If-Random Water Company( Z) Contaminated Water (T) Exclusion Cholera Diagnosis (Y)
Prior setup can be generalized as search for an “instrumental variable” As-If-Random Unobserved Confounders (U) Instrument (Z) Cause (X) Outcome (Y) Exclusion 73
Intuition: Can use this variation to compute causal effect 74
A generalized natural experiment: Instrumental Variables 75
Example: Effect of store recommendations 76
Traffic on normal days to App 1 77
External shock brings as-if random users to App 1 78
Exploiting sudden variation in traffic to App 1 79
Automatically Identifying Natural Experiments Split-Door Criterion • Finds 7, 000 natural experiments, instead of 133 • Result: Across 10 product categories, half of recommendation clicks would have happened anyway Sharma et al. Split-door criterion for causal identification: Automatic search for natural experiments, 2016
81
But there are so many natural variations. 82
83
What we just learned: Instrumental Variables Definition Instrumental variables (IV) introduce “as-if random” noise into treatment assignment, and are used to estimate treatment effect Intuition Examples Encouraging people to exercise at random. Sudden increase in page visits to a product. Keep in Mind Causal Estimate may not generalize to full population. Estimate very sensitive to the violations of IV assumptions.
As-if Random Part II. B. Natural Experiments Instrumental Variables Regression Discontinuities
Regression discontinuities: Look for arbitrary changes to treatment Instead of an IV changing the distribution of treatment over individuals, an arbitrary change decides the treatment deterministically. At time t, a cholesterol drug A is banned, and people switch to another drug B. What was the relative effect of drug A over B ? Cholesterol Due to selection effects, people taking drug A are different from those taking drug B. A Time But within [t-1, t+1] duration, patients of A and B can be assumed to be similar.
Regression discontinuities Cholesterol Below income threshold t, free health insurance. What is effect of health insurance on cholesterol? Due to selection effects, people with health insurance different from those without. Household Income But within [t-1, t+1] income, people with or without health insurance are similar.
Regression discontinuities also depend on asif-random and exclusion As-if-random: People near the threshold are similar to each other, as if Nature randomized them on either side of the threshold. Exclusion: Merely being on one side of the threshold does not affect the outcome. Very common: Many decisions in organizations, arbitrary decisions in software examples. Can be thought of as a special case of an instrumental variable.
Example: Effect of Store recommendations 89
Exploiting arbitrary cutoffs to recommendations 90
Assumption: Closely-ranked not-shown apps are as relevant as shown apps 91
Algorithm: Regression discontinuity 92
What we just learned: Regression Discontinuities Definition Regression discontinuities identify arbitrary boundaries between treated and untreated populations, measure treatment effect as difference in outcomes at the boundary Intuition Example Policy decisions based on income or time; exogenous shocks; and are all common sources of regression discontinuities Keep in mind Only estimates treatment effect at the boundary. Effect may vary elsewhere!
PART II. Methods for Causal Inference Observational Studies Natural Experiments Refutations
Causal inference is only possible with assumptions 95
(Step 1): Making explicit the difference between identification and estimation Why do observational studies fail? Most likely due to errors in identification. --Estimation is a statistical problem, relatively easy. 96
(Step 2): Explicitly represent your identifying and estimating assumptions. Identifying assumption: All the arrows missing in the causal graphical model. E. g. No other common cause exists -> Untestable in general. Estimating assumption: Overlap between treated and untreated population. Can be solved by collecting more data. 97
(Step 3): Refute your assumptions, and analyze your estimate’s sensitivity to violations Identifying assumption: All the arrows missing in the causal graphical model. E. g. No other common cause exists -> Untestable in general. -- What happens when another common cause exists? -- What happens when treatment is placebo? 98
To make these steps easy, we created Do. Why: a python library for causal inference Do. Why focuses attention on the assumptions required for causal inference. Provides estimation methods such as matching and IV so that you can focus on the identifying assumptions. -- Models assumptions explicitly using causal graphical model. -- Provides an easy way to test them (if possible) or analyze sensitivity to violations. Unifies all methods to yield four verbs for causal inference: -- Model -- Identify -- Estimate -- Refute 99
Do. Why: Sample causal inference analysis in 4 lines 100
Refutation 1: Add random variables to your model 101
Refutation check 2: Replace treatment by a placebo (A/A test) 102
Refutation Check 3: Divide data into subsets (cross-validation) 103
Refutation Check 4: Test Balance of Covariates 104
When refutations are not possible? Sensitivity Analysis to violations of assumptions
Example: Does smoking cause lung cancer? Demographics Smoking Genes Lung Cancer 106
Observational causal inference: Best practices 107
Try out Do. Why to see best practices in action Do. Why: A Python Library for Causal Inference Principled: Converts prior knowledge to a formal causal graph Simple: Automated analysis of many assumptions, one line of code for powerful causal inference algorithms Robust: Battery of tests to refute obtained estimates Modest: No estimate if the data is insufficient • Input: Observational data, Causal graph • Output: Causal effect between desired variables, “What-if” analysis Code: https: //github. com/Microsoft/dowhy Docs: http: //causalinference. gitlab. io/dowhy 108
PART I. Introduction to Counterfactual Reasoning PART II. Methods for Causal Inference PART III. Large-scale and Network Data PART IV. Broader Landscape