
Part 3 Diabetes Report Card Hb A 1
Part 3
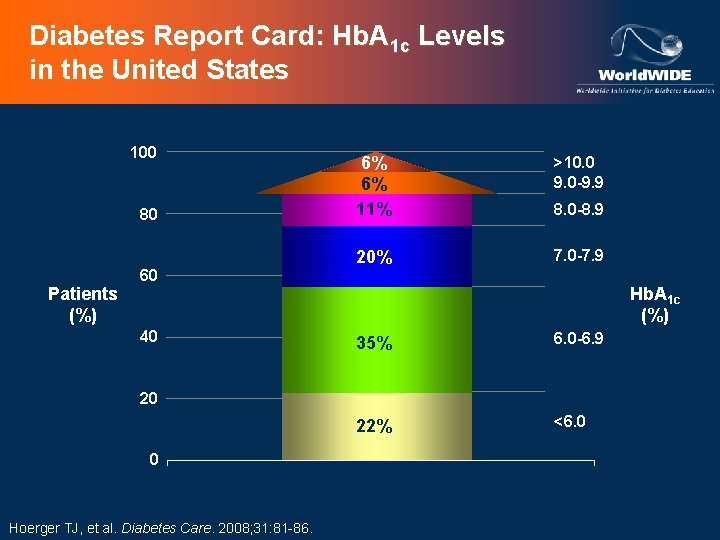
Diabetes Report Card: Hb. A 1 c Levels in the United States 100 80 Patients (%) 6% 6% 11% >10. 0 9. 0 -9. 9 20% 7. 0 -7. 9 8. 0 -8. 9 60 40 Hb. A 1 c (%) 35% 6. 0 -6. 9 22% <6. 0 20 0 Hoerger TJ, et al. Diabetes Care. 2008; 31: 81 -86.
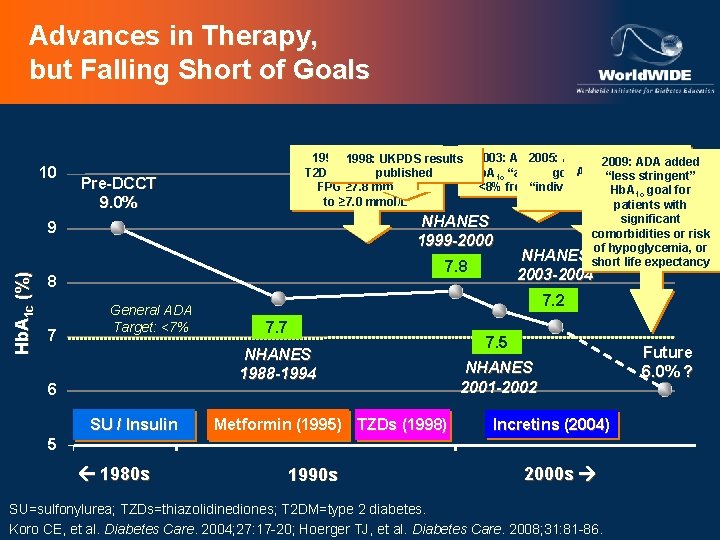
Advances in Therapy, but Falling Short of Goals 10 ACCORD, eliminated 1997: 1998: ADA lowered 2005: ADA 2008: added Hb. A UKPDS results 2003: ADA 1 c added 2009: ADA VADT, Hb. A 1 c “action point” T 2 DM diagnosis from goal. ADVANCE, ofof <6% for published “less stringent” and UKPDS 80 for <8% from“individual guidelines FPG ≥ 7. 8 mmol/L patients” to Hb. A 1 c goal published to ≥ 7. 0 mmol/L guidelines patients with significant NHANES comorbidities or risk 1999 -2000 of hypoglycemia, or NHANES short life expectancy 7. 8 Pre-DCCT 9. 0% Hb. A 1 c (%) 9 2003 -2004 8 7 General ADA Target: <7% 7. 2 7. 7 NHANES 1988 -1994 6 SU / Insulin Metformin (1995) TZDs (1998) 7. 5 NHANES 2001 -2002 Incretins (2004) 5 1980 s 1990 s 2000 s SU=sulfonylurea; TZDs=thiazolidinediones; T 2 DM=type 2 diabetes. Koro CE, et al. Diabetes Care. 2004; 27: 17 -20; Hoerger TJ, et al. Diabetes Care. 2008; 31: 81 -86. Future 6. 0% ?
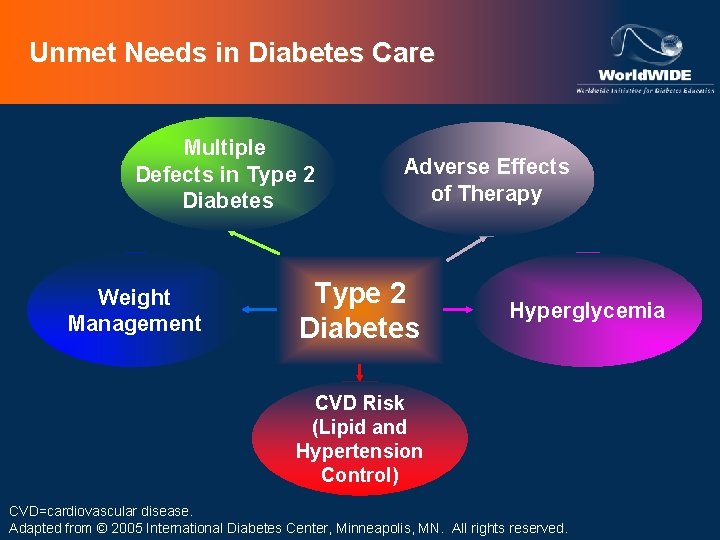
Unmet Needs in Diabetes Care Multiple Defects in Type 2 Diabetes Weight Management Adverse Effects of Therapy Type 2 Diabetes Hyperglycemia CVD Risk (Lipid and Hypertension Control) CVD=cardiovascular disease. Adapted from © 2005 International Diabetes Center, Minneapolis, MN. All rights reserved.
Relationship Between Hyperglycemia and Microvascular and Macrovascular Complications
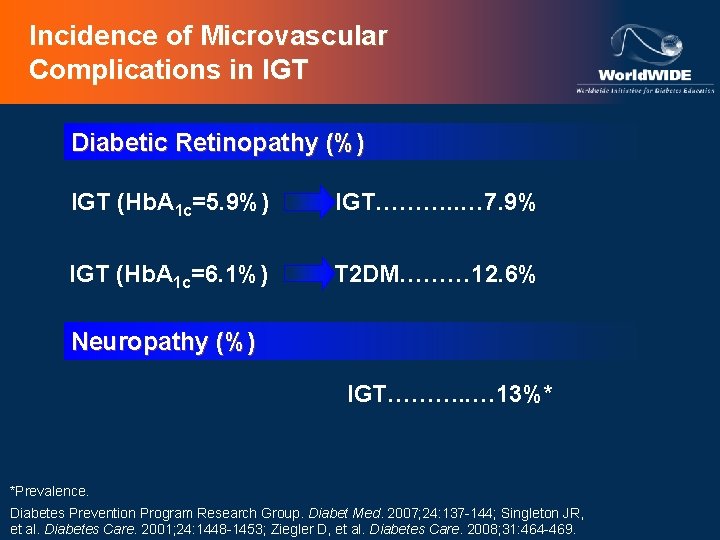
Incidence of Microvascular Complications in IGT Diabetic Retinopathy (%) IGT (Hb. A 1 c=5. 9%) IGT………. . … 7. 9% IGT (Hb. A 1 c=6. 1%) T 2 DM……… 12. 6% Neuropathy (%) IGT………. . … 13%* *Prevalence. Diabetes Prevention Program Research Group. Diabet Med. 2007; 24: 137 -144; Singleton JR, et al. Diabetes Care. 2001; 24: 1448 -1453; Ziegler D, et al. Diabetes Care. 2008; 31: 464 -469.
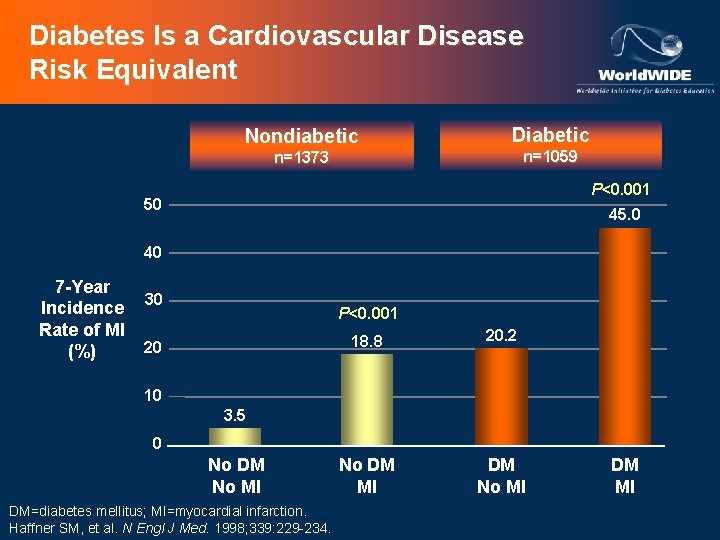
Diabetes Is a Cardiovascular Disease Risk Equivalent Nondiabetic Diabetic n=1059 n=1373 P<0. 001 50 45. 0 40 7 -Year Incidence Rate of MI (%) 30 P<0. 001 20 18. 8 20. 2 No DM MI DM No MI 10 3. 5 0 No DM No MI DM=diabetes mellitus; MI=myocardial infarction. Haffner SM, et al. N Engl J Med. 1998; 339: 229 -234. DM MI
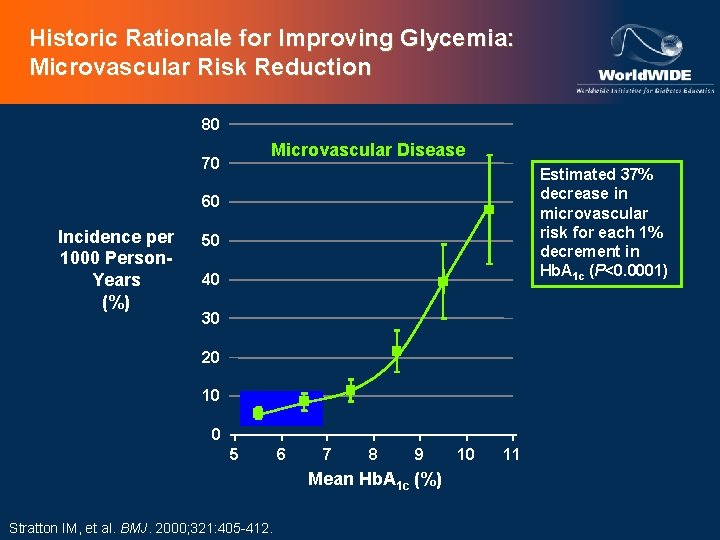
Historic Rationale for Improving Glycemia: Microvascular Risk Reduction 80 Microvascular Disease 70 Estimated 37% decrease in microvascular risk for each 1% decrement in Hb. A 1 c (P<0. 0001) 60 Incidence per 1000 Person. Years (%) 50 40 30 20 10 0 5 6 7 8 9 Mean Hb. A 1 c (%) Stratton IM, et al. BMJ. 2000; 321: 405 -412. 10 11
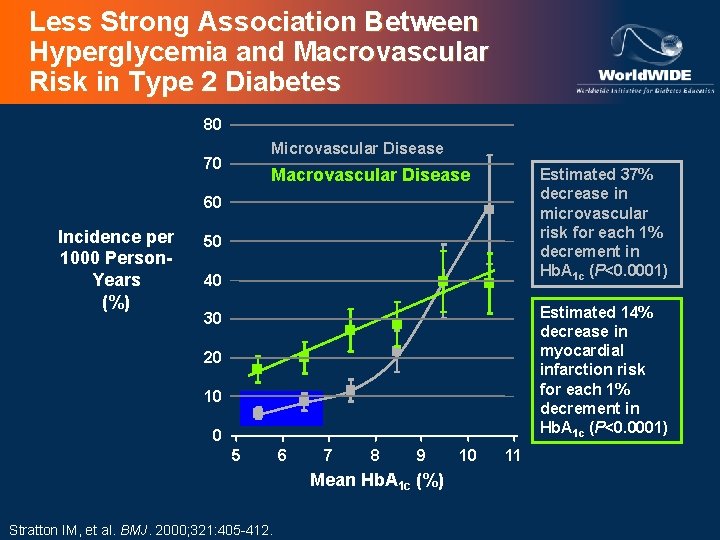
Less Strong Association Between Hyperglycemia and Macrovascular Risk in Type 2 Diabetes 80 Microvascular Disease 70 Macrovascular Disease Estimated 37% decrease in microvascular risk for each 1% decrement in Hb. A 1 c (P<0. 0001) 60 Incidence per 1000 Person. Years (%) 50 40 Estimated 14% decrease in myocardial infarction risk for each 1% decrement in Hb. A 1 c (P<0. 0001) 30 20 10 0 5 6 7 8 9 Mean Hb. A 1 c (%) Stratton IM, et al. BMJ. 2000; 321: 405 -412. 10 11
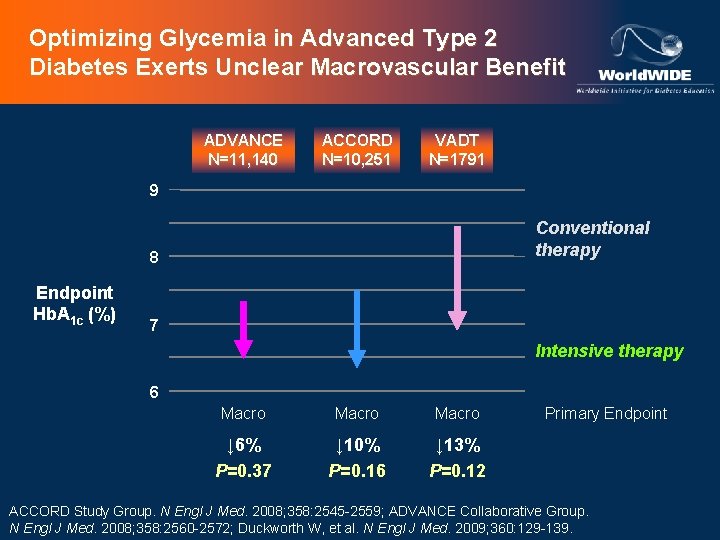
Optimizing Glycemia in Advanced Type 2 Diabetes Exerts Unclear Macrovascular Benefit ADVANCE N=11, 140 ACCORD N=10, 251 VADT N=1791 9 Conventional therapy 8 Endpoint Hb. A 1 c (%) 7 Intensive therapy 6 Macro ↓ 6% P=0. 37 ↓ 10% P=0. 16 ↓ 13% P=0. 12 Primary Endpoint ACCORD Study Group. N Engl J Med. 2008; 358: 2545 -2559; ADVANCE Collaborative Group. N Engl J Med. 2008; 358: 2560 -2572; Duckworth W, et al. N Engl J Med. 2009; 360: 129 -139.
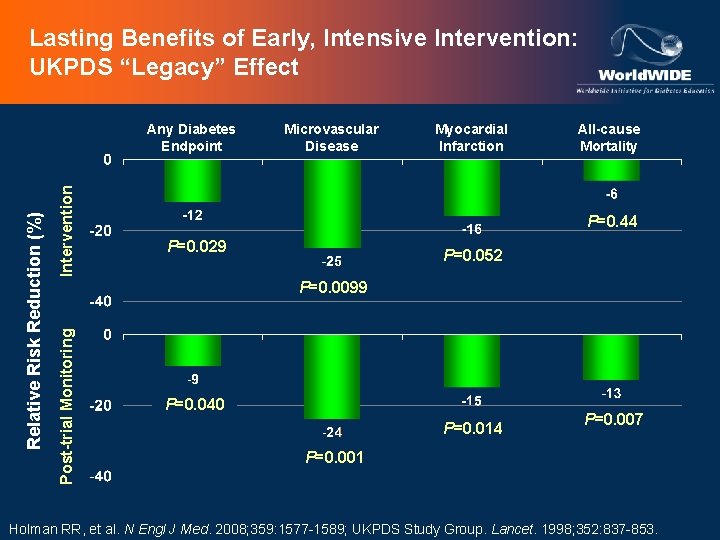
Lasting Benefits of Early, Intensive Intervention: UKPDS “Legacy” Effect Intervention Microvascular Disease Myocardial Infarction All-cause Mortality P=0. 44 P=0. 029 P=0. 052 P=0. 0099 Post-trial Monitoring Relative Risk Reduction (%) Any Diabetes Endpoint P=0. 040 P=0. 014 P=0. 007 P=0. 001 Holman RR, et al. N Engl J Med. 2008; 359: 1577 -1589; UKPDS Study Group. Lancet. 1998; 352: 837 -853.
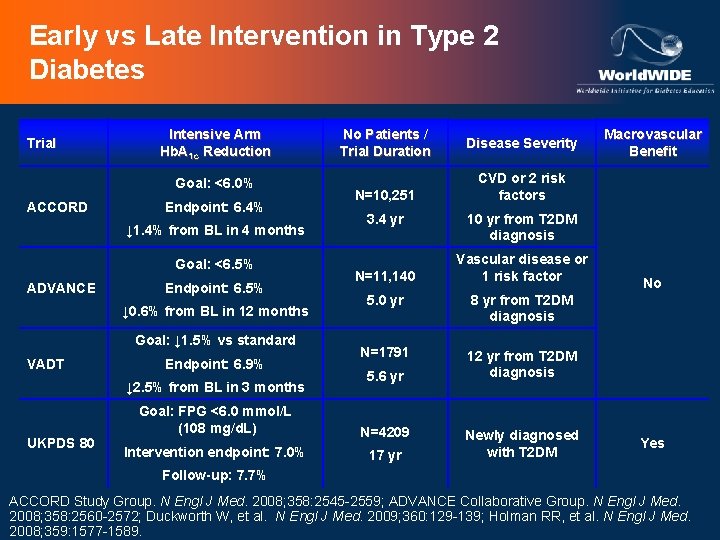
Early vs Late Intervention in Type 2 Diabetes Trial Intensive Arm Hb. A 1 c Reduction Goal: <6. 0% ACCORD Endpoint: 6. 4% ↓ 1. 4% from BL in 4 months Goal: <6. 5% ADVANCE Endpoint: 6. 5% ↓ 0. 6% from BL in 12 months Goal: ↓ 1. 5% vs standard VADT Endpoint: 6. 9% ↓ 2. 5% from BL in 3 months UKPDS 80 No Patients / Trial Duration N=10, 251 3. 4 yr N=11, 140 Disease Severity CVD or 2 risk factors 10 yr from T 2 DM diagnosis Vascular disease or 1 risk factor 5. 0 yr 8 yr from T 2 DM diagnosis N=1791 12 yr from T 2 DM diagnosis 5. 6 yr Goal: FPG <6. 0 mmol/L (108 mg/d. L) N=4209 Intervention endpoint: 7. 0% 17 yr Macrovascular Benefit Newly diagnosed with T 2 DM No Yes Follow-up: 7. 7% ACCORD Study Group. N Engl J Med. 2008; 358: 2545 -2559; ADVANCE Collaborative Group. N Engl J Med. 2008; 358: 2560 -2572; Duckworth W, et al. N Engl J Med. 2009; 360: 129 -139; Holman RR, et al. N Engl J Med. 2008; 359: 1577 -1589.
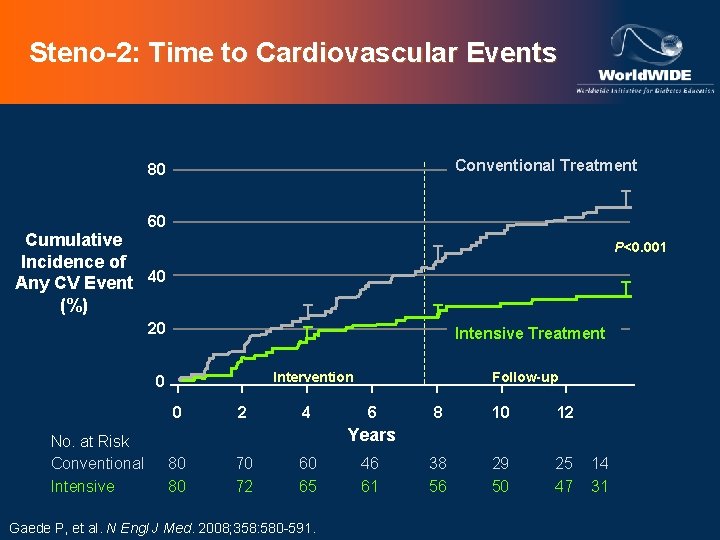
Steno-2: Time to Cardiovascular Events Conventional Treatment 80 60 Cumulative Incidence of Any CV Event 40 (%) P<0. 001 20 Intensive Treatment Intervention 0 0 No. at Risk Conventional Intensive 2 4 Follow-up 6 8 10 12 38 56 29 50 25 47 Years 80 80 70 72 60 65 Gaede P, et al. N Engl J Med. 2008; 358: 580 -591. 46 61 14 31
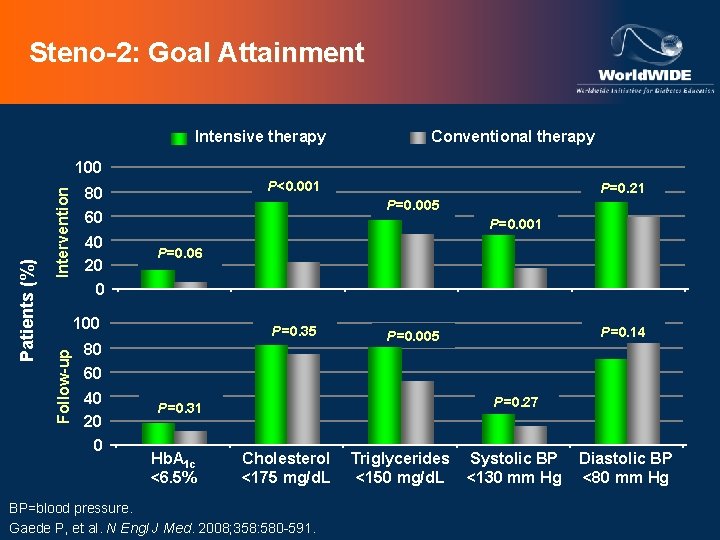
Steno-2: Goal Attainment Intensive therapy Conventional therapy Intervention P<0. 001 80 60 40 20 0 P=0. 001 P=0. 06 P=0. 35 80 60 40 20 0 P=0. 21 P=0. 005 100 Follow-up Patients (%) 100 P=0. 27 P=0. 31 Hb. A 1 c <6. 5% P=0. 14 P=0. 005 Cholesterol <175 mg/d. L BP=blood pressure. Gaede P, et al. N Engl J Med. 2008; 358: 580 -591. Triglycerides <150 mg/d. L Systolic BP <130 mm Hg Diastolic BP <80 mm Hg
- Slides: 14