Part 3 b Suggested methodologies Obtaining secondary data


Part 3 b Suggested methodologies

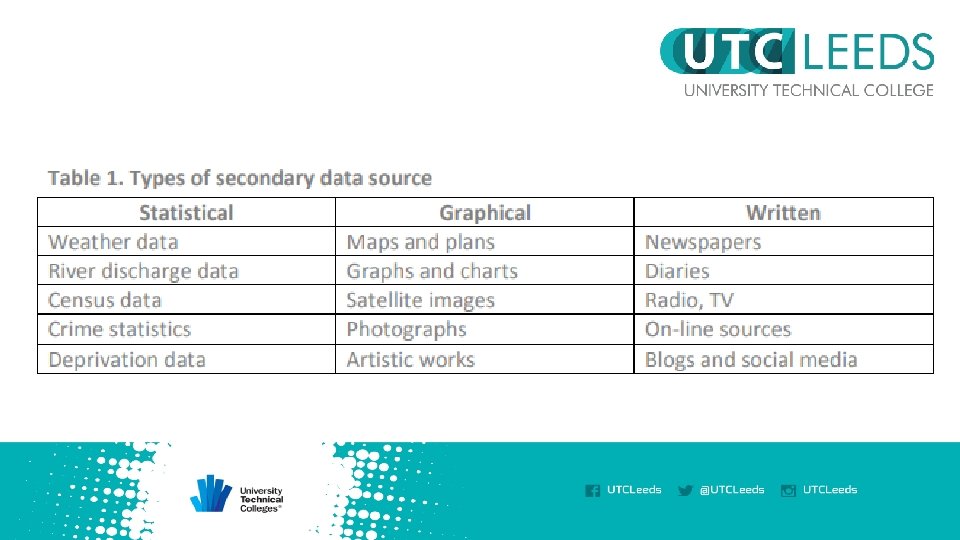
Obtaining secondary data

When collecting primary data, you control the method of data collection and the data is collected for a specific purpose e. g. the hypothesis or question you are investigating. This means any methodological mistakes, or obvious errors and anomalies can be identified, accounted for or corrected. Secondary data needs to be used with care because: • the data was collected for a different purpose • the methodology used may not always be clear • sample size, and thus reliability, might not be clear • data may contain errors, and these may not be obvious • data may be old and out-dated.

A very important part of using secondary research sources effectively is recording information about the source. During research it is easy to forget to do this (especially when using the internet), but it is important because: • the source may need to be found accessed again, to check details or get more information • sources may need to be stated (cited) in the fieldwork report or the bibliography.

Obtaining primary data

You will probably need elements of both in your work

Examples of methods that could be used in order to gather data for studies related to Contemporary Urban Environments or Changing Places

Land use survey record land use of each area on a large scale base map (1: 2500 or 1: 1250). Categories may include industry, retail, offices, housing, open space. Some might be subdivided eg housing type (terraced, semi detached, flats, bungalow etc) and age.

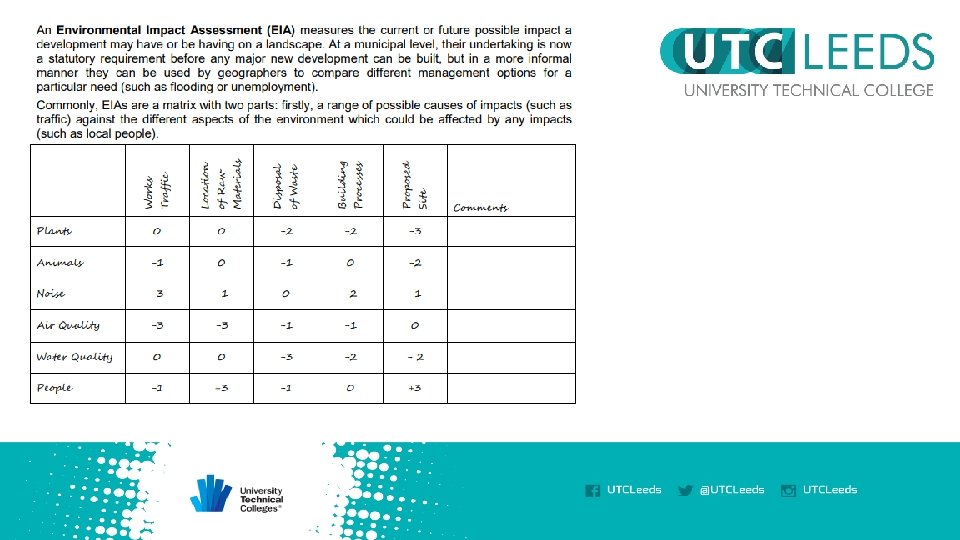
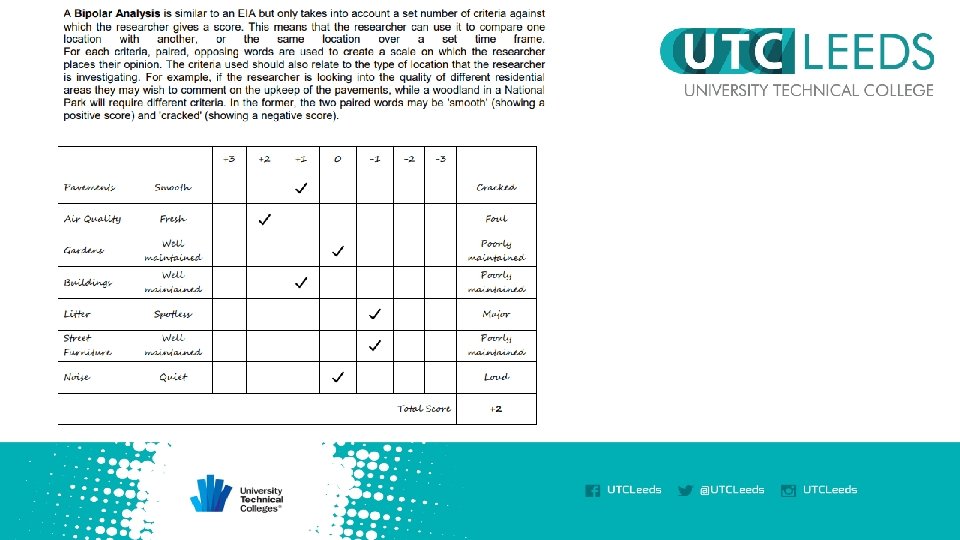
General landscape evaluation. Based on subjective observation, for example boring vs. stimulating, ugly versus attractive, crowded versus peaceful, threatening versus welcoming, drab versus colourful. An EQS can be used with indices or bi-polar scores. Students could combine this with photos that they take of the worst and the best images in each category. Include aesthetic quality of the built environment, for example architecture and design aspects.

Physical condition of buildings/index of decay. Range of options; none, little, some, much. Criteria: deterioration of walls, peeling paint, slipped tiles, broken glass, broken gutters, etc

Index of burgaralibility. Based on penalty points. Absence of burglar alarm, security cameras, metal bars on windows, metal shutters, neighbourhood watch sticker etc

Scale of visual pollution. Scores from zero to three: no pollution - badly polluted. Criteria might include, obviousness of pollution, litter, smalls, state of buildings, impact on surrounding area

Shopping survey. Looks at shopping quality and street appearance. Quality of shops: type, other land use, quality of goods, number of vacant units, etc. Street appearance: safety for pedestrians, crowdedness, street cleanliness, etc

Crime perception: surveys, questionnaires or indices e. g. a questionnaire for residents or observations in different urban areas of the burglar alarms, anti-crime features. This could be combined with some secondary crime data into an index for each output area.

Questionnaires: Could collect data about different aspects of quality of life or from different stakeholder groups e. g. views on community cohesion, do people eat 5 -a day, safety perception crime / traffic / pollution etc.

Services surveys: e. g. libraries, post-offices, pub, doctors surgeries etc.

Transport index: create an index which combines the frequency, length and cost of public transport to main service provision. Record transport ease/variety/quality.

Car Age Survey: for each of the cars parked in a survey area record its age – by taking a mean, the average of the cars in an area can be worked out.

Noise surveys might give additional information on environmental conditions. Using an app such as Sound Meter or Decibel 10 th, measure the sound level within each area in d. B.

Vandalism Audit: Subdivide vandalism into different types, e. g. graffiti, damage to bus shelters, dumped litter etc. then map locations in which these were found, as well as an assessment of the severity of the vandalism

Extended interviews: for example with groups who might have set-up renewal projects, youth projects, sports facilities etc.

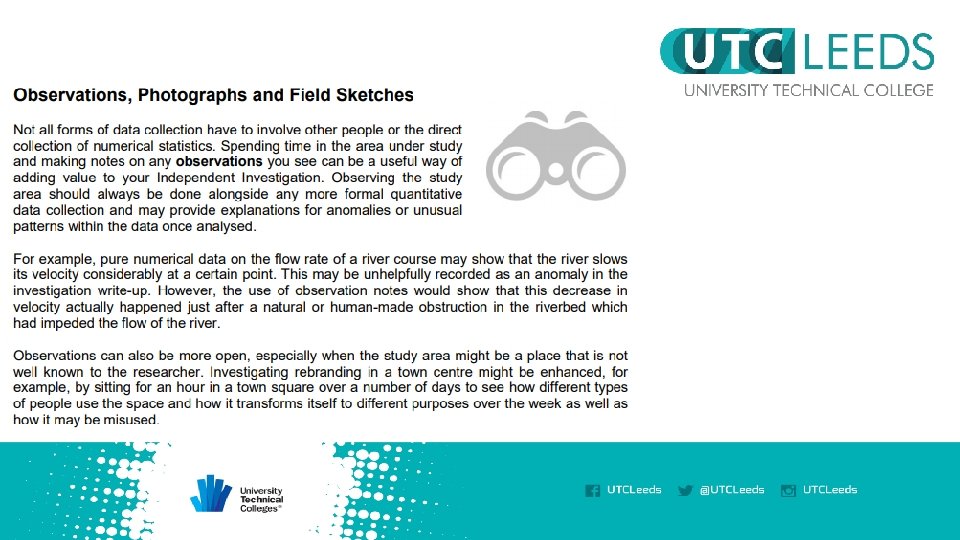
Photographic evidence: Photos could be taken of the various areas within the region and annotated to take note of the building / environment / traffic / people / services / renewal schemes / upkeep etc. Or perhaps a photo that students think sums up the area – socially or economically.

Green Space Survey: This could include mapping the green spaces available, as well as assessing their accessibility, economically or perhaps socially.
- Slides: 29