Part 3 Advanced Dynamic Analysis Chapter 8 Debugging
Part 3: Advanced Dynamic Analysis Chapter 8: Debugging Chapter 9: Olly. Dbg
Chapter 8: Debugging
Debugger Hardware or software used to examine execution of another program Disassembler: static snapshot of what code looks like before execution Debugger: dynamic snapshot of what code does during execution
Types of debuggers Source-level Debug while coding Map machine execution to corresponding source code lines Allow setting of breakpoints at source-code lines Assembly-level Strictly operate at machine instruction level Main debugger used for malware
Types of debuggers User mode Debug one program via another program all in user space Examples: Olly. Dbg, gdb Kernel mode Debugging a kernel requires a second machine Must configure target OS to allow kernel debugging Examples: Win. Dbg
Debugging functions Single stepping One machine instruction or source line at a time Stepping-over: calls to functions executed all at once before control returned to debugger (next instruction) Stepping-into: calls to functions followed (enters callee) one machine instruction at a time (step instruction) Stepping-out: execute until return back to calling function (finish)
Debugging functions Breakpoints (software) Set at virtual memory address of instruction or at source line Allows one to examine the state of the machine at critical execution points File creation (Listing 8 -4, Figure 8 -1, p. 171 -172, Loc. 4373, 4388) Encryption (Listing 8 -5, Figure 8 -2, p. 172 -173, Loc. 4399, 4414) Implemented by overwriting INT 3 (0 xcc) into opcode of instruction (Table 8 -1, p. 174, Loc. 4425) Debugger restores overwritten byte upon continue
Debugging functions Hardware execution breakpoints Dedicated registers that store virtual addresses Can be set to break on access, rather than on execution Memory watchpoints on data (reads or writes) 4 hardware registers (DR 0 -DR 3) Can be modified by running program! Malware can disable them Counter-measure is “General Detect” flag in DR 7 that triggers a breakpoint on any mov involving debug registers
Debugging functions Conditional software execution breakpoints Break only if a certain condition is met Example Break on Get. Proc. Address function only if address parameter is Reg. Set. Value Implemented as normal software breakpoint, but debugger checks condition and automatically continues if not met
Handling exceptions Exceptions pass control to debugger INT 3, Trap flag in FLAGS register, Division by 0, invalid memory access Problem Might interfere with exception handlers that program needs to run What if my malware is embedded in an INT 3 handler? First-chance and second-chance exceptions Debugger (if attached) gets first-chance control If debugger does not want it, program allowed to handle exception If program does not handle exception and would crash, debugger gets a second-chance to handle exception Malware may intentionally trigger first-chance exceptions to determine environment
Modifying execution Skip functions by changing EIP directly Invoke functions directly on arguments you choose Useful in debugging metamorphic malware Malware programmed to behave differently under different circumstances (e. g. when being debugged, when in a VM, or when located in a nuclear enrichment facility) Debugger can be set to trace branches of metamorphic code Locale-based metamorphism (Listing 8 -6, p. 177, Loc 4535)

Chapter 9: Olly. Dbg
Olly. Dbg Developed by Oleh Yuschuk Debugger of choice for malware analysis *and* exploit developers Many still use Olly. Dbg 1. 1. Olly. Dbg 2. 0 also available. 32 -bit only Purchased by Immunity and forked as Immunity Debugger Python API support added Also free
Loading code in Olly. Dbg Open executable from within Olly. Dbg In-class exercise Launch Olly. Dbg and use File=>Open to recreate (Figure 9 -2, p. 181, Loc. 4601) for C: WINDOWSnotepad. exe 4 main windows of Olly. Dbg Disassembler, Registers, Stack, Memory dump
Loading code in Olly. Dbg Launch executable and attach In-class exercise Launch notepad. exe from Olly. Dbg Attach Olly. Dbg to running notepad Use the View tools to list memory, recreating (Figure 9 -4, p. 183) for notepad. exe
Rebasing Memory locations of Figure 9 -4 dynamic Relocatable code allows libraries to be rebased Enables libraries to be written independent of each other Absolute address references modified at load time via. reloc information in PE header Supports ASLR to thwart malware In-class exercise (Windows 7 only) Note the location of notepad's. text section Relaunch Olly. Dbg on notepad again What is the location now?
Threads Most programs and malware multi-threaded In-class exercise Launch Internet Explorer Attach Olly. Dbg View threads via View>Threads How many threads are there?
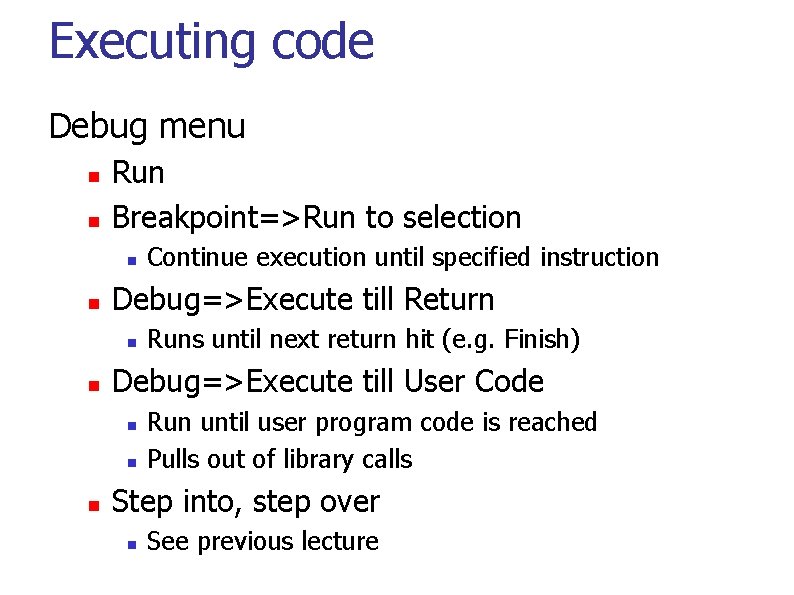
Executing code Debug menu Run Breakpoint=>Run to selection Debug=>Execute till Return Runs until next return hit (e. g. Finish) Debug=>Execute till User Code Continue execution until specified instruction Run until user program code is reached Pulls out of library calls Step into, step over See previous lecture
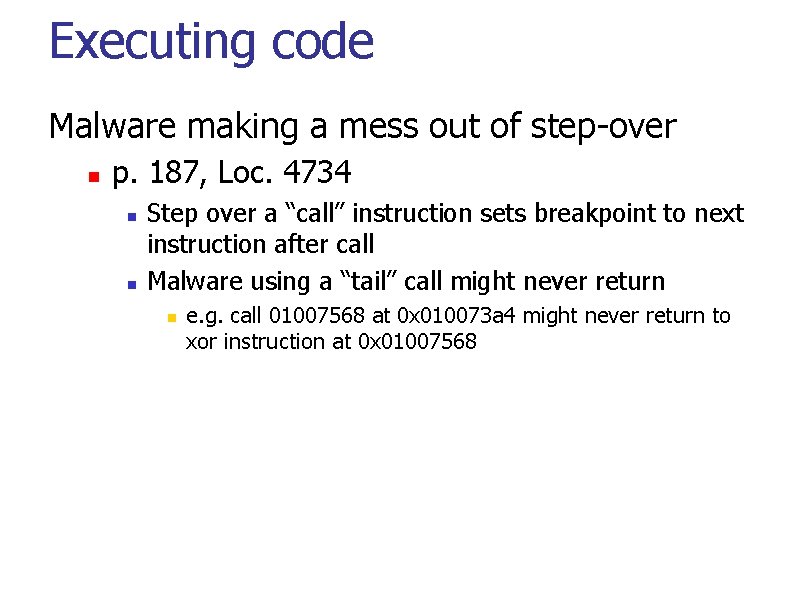
Executing code Malware making a mess out of step-over p. 187, Loc. 4734 Step over a “call” instruction sets breakpoint to next instruction after call Malware using a “tail” call might never return e. g. call 01007568 at 0 x 010073 a 4 might never return to xor instruction at 0 x 01007568
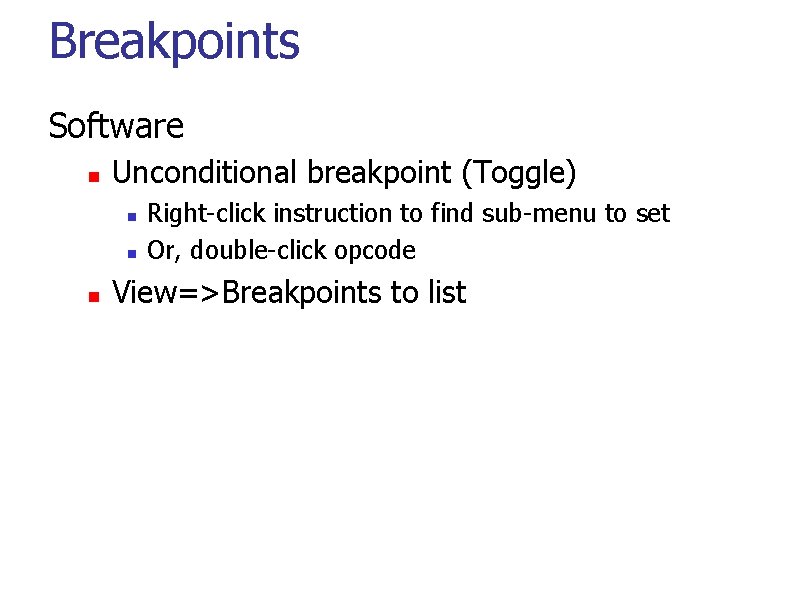
Breakpoints Software Unconditional breakpoint (Toggle) Right-click instruction to find sub-menu to set Or, double-click opcode View=>Breakpoints to list
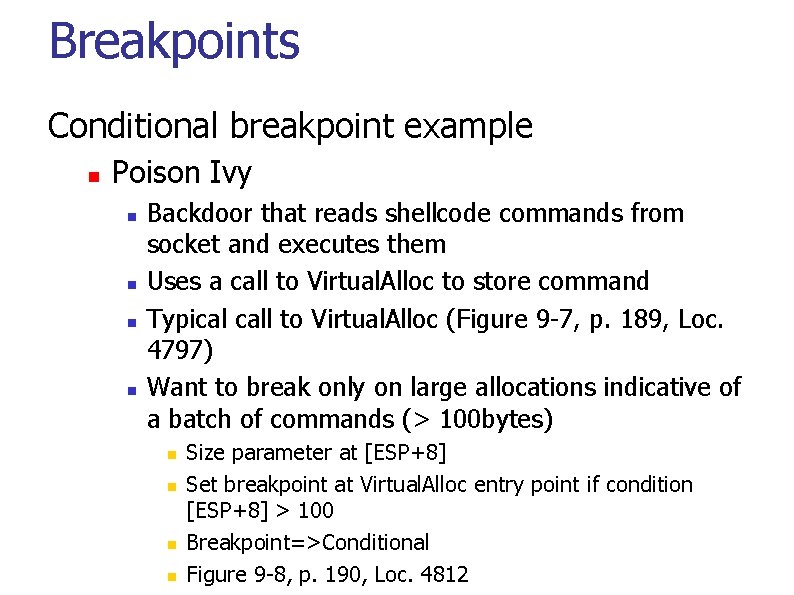
Breakpoints Conditional breakpoint example Poison Ivy Backdoor that reads shellcode commands from socket and executes them Uses a call to Virtual. Alloc to store command Typical call to Virtual. Alloc (Figure 9 -7, p. 189, Loc. 4797) Want to break only on large allocations indicative of a batch of commands (> 100 bytes) Size parameter at [ESP+8] Set breakpoint at Virtual. Alloc entry point if condition [ESP+8] > 100 Breakpoint=>Conditional Figure 9 -8, p. 190, Loc. 4812
Breakpoints Conditional breakpoints In Olly. Dbg with notepad. exe Right-click and add condition (ecx == 0 x. FFFF) View=>Breakpoints (to list) Hardware Memory breakpoint (on execution, access, write) Right-click location in memory window Debug => Hardware breakpoints (to list)
Loading DLLs Malware often delivered as DLLs to be injected into other processes Olly. Dbg uses loaddll. exe as dummy program Calls into Dll. Main function of target DLL In-class exercise Generate Figure 9 -10, p. 191, Loc. 4856 Open C: WINDOWSsystem 32ws 2_32. dll in Olly. Dbg(32 bit only) Hit play to initialize DLL Debug=>Call DLL export to call a particular exported function with custom parameters Disassembler window automatically updates with disassembled code
Tracing Recording execution Call Stack Trace Open notepad. exe and run View => Call Stack Compact view the function call path that has led to your current execution point
Tracing Recording execution Run Trace Olly. Dbg saves every executed instruction and all changes to registers and flags In-class: Try tracing on a lab binary Highlight code to trace Run Trace=>Add Selection Execute View=>Run Trace Go to red-highlighted traced instructions - and + to navigate trace and see changes Or use “Trace Into” and “Trace Over” options to run trace until next breakpoint Take care to limit size of trace
Tracing Poison Ivy backdoor example Virtual. Alloc to store commands from C&C server Stored in heap memory EIP executes from heap locations Goal: Begin tracing when EIP points to heap Step #1: Use Debug=>Set condition to set condition to pause on EIP outside of program segment (Figure 9 -11, p. 194, Loc. 4906) Step #2: Trace Into to execute until condition met Step #3: Use – key to backup execution to see where entry into shellcode occurred
Exceptions Exception handling with Olly. Dbg User options Step into exception Step over exception Run debugger exception handler Can also set in Debugging Options to ignore all exceptions (immediately transfer control back to program)
Patching Modifying program instructions to change behavior In class In Olly. Dbg, modify conditional branch within Lab 3 -4 to bypass filename check that deletes file NOP out call to Shell. Execute At 0 x 04024 EE => Right-click, Binary=>Edit, Fill with NOPs Copy modifications to new executable via Olly. Dump (see next slide)
Dumping Create new binary upon unpacking program Olly. Dump plug-in Find entry point after unpacking and decryption operations of malware performed Creates a new executable that can be analyzed within IDA Pro Figure 9 -16, p. 198, Loc. 4991
Chapter 9. 5: Other debuggers
gdb (the ancient one) CTF levels for teaching the tool gdb –tui
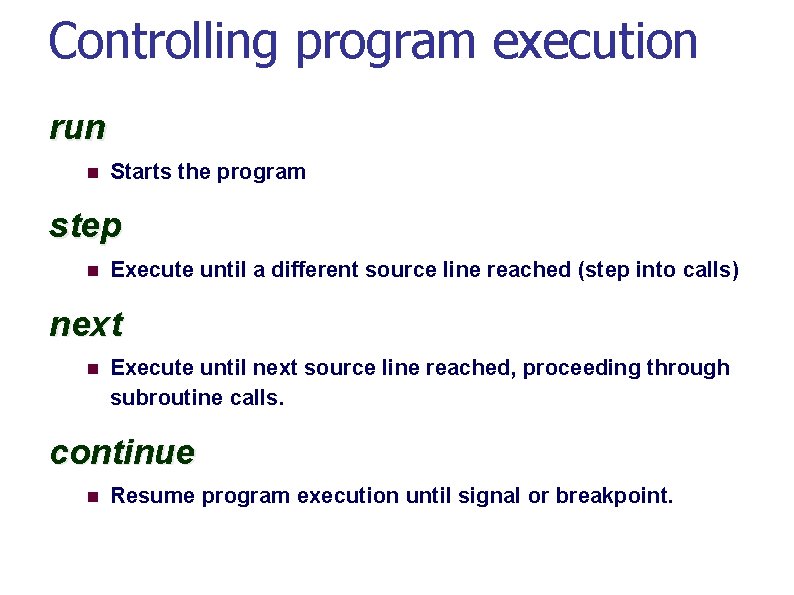
Controlling program execution run Starts the program step Execute until a different source line reached (step into calls) next Execute until next source line reached, proceeding through subroutine calls. continue Resume program execution until signal or breakpoint.
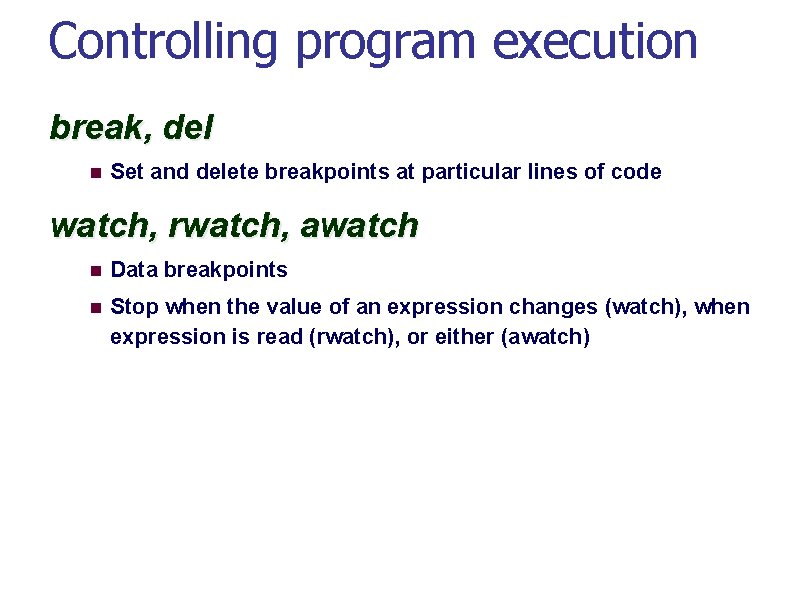
Controlling program execution break, del Set and delete breakpoints at particular lines of code watch, rwatch, awatch Data breakpoints Stop when the value of an expression changes (watch), when expression is read (rwatch), or either (awatch)
![Displaying data print Print expression Basic print argv[0] print $rsp print /x addr ‘/x’ Displaying data print Print expression Basic print argv[0] print $rsp print /x addr ‘/x’](http://slidetodoc.com/presentation_image_h2/5f3a396f705ec4ac58b8a215f33ebe48/image-34.jpg)
Displaying data print Print expression Basic print argv[0] print $rsp print /x addr ‘/x’ says to print in hex. See “help x” for more formats Same as examine memory address command (x) printf “format string” arg-list (gdb) printf "%sn", argv[0] x (examine) Examine memory x /s $rax => print the string at address contained in %rax x /32 xw 0 x 4006 b 7 => print 32 words at 0 x 4006 b 7 in hexadecimal
Displaying code disassemble <fn> Disassemble specific function fn or bytes at an address
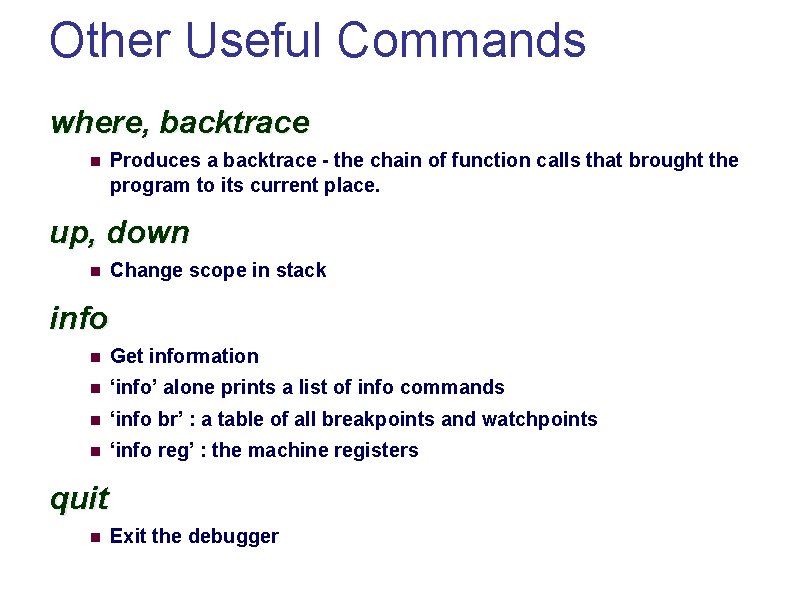
Other Useful Commands where, backtrace Produces a backtrace - the chain of function calls that brought the program to its current place. up, down Change scope in stack info Get information ‘info’ alone prints a list of info commands ‘info br’ : a table of all breakpoints and watchpoints ‘info reg’ : the machine registers quit Exit the debugger
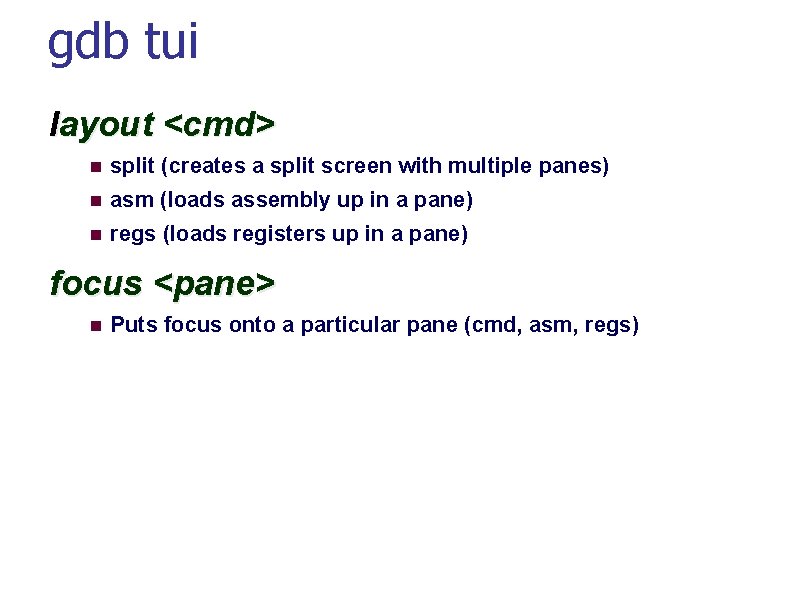
gdb tui layout <cmd> split (creates a split screen with multiple panes) asm (loads assembly up in a pane) regs (loads registers up in a pane) focus <pane> Puts focus onto a particular pane (cmd, asm, regs)
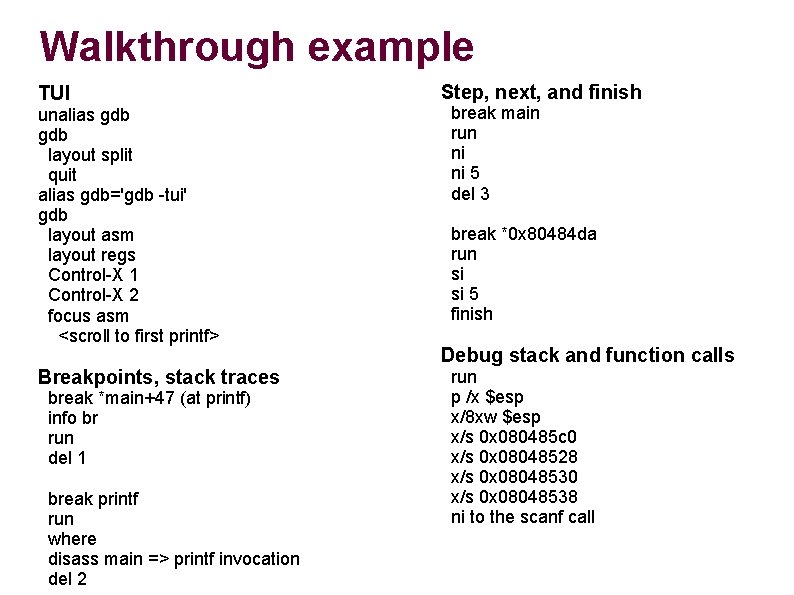
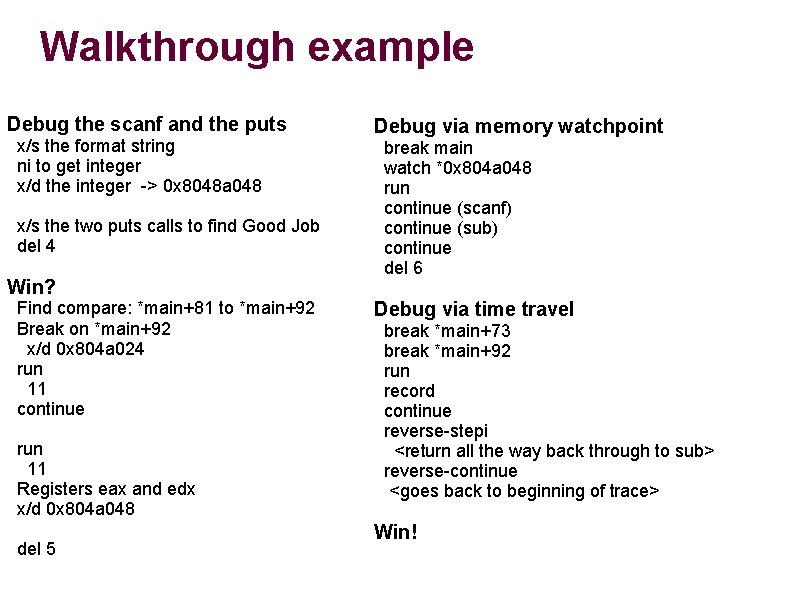
Walkthrough example TUI unalias gdb layout split quit alias gdb='gdb -tui' gdb layout asm layout regs Control-X 1 Control-X 2 focus asm <scroll to first printf> Breakpoints, stack traces break *main+47 (at printf) info br run del 1 break printf run where disass main => printf invocation del 2 Step, next, and finish break main run ni ni 5 del 3 break *0 x 80484 da run si si 5 finish Debug stack and function calls run p /x $esp x/8 xw $esp x/s 0 x 080485 c 0 x/s 0 x 08048528 x/s 0 x 08048530 x/s 0 x 08048538 ni to the scanf call
Walkthrough example Debug the scanf and the puts x/s the format string ni to get integer x/d the integer -> 0 x 8048 a 048 x/s the two puts calls to find Good Job del 4 Win? Find compare: *main+81 to *main+92 Break on *main+92 x/d 0 x 804 a 024 run 11 continue run 11 Registers eax and edx x/d 0 x 804 a 048 del 5 Debug via memory watchpoint break main watch *0 x 804 a 048 run continue (scanf) continue (sub) continue del 6 Debug via time travel break *main+73 break *main+92 run record continue reverse-stepi <return all the way back through to sub> reverse-continue <goes back to beginning of trace> Win!
PEDA Python Exploit Development Assistance for GDB https: //github. com/longld/peda
rr (deterministic replay via gdb) Record all CPU state at system calls Allow debugger to go back in time and play forward Can get to any process state Used for debugging browser crashes deterministically Must run on bare metal to get access to hardware debug registers
QIRA (deterministic replay via QEMU) Timeless debugging Record the entire program trace at emulator or VM level George Hotz, Enigma 2016 https: //youtu. be/e. Gl 6 kp. Sajag? t=255 4: 15 -12: 22 Use if you’d like (can do CTF level on it)
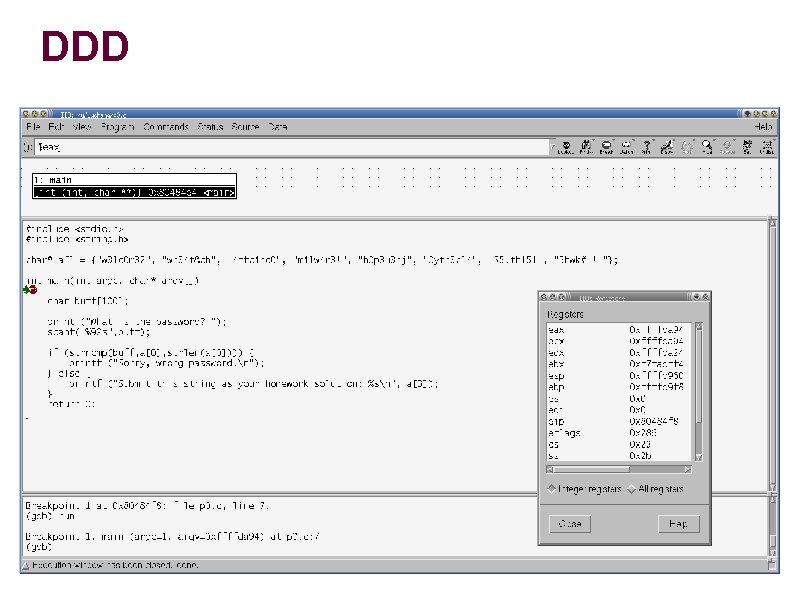
DDD
radare 2 Similar to gdb, but with an IDA Pro-like disassembler included CTF levels for teaching the tool radare 2: gdb akin to Unix: Windows r 2 <binary> For using it as a disassembler r 2 –d <binary> For running it in the debugger
Binary Ninja Lifts binary to a family of intermediate languages similar to LLVM or bytecode Binary Ninja Intermediate Language (BNIL) But with flexibility in what is abstracted (multistage vs. single-stage) Tool works on IL If you like this kind of stuff…. Sophia d’Antoine INFILTRATE 2017 https: //vimeo. com/215511922

In-class exercise Lab 9 -2
- Slides: 46