Part 2 Measurement Techniques Part 2 Measurement Techniques

![Traceroute: Sample Output <chips [ ~ ]>traceroute degas. eecs. berkeley. edu traceroute to robotics. Traceroute: Sample Output <chips [ ~ ]>traceroute degas. eecs. berkeley. edu traceroute to robotics.](https://slidetodoc.com/presentation_image/1c6a30483a75e1ef98f1b141f94105d8/image-32.jpg)
![Inference from End-to-End Measurements • Capacity of bottleneck link [Bolot 93] – Basic observation: Inference from End-to-End Measurements • Capacity of bottleneck link [Bolot 93] – Basic observation:](https://slidetodoc.com/presentation_image/1c6a30483a75e1ef98f1b141f94105d8/image-42.jpg)
- Slides: 64

Part 2 Measurement Techniques

Part 2: Measurement Techniques • • • Terminology and general issues Active performance measurement SNMP and RMON Packet monitoring Flow measurement Traffic analysis

Terminology and General Issues

Terminology and General Issues • • Measurements and metrics Collection of measurement data Data reduction techniques Clock issues

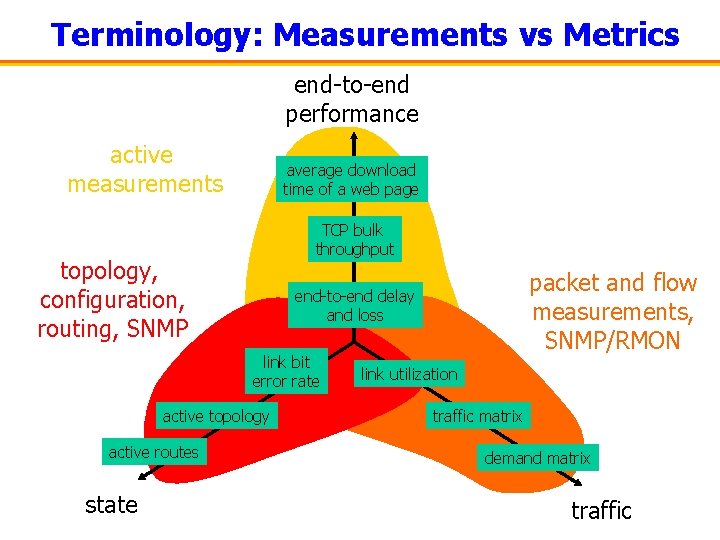
Terminology: Measurements vs Metrics end-to-end performance active measurements average download time of a web page TCP bulk throughput topology, configuration, routing, SNMP link bit error rate active topology active routes state packet and flow measurements, SNMP/RMON end-to-end delay and loss link utilization traffic matrix demand matrix traffic

Collection of Measurement Data • Need to transport measurement data – Produced and consumed in different systems – Usual scenario: large number of measurement devices, small number of aggregation points (databases) – Usually in-band transport of measurement data • low cost & complexity • Reliable vs. unreliable transport – Reliable • better data quality • measurement device needs to maintain state and be addressable – Unreliable • additional measurement uncertainty due to lost measurement data • measurement device can “shoot-and-forget”

Controlling Measurement Overhead • Measurement overhead – In some areas, could measure everything – Information processing not the bottleneck – Examples: geology, stock market, . . . – Networking: thinning is crucial! • Three basic methods to reduce measurement traffic: – Filtering – Aggregation – Sampling –. . . and combinations thereof

Filtering • Examples: – Only record packets. . . • matching a destination prefix (to a certain customer) • of a certain service class (e. g. , expedited forwarding) • violating an ACL (access control list) • TCP SYN or RST packets (attacks, abandoned http download)

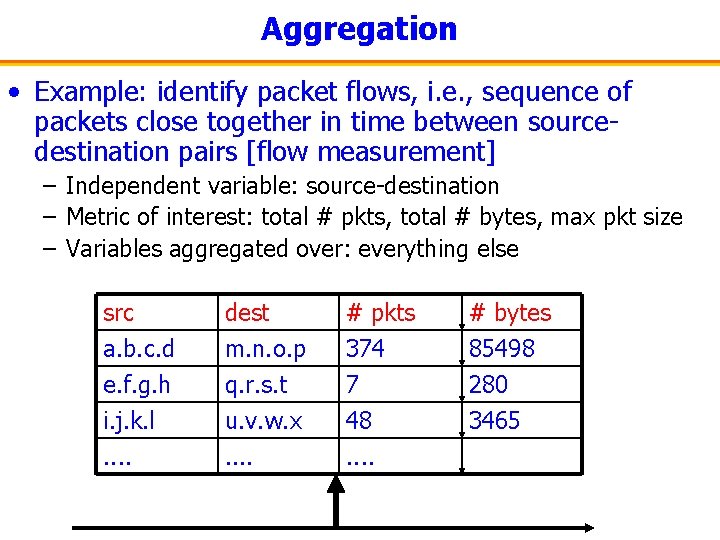
Aggregation • Example: identify packet flows, i. e. , sequence of packets close together in time between sourcedestination pairs [flow measurement] – Independent variable: source-destination – Metric of interest: total # pkts, total # bytes, max pkt size – Variables aggregated over: everything else src a. b. c. d e. f. g. h i. j. k. l dest m. n. o. p q. r. s. t u. v. w. x # pkts 374 7 48 . . . # bytes 85498 280 3465

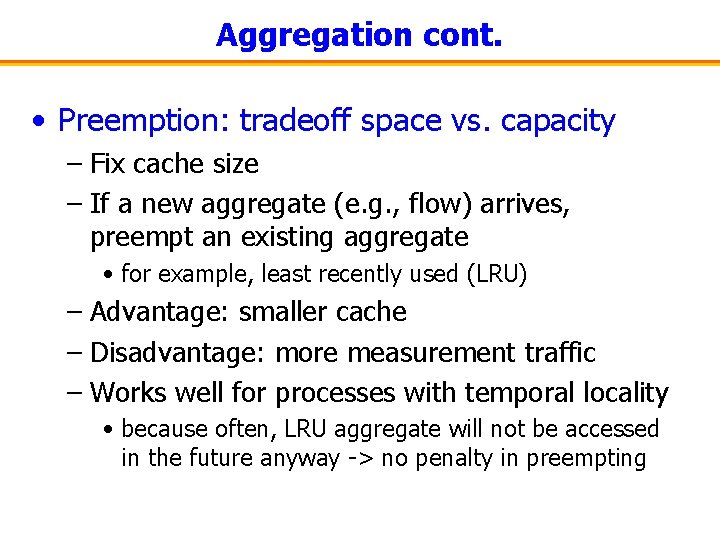
Aggregation cont. • Preemption: tradeoff space vs. capacity – Fix cache size – If a new aggregate (e. g. , flow) arrives, preempt an existing aggregate • for example, least recently used (LRU) – Advantage: smaller cache – Disadvantage: more measurement traffic – Works well for processes with temporal locality • because often, LRU aggregate will not be accessed in the future anyway -> no penalty in preempting

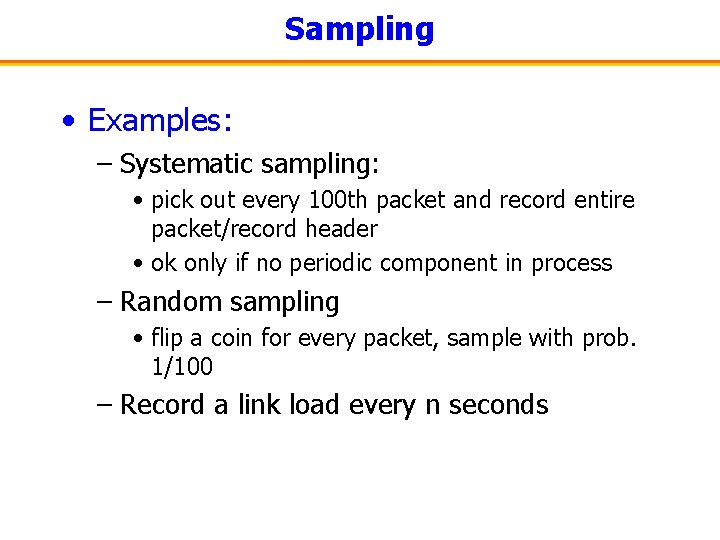
Sampling • Examples: – Systematic sampling: • pick out every 100 th packet and record entire packet/record header • ok only if no periodic component in process – Random sampling • flip a coin for every packet, sample with prob. 1/100 – Record a link load every n seconds

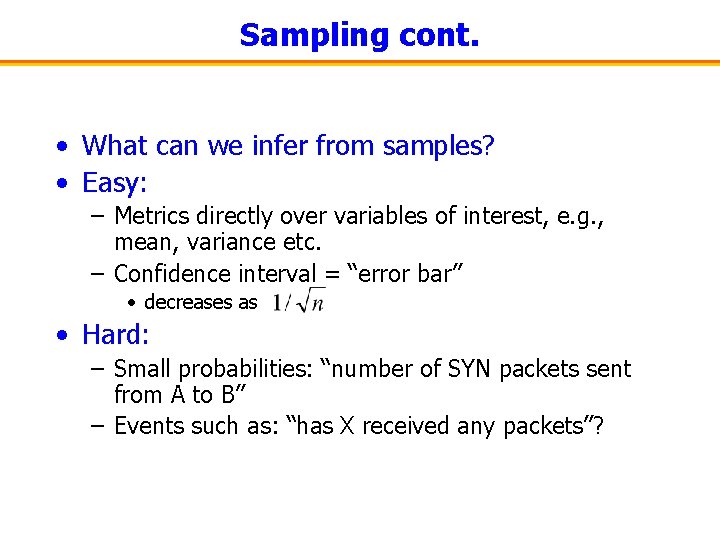
Sampling cont. • What can we infer from samples? • Easy: – Metrics directly over variables of interest, e. g. , mean, variance etc. – Confidence interval = “error bar” • decreases as • Hard: – Small probabilities: “number of SYN packets sent from A to B” – Events such as: “has X received any packets”?

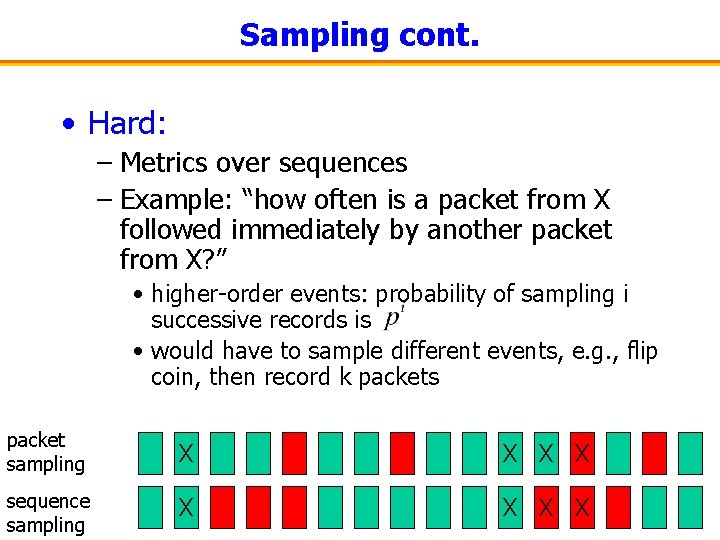
Sampling cont. • Hard: – Metrics over sequences – Example: “how often is a packet from X followed immediately by another packet from X? ” • higher-order events: probability of sampling i successive records is • would have to sample different events, e. g. , flip coin, then record k packets packet sampling X X sequence sampling X X

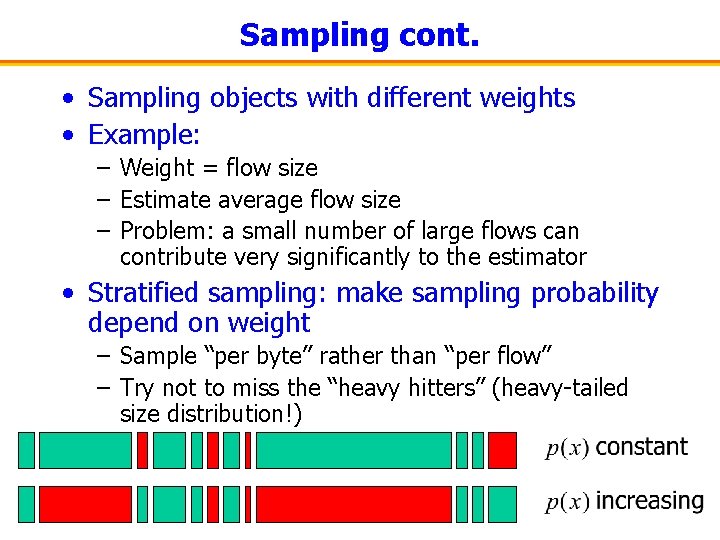
Sampling cont. • Sampling objects with different weights • Example: – Weight = flow size – Estimate average flow size – Problem: a small number of large flows can contribute very significantly to the estimator • Stratified sampling: make sampling probability depend on weight – Sample “per byte” rather than “per flow” – Try not to miss the “heavy hitters” (heavy-tailed size distribution!)

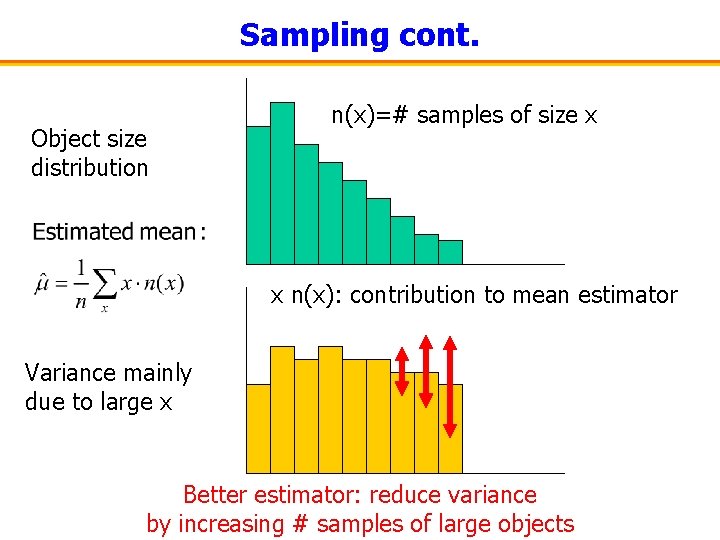
Sampling cont. Object size distribution n(x)=# samples of size x x n(x): contribution to mean estimator Variance mainly due to large x Better estimator: reduce variance by increasing # samples of large objects

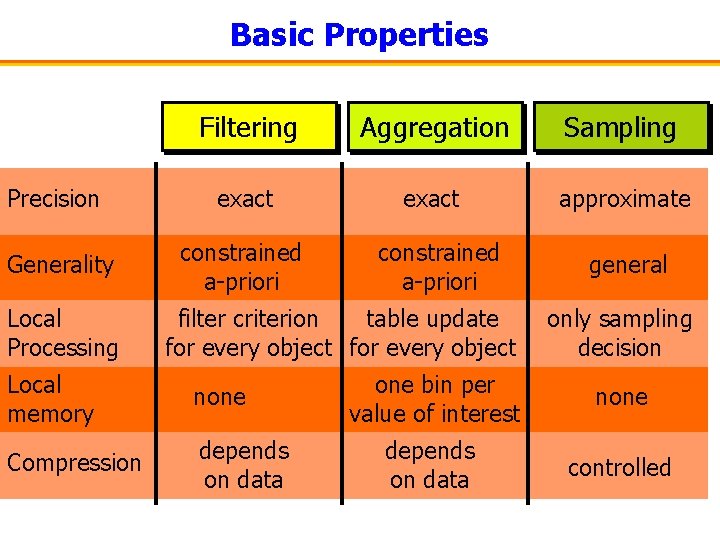
Basic Properties Filtering Aggregation Sampling Precision exact approximate Generality constrained a-priori Local Processing constrained a-priori filter criterion table update for every object Local memory none Compression depends on data general only sampling decision one bin per value of interest none depends on data controlled

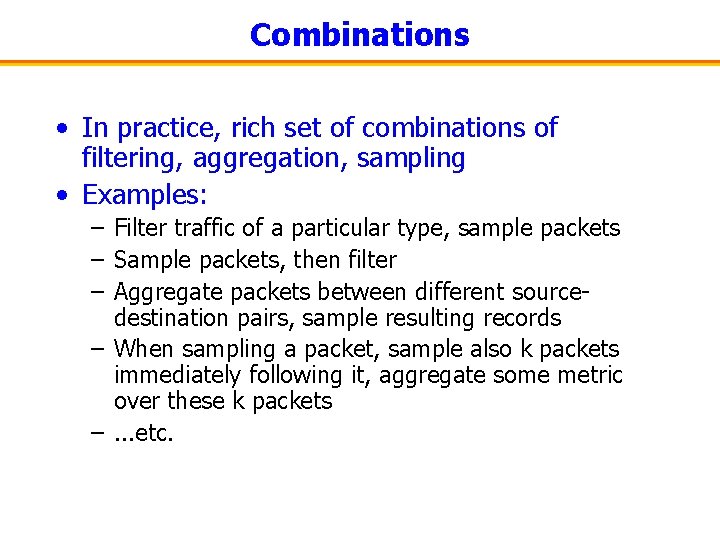
Combinations • In practice, rich set of combinations of filtering, aggregation, sampling • Examples: – Filter traffic of a particular type, sample packets – Sample packets, then filter – Aggregate packets between different sourcedestination pairs, sample resulting records – When sampling a packet, sample also k packets immediately following it, aggregate some metric over these k packets –. . . etc.

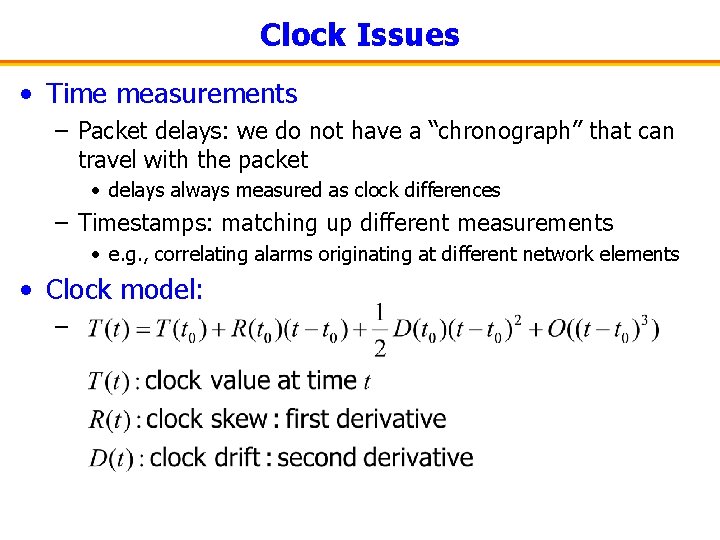
Clock Issues • Time measurements – Packet delays: we do not have a “chronograph” that can travel with the packet • delays always measured as clock differences – Timestamps: matching up different measurements • e. g. , correlating alarms originating at different network elements • Clock model: –

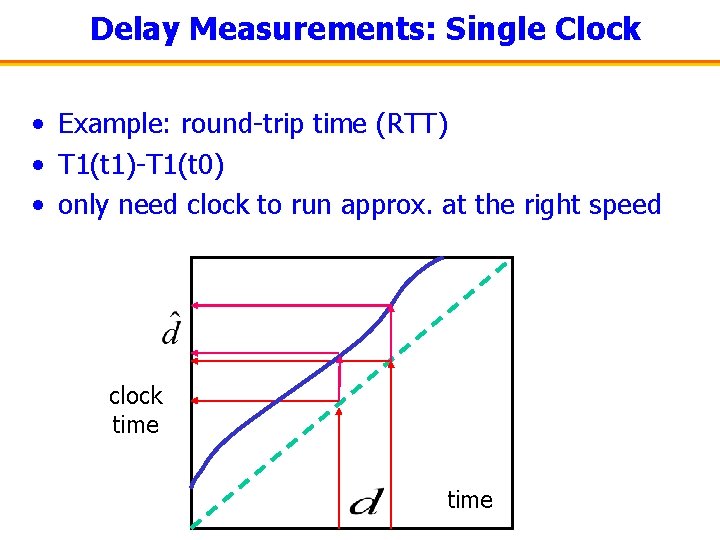
Delay Measurements: Single Clock • Example: round-trip time (RTT) • T 1(t 1)-T 1(t 0) • only need clock to run approx. at the right speed clock time

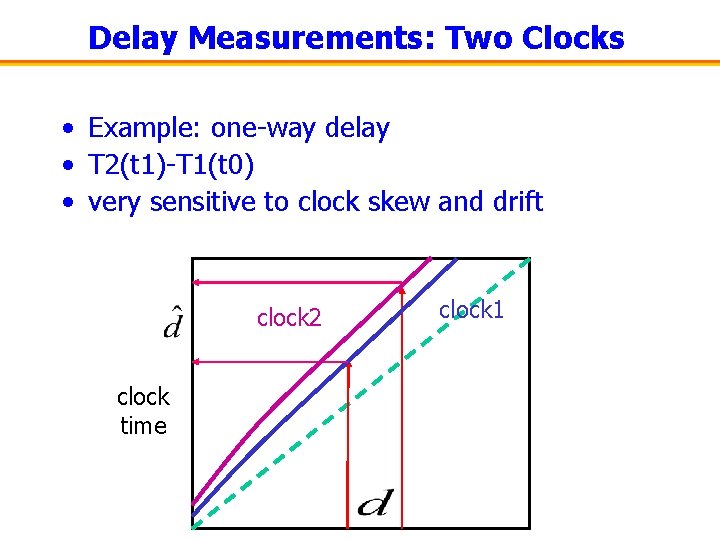
Delay Measurements: Two Clocks • Example: one-way delay • T 2(t 1)-T 1(t 0) • very sensitive to clock skew and drift clock 2 clock time clock 1

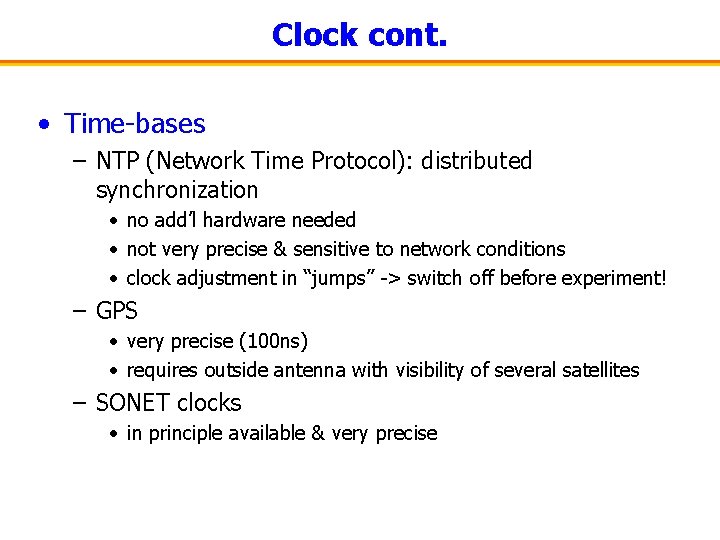
Clock cont. • Time-bases – NTP (Network Time Protocol): distributed synchronization • no add’l hardware needed • not very precise & sensitive to network conditions • clock adjustment in “jumps” -> switch off before experiment! – GPS • very precise (100 ns) • requires outside antenna with visibility of several satellites – SONET clocks • in principle available & very precise

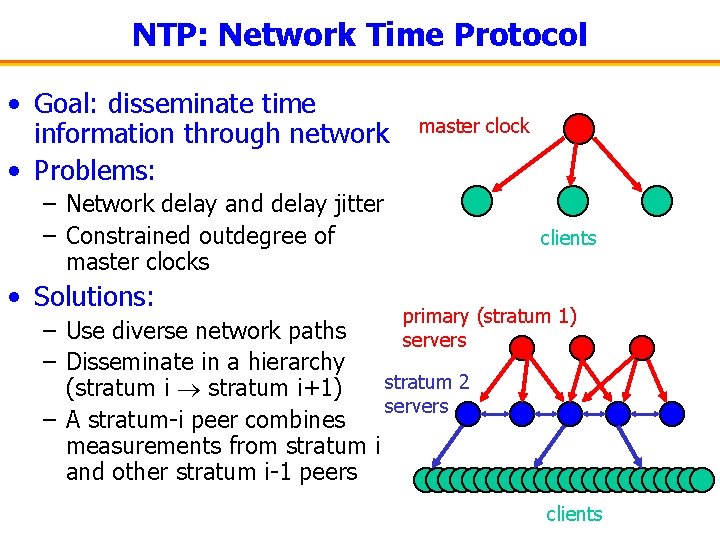
NTP: Network Time Protocol • Goal: disseminate time information through network • Problems: master clock – Network delay and delay jitter – Constrained outdegree of master clocks • Solutions: clients primary (stratum 1) servers – Use diverse network paths – Disseminate in a hierarchy stratum 2 (stratum i stratum i+1) servers – A stratum-i peer combines measurements from stratum i and other stratum i-1 peers clients

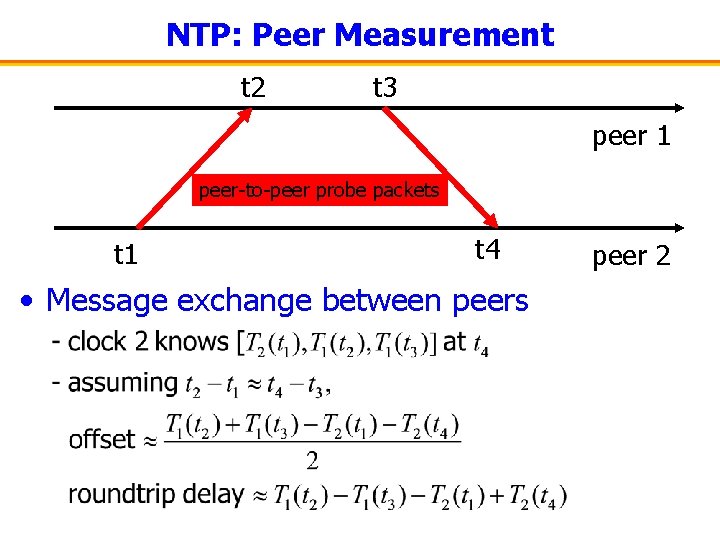
NTP: Peer Measurement t 2 t 3 peer 1 peer-to-peer probe packets t 1 t 4 • Message exchange between peers peer 2

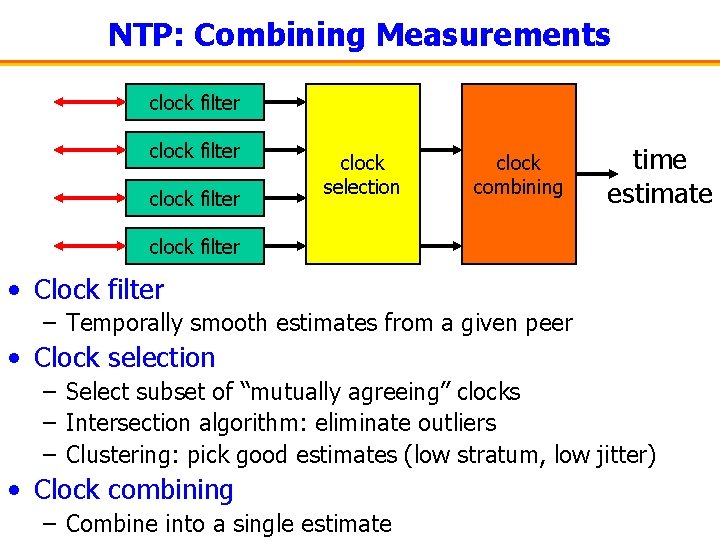
NTP: Combining Measurements clock filter clock selection clock combining time estimate clock filter • Clock filter – Temporally smooth estimates from a given peer • Clock selection – Select subset of “mutually agreeing” clocks – Intersection algorithm: eliminate outliers – Clustering: pick good estimates (low stratum, low jitter) • Clock combining – Combine into a single estimate

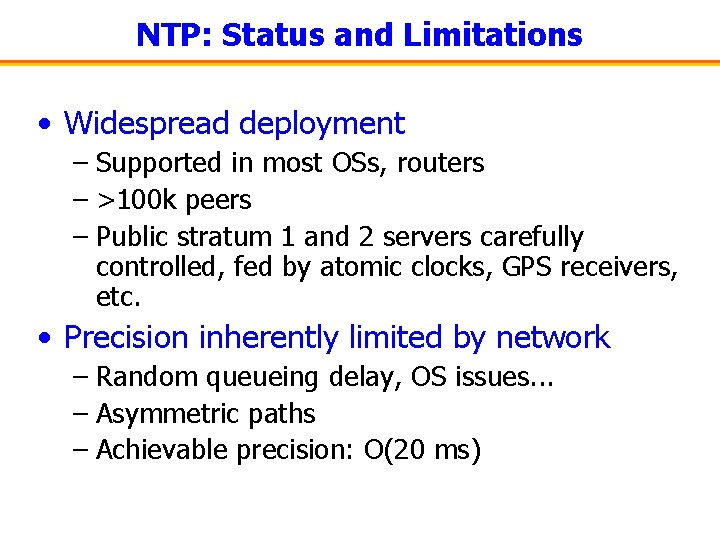
NTP: Status and Limitations • Widespread deployment – Supported in most OSs, routers – >100 k peers – Public stratum 1 and 2 servers carefully controlled, fed by atomic clocks, GPS receivers, etc. • Precision inherently limited by network – Random queueing delay, OS issues. . . – Asymmetric paths – Achievable precision: O(20 ms)

Active Performance Measurement

Active Performance Measurement • Definition: – Injecting measurement traffic into the network – Computing metrics on the received traffic • Scope – Closest to end-user experience – Least tightly coupled with infrastructure – Comes first in the detection/diagnosis/correction loop • Outline – – Tools for active measurement: probing, traceroute Operational uses: intradomain and interdomain Inference methods: peeking into the network Standardization efforts

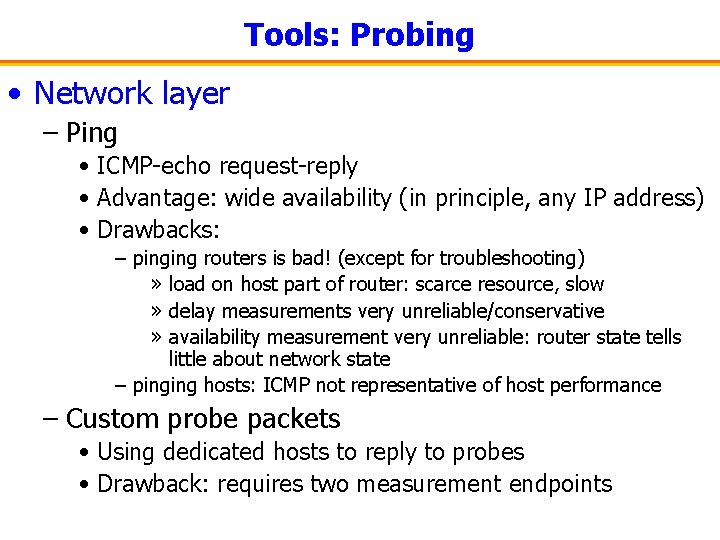
Tools: Probing • Network layer – Ping • ICMP-echo request-reply • Advantage: wide availability (in principle, any IP address) • Drawbacks: – pinging routers is bad! (except for troubleshooting) » load on host part of router: scarce resource, slow » delay measurements very unreliable/conservative » availability measurement very unreliable: router state tells little about network state – pinging hosts: ICMP not representative of host performance – Custom probe packets • Using dedicated hosts to reply to probes • Drawback: requires two measurement endpoints

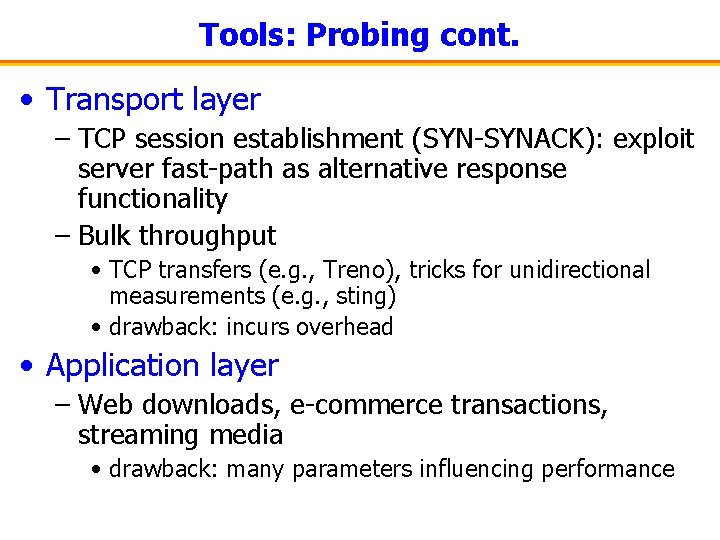
Tools: Probing cont. • Transport layer – TCP session establishment (SYN-SYNACK): exploit server fast-path as alternative response functionality – Bulk throughput • TCP transfers (e. g. , Treno), tricks for unidirectional measurements (e. g. , sting) • drawback: incurs overhead • Application layer – Web downloads, e-commerce transactions, streaming media • drawback: many parameters influencing performance

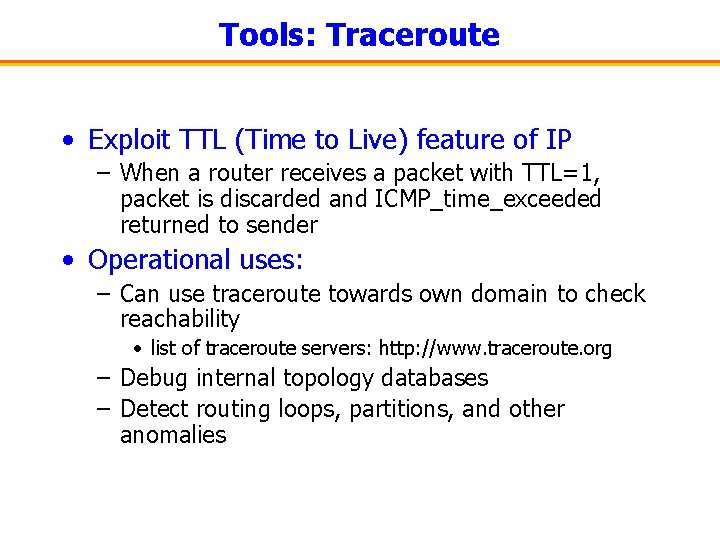
Tools: Traceroute • Exploit TTL (Time to Live) feature of IP – When a router receives a packet with TTL=1, packet is discarded and ICMP_time_exceeded returned to sender • Operational uses: – Can use traceroute towards own domain to check reachability • list of traceroute servers: http: //www. traceroute. org – Debug internal topology databases – Detect routing loops, partitions, and other anomalies

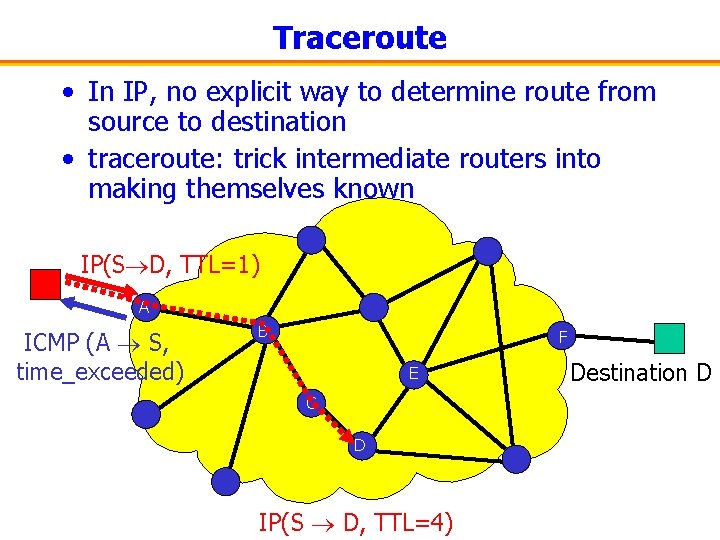
Traceroute • In IP, no explicit way to determine route from source to destination • traceroute: trick intermediate routers into making themselves known IP(S D, TTL=1) A ICMP (A S, time_exceeded) B F E C D IP(S D, TTL=4) Destination D
![Traceroute Sample Output chips traceroute degas eecs berkeley edu traceroute to robotics Traceroute: Sample Output <chips [ ~ ]>traceroute degas. eecs. berkeley. edu traceroute to robotics.](https://slidetodoc.com/presentation_image/1c6a30483a75e1ef98f1b141f94105d8/image-32.jpg)
Traceroute: Sample Output <chips [ ~ ]>traceroute degas. eecs. berkeley. edu traceroute to robotics. eecs. berkeley. edu (128. 32. 239. 38), 30 hops max, 40 byte packets 1 oden (135. 207. 31. 1) 1 ms 2 *** ICMP disabled 3 argus (192. 20. 225) 4 ms 3 ms 4 Serial 1 -4. GW 4. EWR 1. ALTER. NET (157. 130. 0. 177) 3 ms 4 ms TTL=249 is unexpected (should be initial_ICMP_TTL-(hop#-1)= 255 -(6 -1)=250) 5 117. ATM 5 -0. XR 1. EWR 1. ALTER. NET (152. 63. 25. 194) 4 ms 5 ms 6 193. at-2 -0 -0. XR 1. NYC 9. ALTER. NET (152. 63. 17. 226) 4 ms (ttl=249!) 6 ms (ttl=249!) 4 ms (ttl=249!) 7 0. so-2 -1 -0. XL 1. NYC 9. ALTER. NET (152. 63. 23. 137) 4 ms 8 POS 6 -0. BR 3. NYC 9. ALTER. NET (152. 63. 24. 97) 6 ms 4 ms RTT of three probes per hop 9 acr 2 -atm 3 -0 -0 -0. New. Yorknyr. cw. net (206. 24. 193. 245) 4 ms (ttl=246!) 7 ms (ttl=246!) 5 ms (ttl=246!) 10 acr 1 -loopback. San. Franciscosfd. cw. net (206. 24. 210. 61) 77 ms (ttl=245!) 74 ms (ttl=245!) 96 ms (ttl=245!) 11 cenic. San. Franciscosfd. cw. net (206. 24. 211. 134) 75 ms (ttl=244!) 74 ms (ttl=244!) 75 ms (ttl=244!) 12 BERK-7507 --BERK. POS. calren 2. net (198. 32. 249. 69) 72 ms (ttl=238!) 13 pos 1 -0. inr-000 -eva. Berkeley. EDU (128. 32. 0. 89) 73 ms (ttl=237!) 72 ms (ttl=237!) 14 vlan 199. inr-202 -doecev. Berkeley. EDU (128. 32. 0. 203) 72 ms (ttl=236!) 73 ms (ttl=236!) 72 ms (ttl=236!) 15 * 128. 32. 255. 126 (128. 32. 255. 126) 72 ms (ttl=235!) 74 ms (ttl=235!)

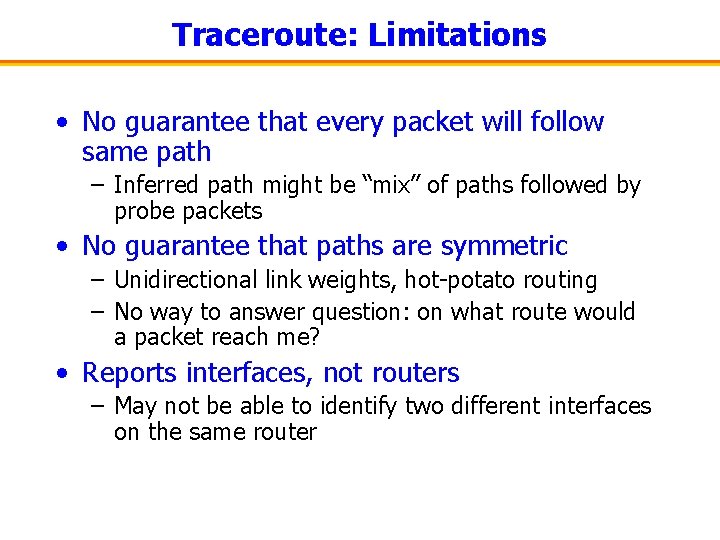
Traceroute: Limitations • No guarantee that every packet will follow same path – Inferred path might be “mix” of paths followed by probe packets • No guarantee that paths are symmetric – Unidirectional link weights, hot-potato routing – No way to answer question: on what route would a packet reach me? • Reports interfaces, not routers – May not be able to identify two different interfaces on the same router

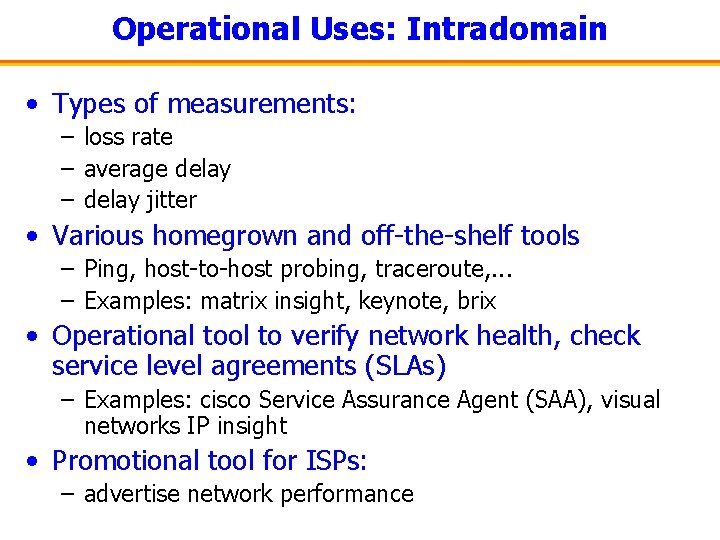
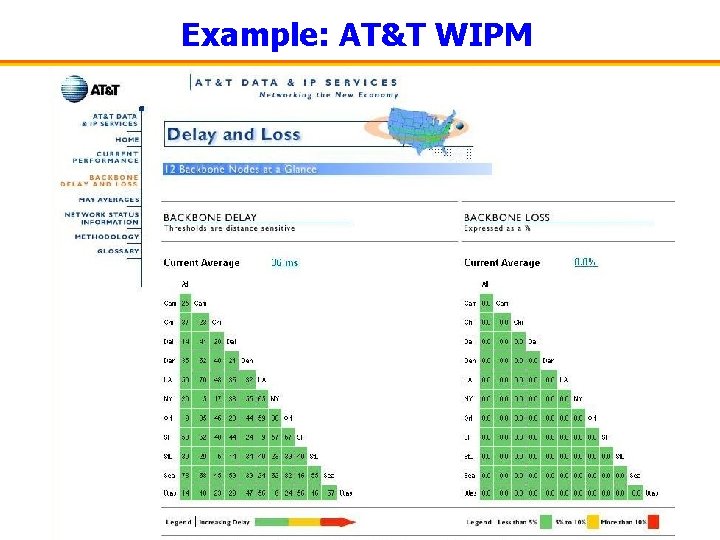
Operational Uses: Intradomain • Types of measurements: – loss rate – average delay – delay jitter • Various homegrown and off-the-shelf tools – Ping, host-to-host probing, traceroute, . . . – Examples: matrix insight, keynote, brix • Operational tool to verify network health, check service level agreements (SLAs) – Examples: cisco Service Assurance Agent (SAA), visual networks IP insight • Promotional tool for ISPs: – advertise network performance

Example: AT&T WIPM

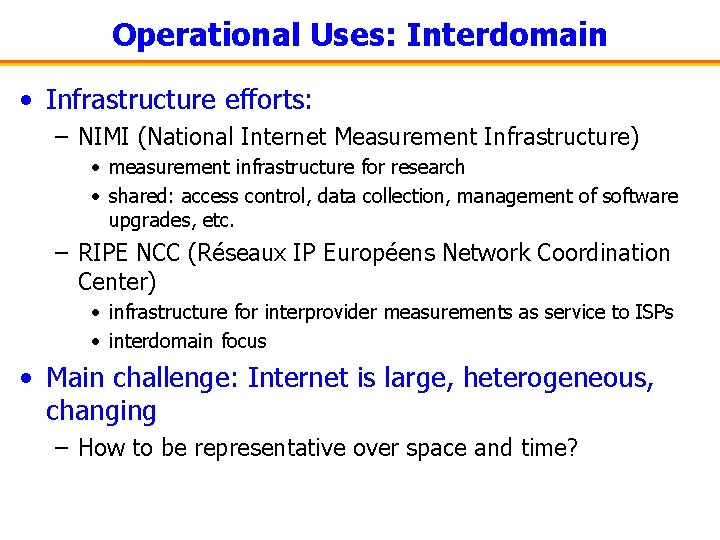
Operational Uses: Interdomain • Infrastructure efforts: – NIMI (National Internet Measurement Infrastructure) • measurement infrastructure for research • shared: access control, data collection, management of software upgrades, etc. – RIPE NCC (Réseaux IP Européens Network Coordination Center) • infrastructure for interprovider measurements as service to ISPs • interdomain focus • Main challenge: Internet is large, heterogeneous, changing – How to be representative over space and time?

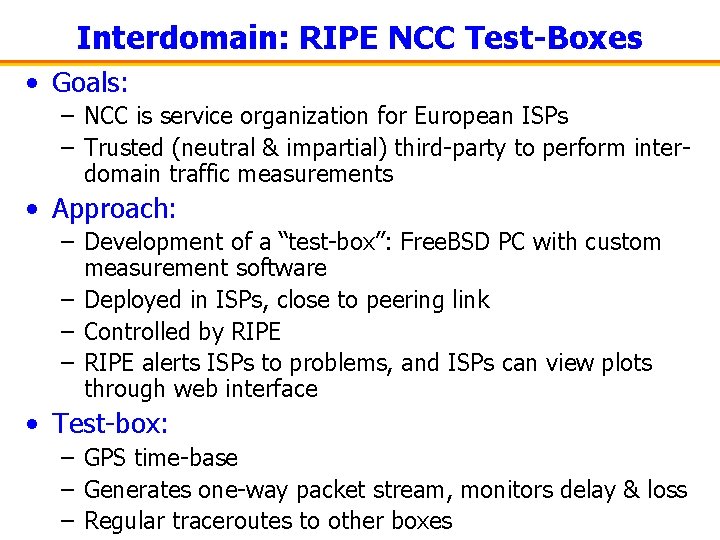
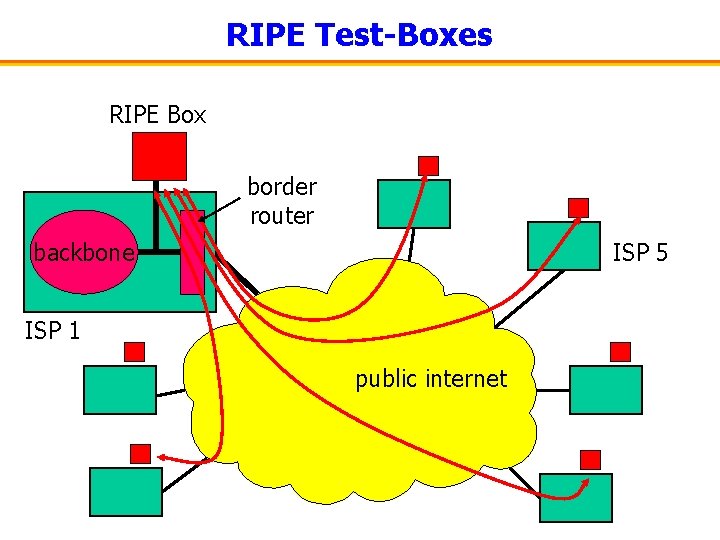
Interdomain: RIPE NCC Test-Boxes • Goals: – NCC is service organization for European ISPs – Trusted (neutral & impartial) third-party to perform interdomain traffic measurements • Approach: – Development of a “test-box”: Free. BSD PC with custom measurement software – Deployed in ISPs, close to peering link – Controlled by RIPE – RIPE alerts ISPs to problems, and ISPs can view plots through web interface • Test-box: – GPS time-base – Generates one-way packet stream, monitors delay & loss – Regular traceroutes to other boxes

RIPE Test-Boxes RIPE Box border router backbone ISP 5 ISP 1 public internet

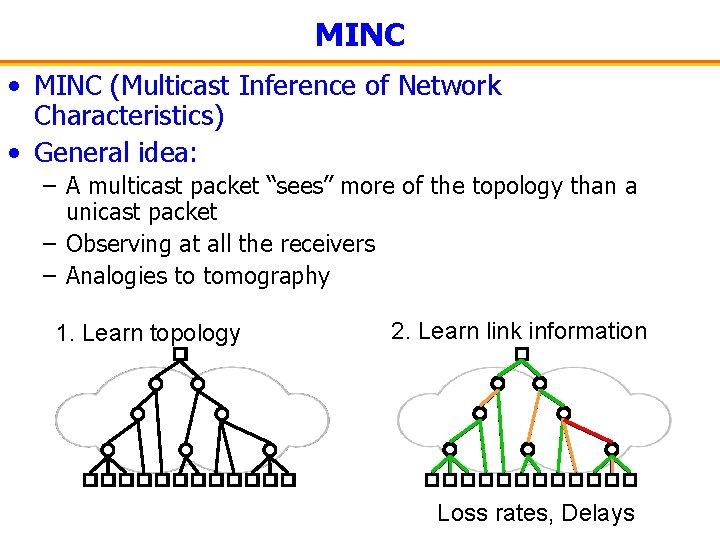
Inference Methods • ICMP-based – Pathchar: variant of traceroute, more sophisticated inference • End-to-end – Link capacity of bottleneck link • Multicast-based inference – MINC: infer topology, link loss, delay

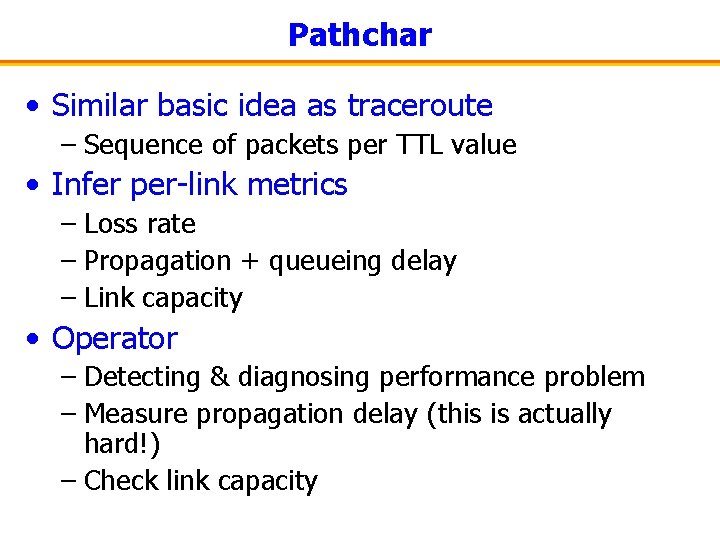
Pathchar • Similar basic idea as traceroute – Sequence of packets per TTL value • Infer per-link metrics – Loss rate – Propagation + queueing delay – Link capacity • Operator – Detecting & diagnosing performance problem – Measure propagation delay (this is actually hard!) – Check link capacity

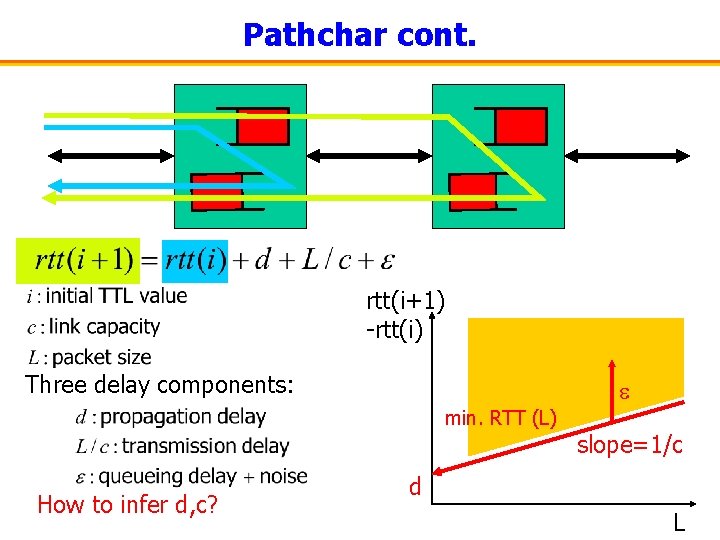
Pathchar cont. rtt(i+1) -rtt(i) Three delay components: min. RTT (L) How to infer d, c? slope=1/c d L
![Inference from EndtoEnd Measurements Capacity of bottleneck link Bolot 93 Basic observation Inference from End-to-End Measurements • Capacity of bottleneck link [Bolot 93] – Basic observation:](https://slidetodoc.com/presentation_image/1c6a30483a75e1ef98f1b141f94105d8/image-42.jpg)
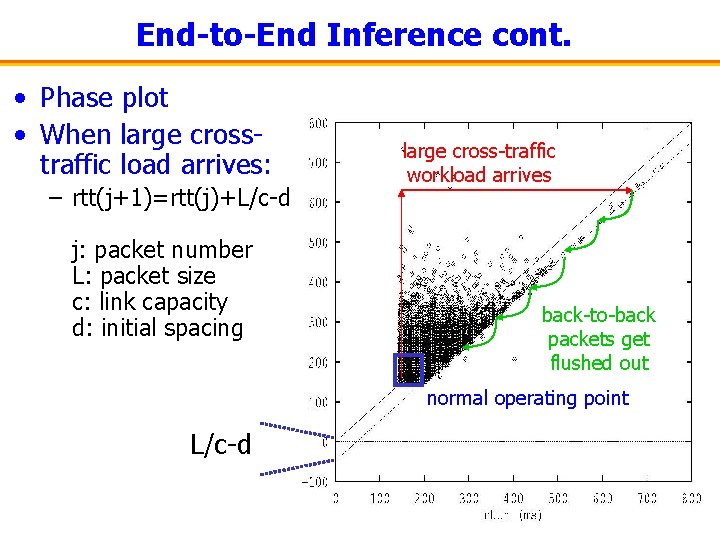
Inference from End-to-End Measurements • Capacity of bottleneck link [Bolot 93] – Basic observation: when probe packets get bunched up behind large cross-traffic workload, they get flushed out at L/c small probe packets L: packet size L/c d bottleneck link capacity c cross traffic

End-to-End Inference cont. • Phase plot • When large crosstraffic load arrives: – rtt(j+1)=rtt(j)+L/c-d j: packet number L: packet size c: link capacity d: initial spacing large cross-traffic workload arrives back-to-back packets get flushed out normal operating point L/c-d

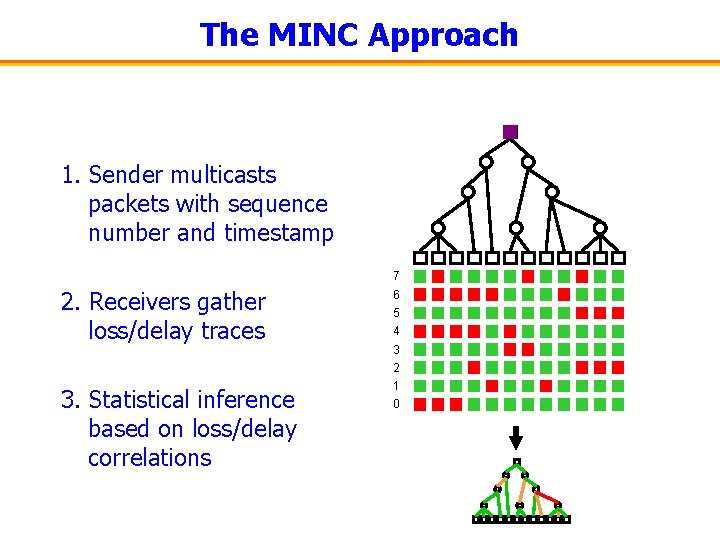
MINC • MINC (Multicast Inference of Network Characteristics) • General idea: – A multicast packet “sees” more of the topology than a unicast packet – Observing at all the receivers – Analogies to tomography 1. Learn topology 2. Learn link information Loss rates, Delays

The MINC Approach 1. Sender multicasts packets with sequence number and timestamp 7 2. Receivers gather loss/delay traces 3. Statistical inference based on loss/delay correlations 6 5 4 3 2 1 0

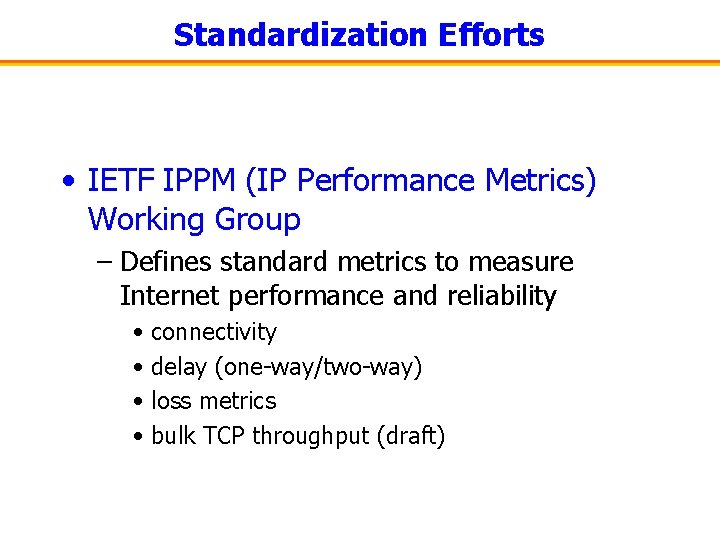
Standardization Efforts • IETF IPPM (IP Performance Metrics) Working Group – Defines standard metrics to measure Internet performance and reliability • connectivity • delay (one-way/two-way) • loss metrics • bulk TCP throughput (draft)

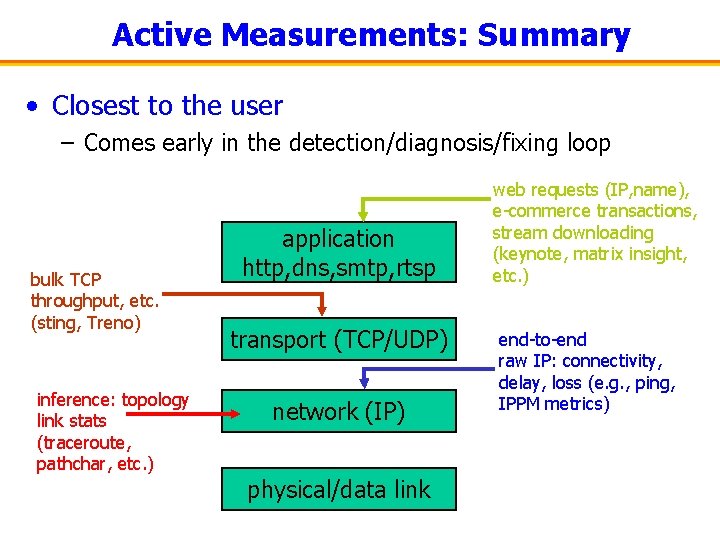
Active Measurements: Summary • Closest to the user – Comes early in the detection/diagnosis/fixing loop bulk TCP throughput, etc. (sting, Treno) inference: topology link stats (traceroute, pathchar, etc. ) application http, dns, smtp, rtsp transport (TCP/UDP) network (IP) physical/data link web requests (IP, name), e-commerce transactions, stream downloading (keynote, matrix insight, etc. ) end-to-end raw IP: connectivity, delay, loss (e. g. , ping, IPPM metrics)

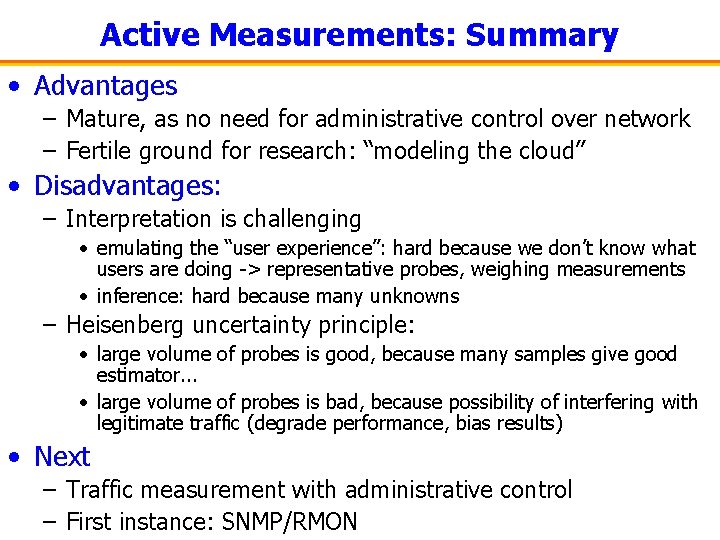
Active Measurements: Summary • Advantages – Mature, as no need for administrative control over network – Fertile ground for research: “modeling the cloud” • Disadvantages: – Interpretation is challenging • emulating the “user experience”: hard because we don’t know what users are doing -> representative probes, weighing measurements • inference: hard because many unknowns – Heisenberg uncertainty principle: • large volume of probes is good, because many samples give good estimator. . . • large volume of probes is bad, because possibility of interfering with legitimate traffic (degrade performance, bias results) • Next – Traffic measurement with administrative control – First instance: SNMP/RMON

SNMP/RMON

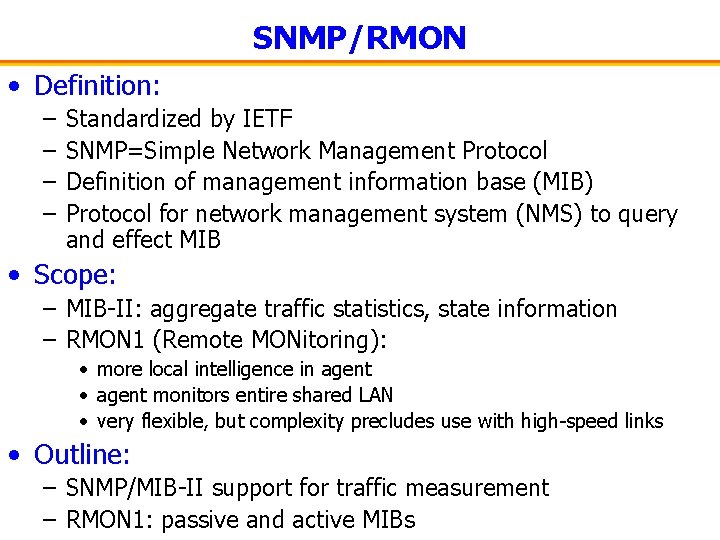
SNMP/RMON • Definition: – – Standardized by IETF SNMP=Simple Network Management Protocol Definition of management information base (MIB) Protocol for network management system (NMS) to query and effect MIB • Scope: – MIB-II: aggregate traffic statistics, state information – RMON 1 (Remote MONitoring): • more local intelligence in agent • agent monitors entire shared LAN • very flexible, but complexity precludes use with high-speed links • Outline: – SNMP/MIB-II support for traffic measurement – RMON 1: passive and active MIBs

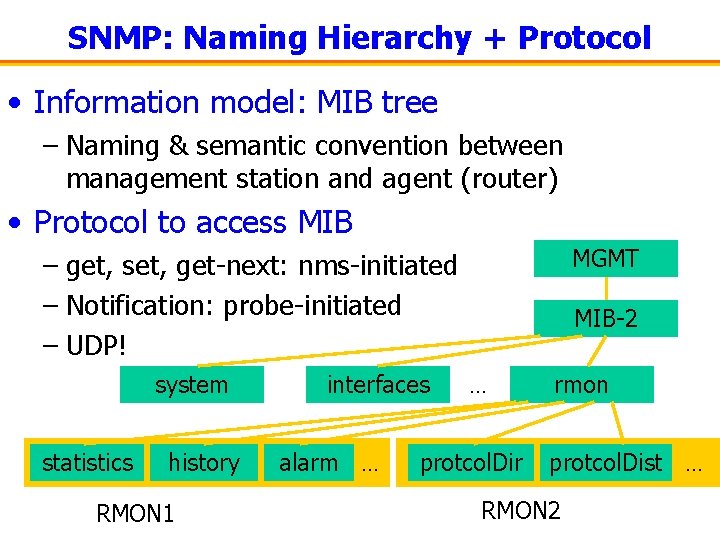
SNMP: Naming Hierarchy + Protocol • Information model: MIB tree – Naming & semantic convention between management station and agent (router) • Protocol to access MIB MGMT – get, set, get-next: nms-initiated – Notification: probe-initiated – UDP! system statistics history RMON 1 interfaces alarm. . . MIB-2. . . protcol. Dir rmon protcol. Dist. . . RMON 2

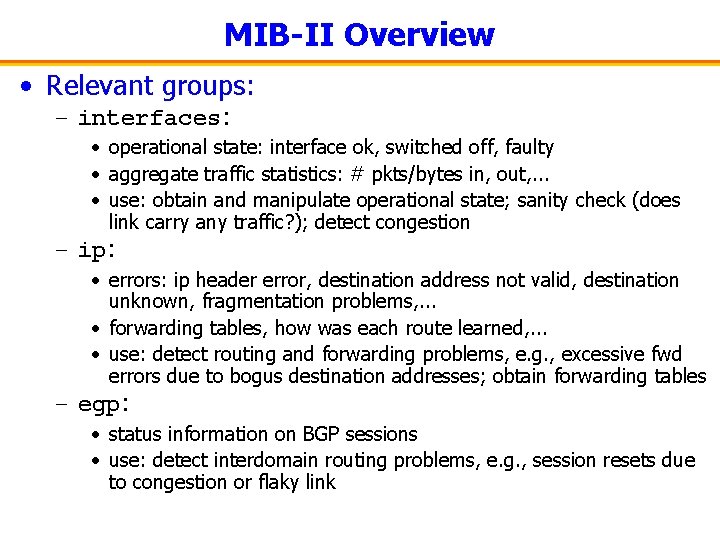
MIB-II Overview • Relevant groups: – interfaces: • operational state: interface ok, switched off, faulty • aggregate traffic statistics: # pkts/bytes in, out, . . . • use: obtain and manipulate operational state; sanity check (does link carry any traffic? ); detect congestion – ip: • errors: ip header error, destination address not valid, destination unknown, fragmentation problems, . . . • forwarding tables, how was each route learned, . . . • use: detect routing and forwarding problems, e. g. , excessive fwd errors due to bogus destination addresses; obtain forwarding tables – egp: • status information on BGP sessions • use: detect interdomain routing problems, e. g. , session resets due to congestion or flaky link

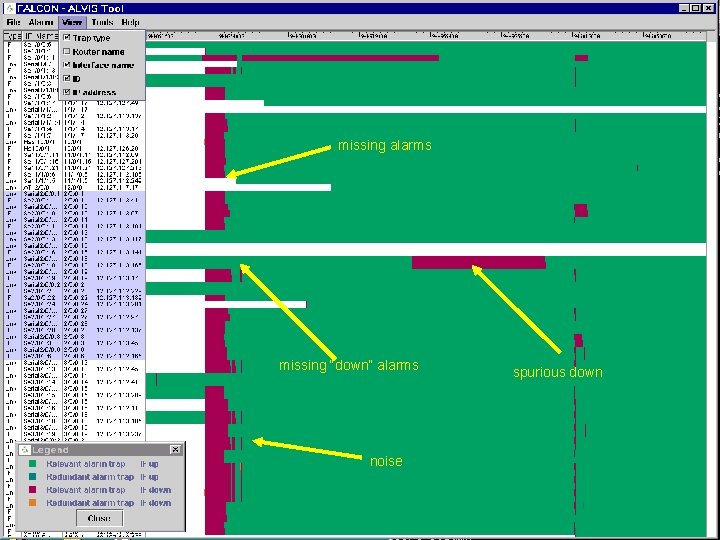
missing alarms missing “down” alarms noise spurious down

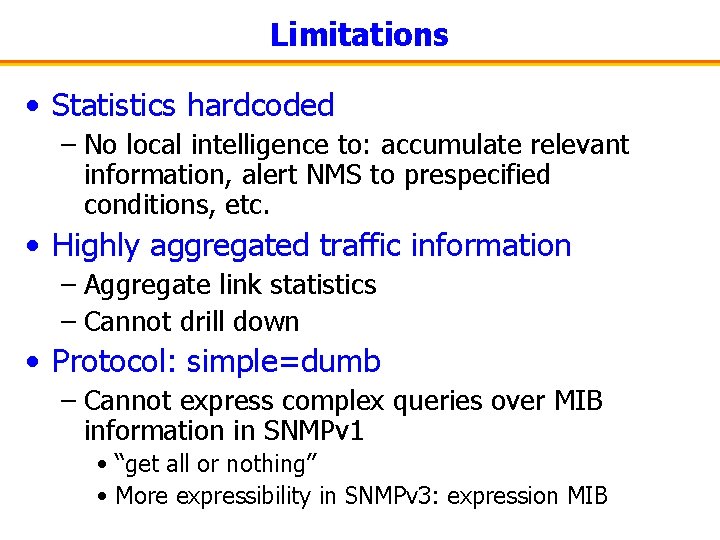
Limitations • Statistics hardcoded – No local intelligence to: accumulate relevant information, alert NMS to prespecified conditions, etc. • Highly aggregated traffic information – Aggregate link statistics – Cannot drill down • Protocol: simple=dumb – Cannot express complex queries over MIB information in SNMPv 1 • “get all or nothing” • More expressibility in SNMPv 3: expression MIB

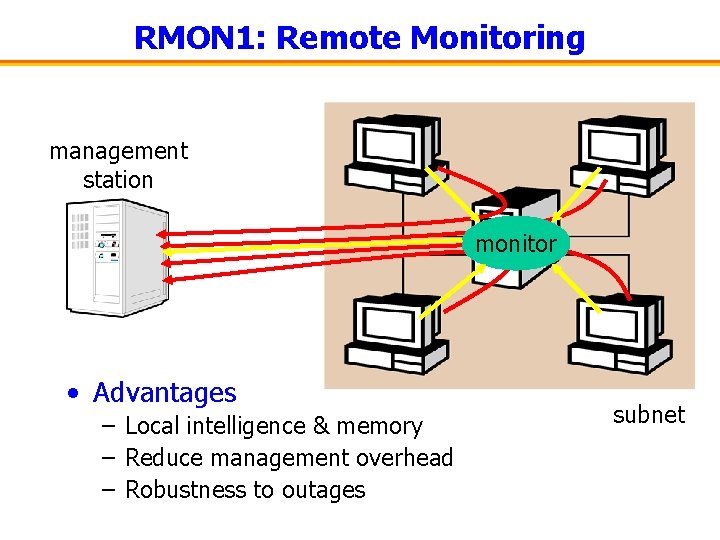
RMON 1: Remote Monitoring management station monitor • Advantages – Local intelligence & memory – Reduce management overhead – Robustness to outages subnet

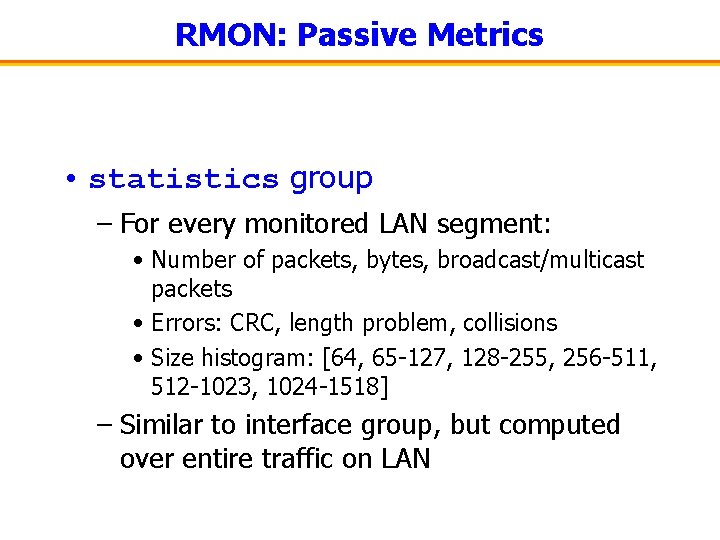
RMON: Passive Metrics • statistics group – For every monitored LAN segment: • Number of packets, bytes, broadcast/multicast packets • Errors: CRC, length problem, collisions • Size histogram: [64, 65 -127, 128 -255, 256 -511, 512 -1023, 1024 -1518] – Similar to interface group, but computed over entire traffic on LAN

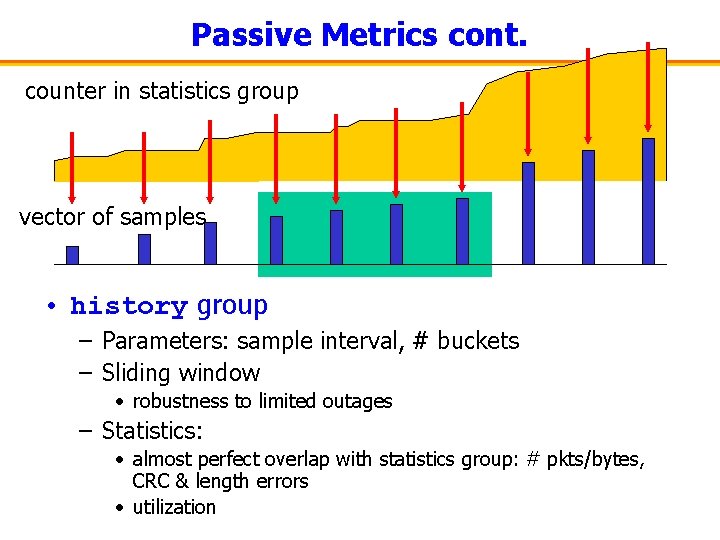
Passive Metrics cont. counter in statistics group vector of samples • history group – Parameters: sample interval, # buckets – Sliding window • robustness to limited outages – Statistics: • almost perfect overlap with statistics group: # pkts/bytes, CRC & length errors • utilization

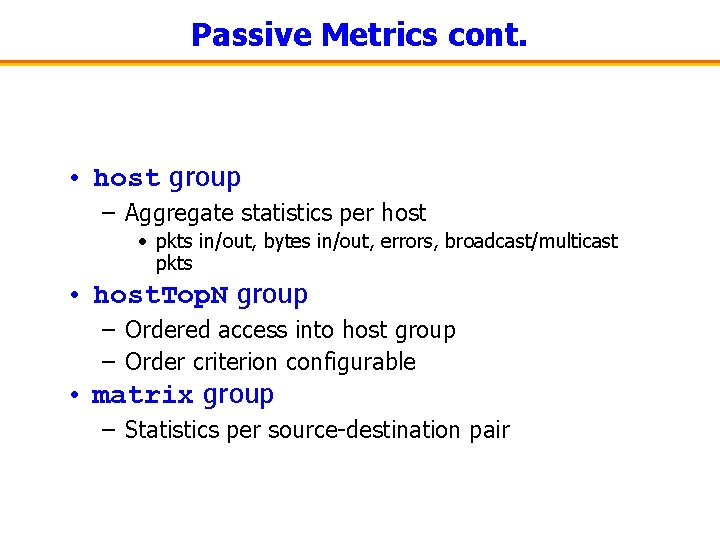
Passive Metrics cont. • host group – Aggregate statistics per host • pkts in/out, bytes in/out, errors, broadcast/multicast pkts • host. Top. N group – Ordered access into host group – Order criterion configurable • matrix group – Statistics per source-destination pair

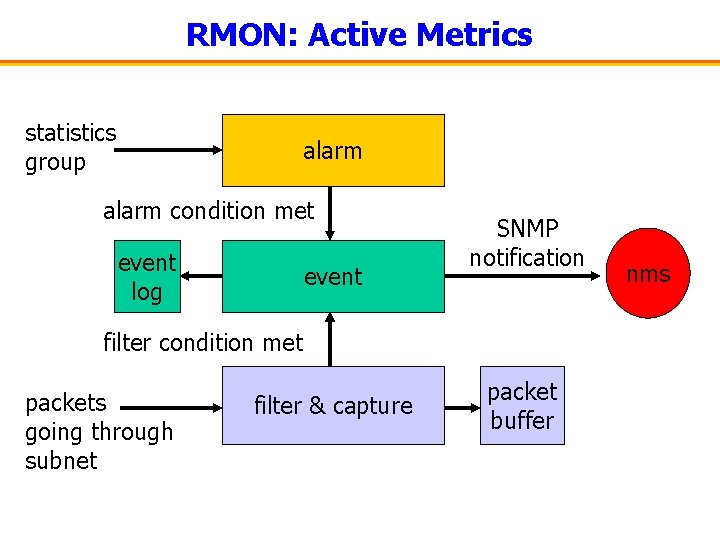
RMON: Active Metrics statistics group alarm condition met event log event SNMP notification filter condition met packets going through subnet filter & capture packet buffer nms

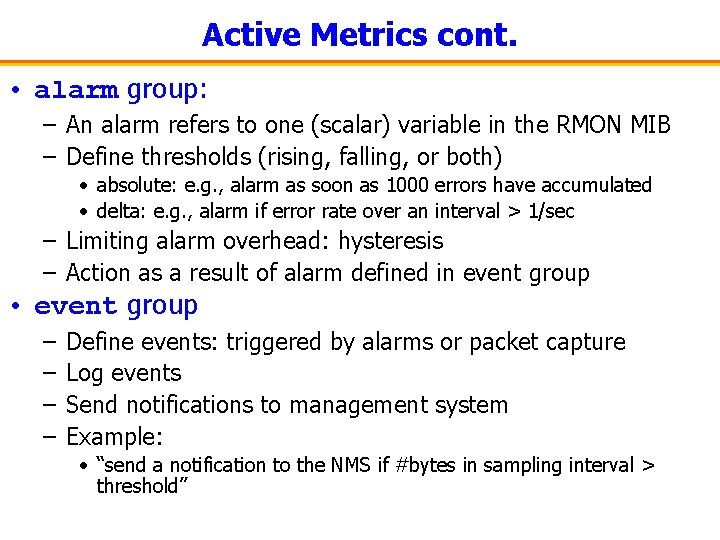
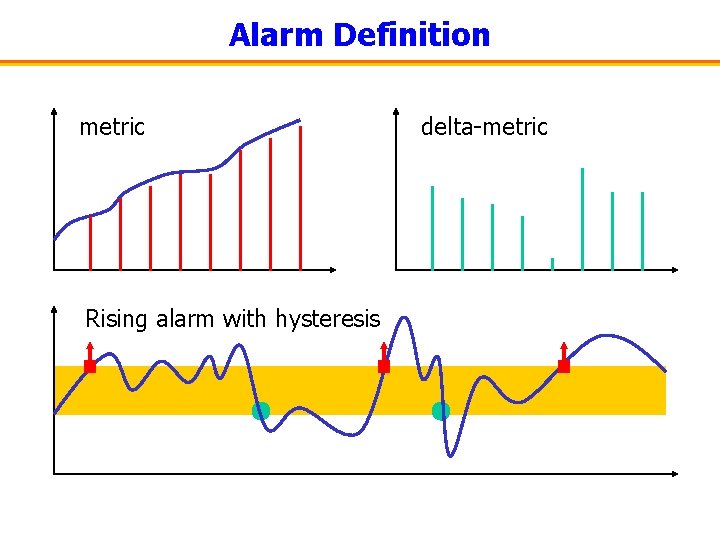
Active Metrics cont. • alarm group: – An alarm refers to one (scalar) variable in the RMON MIB – Define thresholds (rising, falling, or both) • absolute: e. g. , alarm as soon as 1000 errors have accumulated • delta: e. g. , alarm if error rate over an interval > 1/sec – Limiting alarm overhead: hysteresis – Action as a result of alarm defined in event group • event group – – Define events: triggered by alarms or packet capture Log events Send notifications to management system Example: • “send a notification to the NMS if #bytes in sampling interval > threshold”

Alarm Definition metric Rising alarm with hysteresis delta-metric

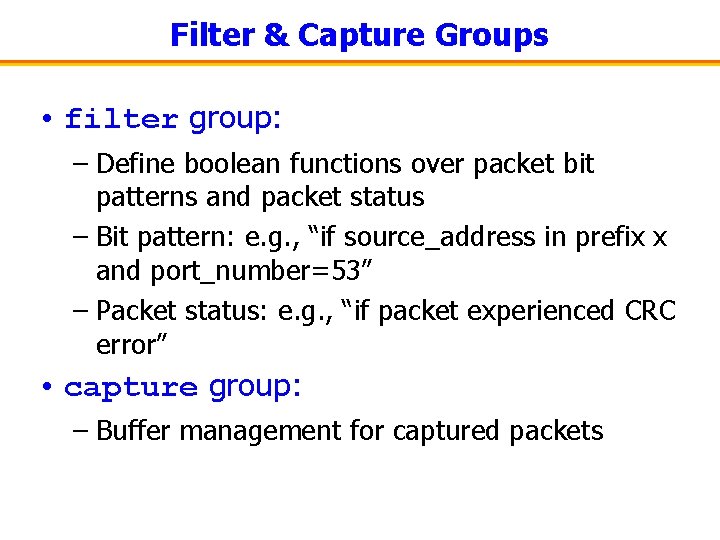
Filter & Capture Groups • filter group: – Define boolean functions over packet bit patterns and packet status – Bit pattern: e. g. , “if source_address in prefix x and port_number=53” – Packet status: e. g. , “if packet experienced CRC error” • capture group: – Buffer management for captured packets

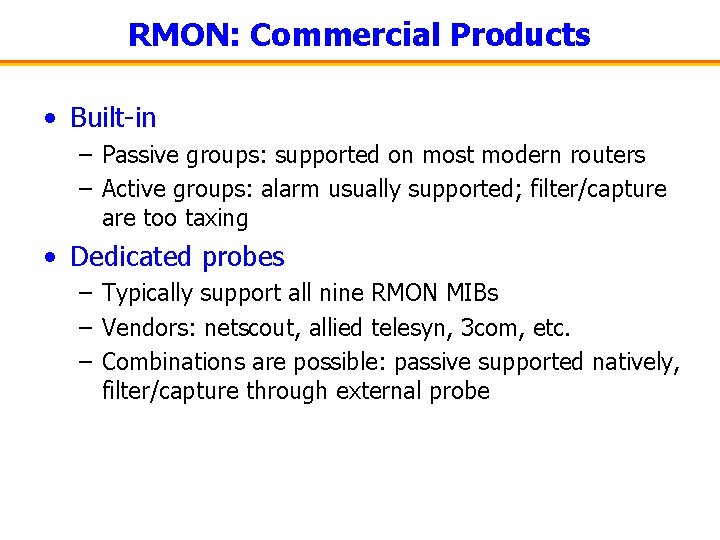
RMON: Commercial Products • Built-in – Passive groups: supported on most modern routers – Active groups: alarm usually supported; filter/capture are too taxing • Dedicated probes – Typically support all nine RMON MIBs – Vendors: netscout, allied telesyn, 3 com, etc. – Combinations are possible: passive supported natively, filter/capture through external probe

SNMP/RMON: Summary • Standardized set of traffic measurements – Multiple vendors for probes & analysis software – Attractive for operators, because off-the-shelf tools are available (HP Openview, etc. ) – IETF: work on MIBs for diffserv, MPLS • RMON: edge only – Full RMON support everywhere would probably cover all our traffic measurement needs • passive groups could probably easily be supported by backbone interfaces • active groups require complex per-packet operations & memory – Following sections: sacrifice flexibility for speed