
Paris Ile de France Capitale Economique Etudes Recherche
- Slides: 24
Paris - Ile de France Capitale Economique Etudes & Recherche March 2007 xxxxx. C 03 France & Absorption Paris. Q 4 2006 Paris Region Nette
France & Paris France You know France … xxxxx. C 03 2 Etudes & Recherche March 2007
France & Paris France … but do you really know France? 3 xxxxx. C 03 Etudes & Recherche March 2007
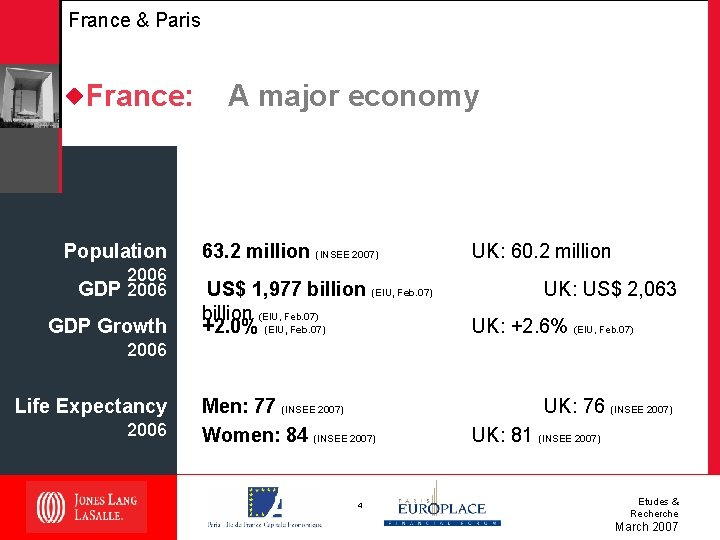
France & Paris France: Population 2006 GDP Growth A major economy 63. 2 million (INSEE 2007) US$ 1, 977 billion (EIU, Feb. 07) +2. 0% (EIU, Feb. 07) UK: 60. 2 million UK: US$ 2, 063 UK: +2. 6% (EIU, Feb. 07) 2006 Men: 77 (INSEE 2007) Women: 84 (INSEE 2007) 4 UK: 76 (INSEE 2007) UK: 81 (INSEE 2007) xxxxx. C 03 Life Expectancy Etudes & Recherche March 2007
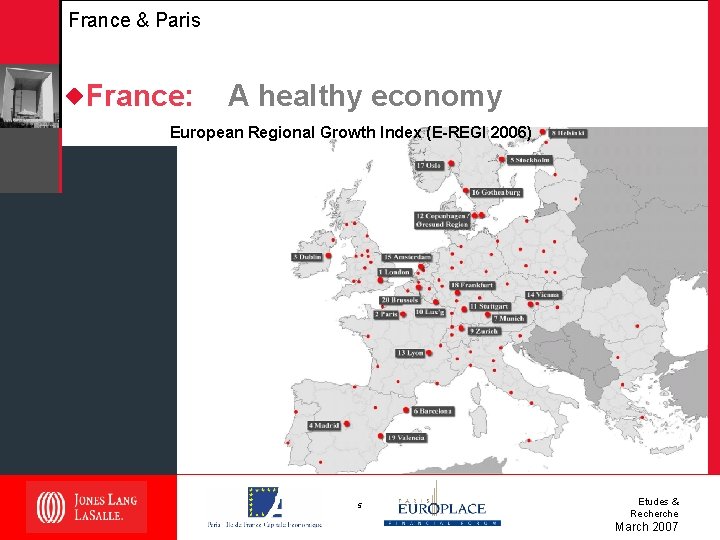
France & Paris France: A healthy economy xxxxx. C 03 European Regional Growth Index (E-REGI 2006) 5 Etudes & Recherche March 2007
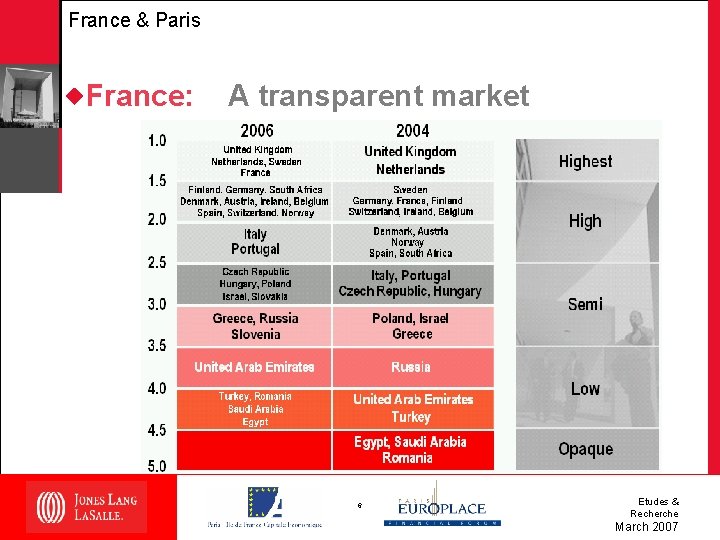
France & Paris A transparent market xxxxx. C 03 France: 6 Etudes & Recherche March 2007
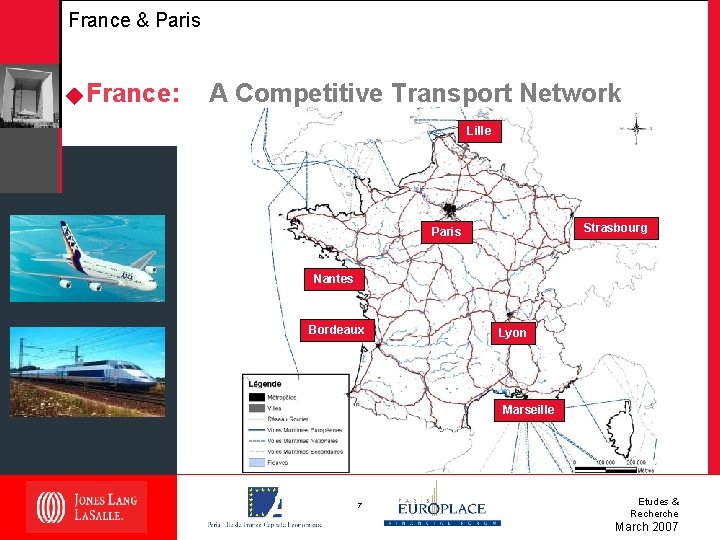
France & Paris A Competitive Transport Network Lille Strasbourg Paris Nantes Bordeaux Lyon Marseille xxxxx. C 03 France: 7 Etudes & Recherche March 2007
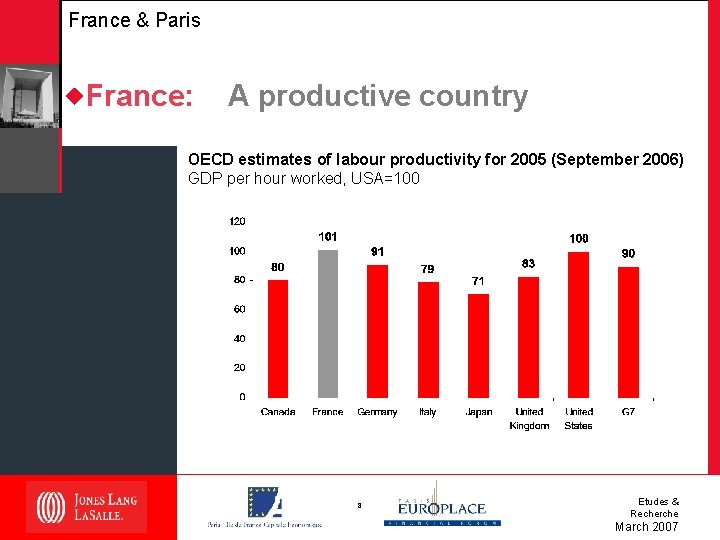
France & Paris France: A productive country xxxxx. C 03 OECD estimates of labour productivity for 2005 (September 2006) GDP per hour worked, USA=100 8 Etudes & Recherche March 2007
France & Paris In the heart of French economy xxxxx. C 03 9 Etudes & Recherche March 2007
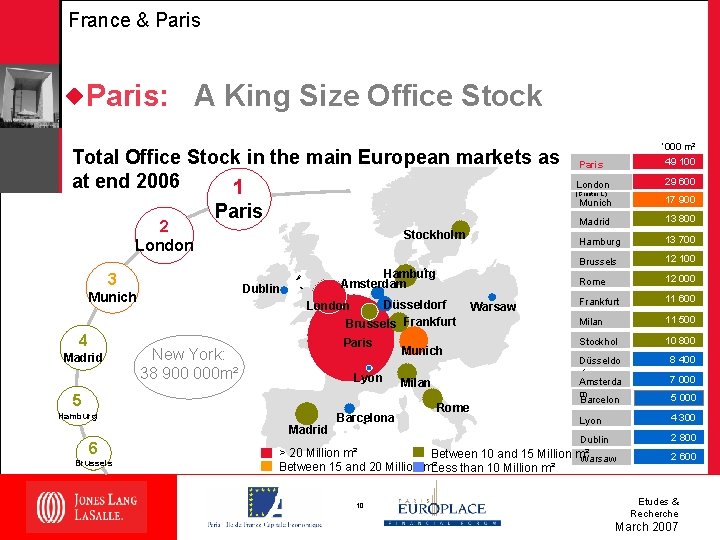
France & Paris A King Size Office Stock Total Office Stock in the main European markets as at end 2006 1 2 London Paris 3 Madrid Hamburg Amsterdam Dublin Munich 4 Stockholm Düsseldorf London Brussels Frankfurt Paris New York: 38 900 000 m² Lyon 5 Hamburg Madrid 6 Brussels Barcelona Munich Milan Rome Warsaw ‘ 000 m² Paris 49 100 London 29 600 (Greater L. ) Munich 17 900 Madrid 13 800 Hamburg 13 700 Brussels 12 100 Rome 12 000 Frankfurt 11 600 Milan 11 500 Stockhol m Düsseldo rf Amsterda m Barcelon a Lyon 10 800 7 000 5 000 4 300 2 800 Dublin > 20 Million m² Between 10 and 15 Million m² Warsaw Between 15 and 20 Million m²Less than 10 Million m² 10 8 400 2 600 Etudes & Recherche March 2007 xxxxx. C 03 Paris:
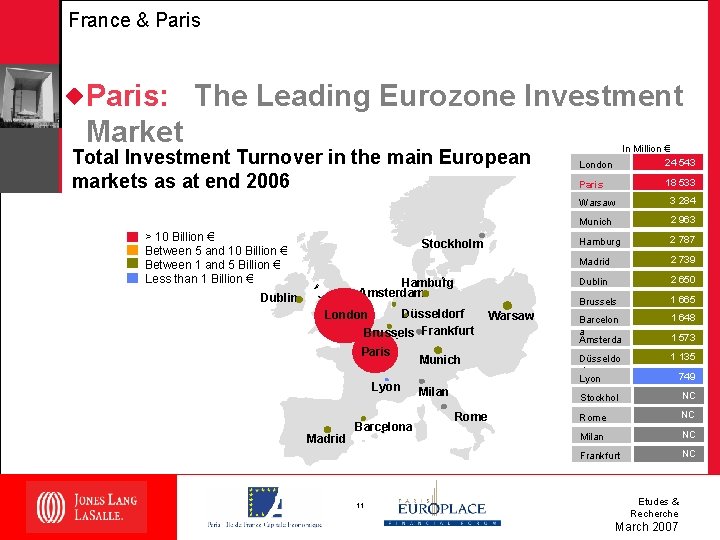
France & Paris The Leading Eurozone Investment Market Total Investment Turnover in the main European markets as at end 2006 > 10 Billion € Between 5 and 10 Billion € Between 1 and 5 Billion € Less than 1 Billion € Stockholm Hamburg Amsterdam Dublin Düsseldorf London Brussels Frankfurt Paris Lyon Madrid Barcelona 11 Munich Milan Rome Warsaw In Million € 24 543 London 18 533 Paris Warsaw 3 284 Munich 2 963 Hamburg 2 787 Madrid 2 739 Dublin 2 650 Brussels 1 665 Barcelon a Amsterda m Düsseldo rf Lyon 1 648 1 573 1 135 749 NC Stockhol m Rome NC Milan NC Frankfurt NC Etudes & Recherche March 2007 xxxxx. C 03 Paris:
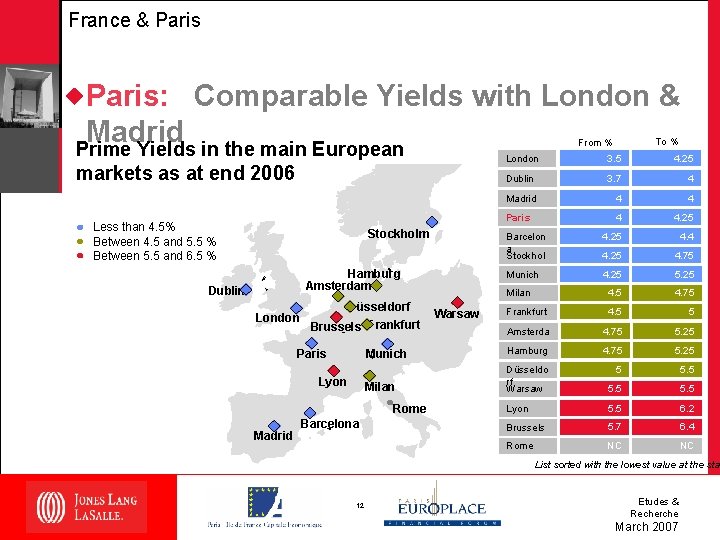
France & Paris Comparable Yields with London & Madrid Less than 4. 5% Between 4. 5 and 5. 5 % Between 5. 5 and 6. 5 % London 3. 5 4. 25 Dublin 3. 7 4 Madrid 4 4 Paris 4 4. 25 4. 75 4. 25 5. 25 Milan 4. 5 4. 75 Frankfurt 4. 5 5 4. 75 5. 25 Munich Amsterda m Hamburg 4. 75 5. 25 5 5. 5 Milan Düsseldo rf Warsaw 5. 5 Lyon 5. 5 6. 2 Brussels 5. 7 6. 4 Rome NC NC Stockholm Barcelon a Stockhol m Munich Hamburg Amsterdam Dublin Düsseldorf London Brussels Frankfurt Paris Lyon Rome Madrid Barcelona To % From % Prime Yields in the main European markets as at end 2006 Warsaw xxxxx. C 03 Paris: List sorted with the lowest value at the sta 12 Etudes & Recherche March 2007
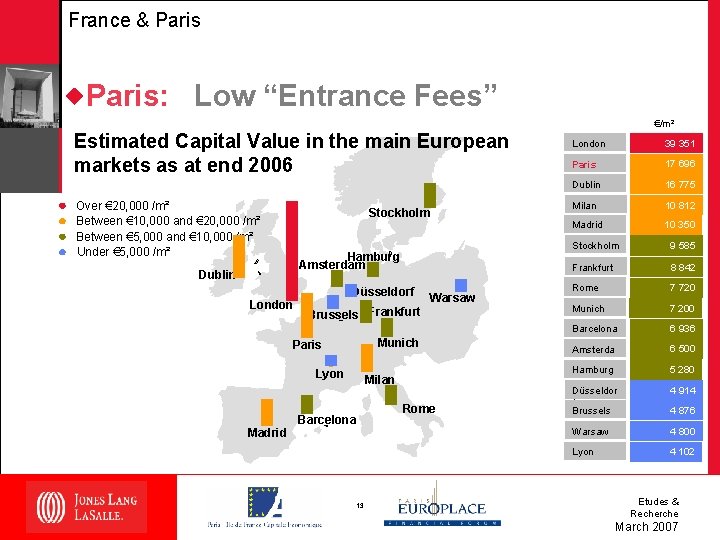
France & Paris: Low “Entrance Fees” €/m² Over € 20, 000 /m² Between € 10, 000 and € 20, 000 /m² Between € 5, 000 and € 10, 000 /m² Under € 5, 000 /m² Stockholm Hamburg Amsterdam Dublin London Düsseldorf Brussels Frankfurt Munich Paris Lyon Madrid Warsaw Milan Barcelona 13 Rome London 39 351 Paris 17 696 Dublin 16 775 Milan 10 812 Madrid 10 350 Stockholm 9 585 Frankfurt 8 842 Rome 7 720 Munich 7 200 Barcelona 6 936 Amsterda m Hamburg 6 500 5 280 Düsseldor f Brussels 4 914 Warsaw 4 800 Lyon 4 102 4 876 Etudes & Recherche March 2007 xxxxx. C 03 Estimated Capital Value in the main European markets as at end 2006
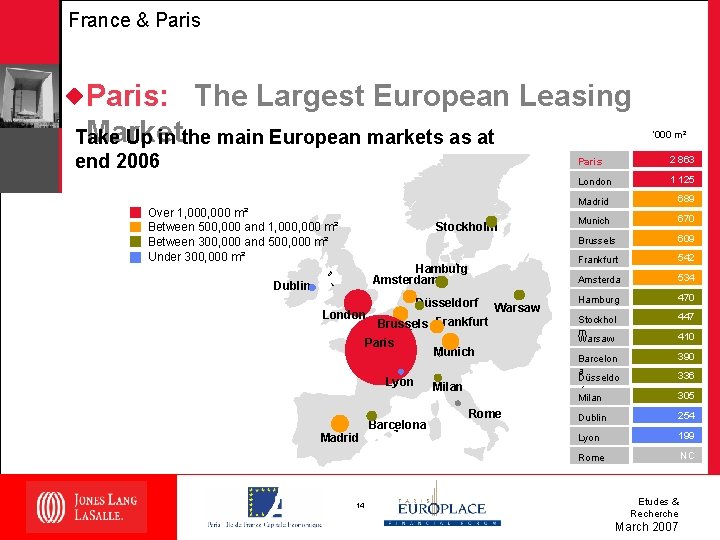
France & Paris The Largest European Leasing Market Take Up in the main European markets as at end 2006 Over 1, 000 m² Between 500, 000 and 1, 000 m² Between 300, 000 and 500, 000 m² Under 300, 000 m² Stockholm Hamburg Amsterdam Dublin London Düsseldorf Brussels Frankfurt Paris Lyon Madrid 14 Warsaw Barcelona Munich Milan Rome ‘ 000 m² Paris 2 863 London 1 125 Madrid 689 Munich 670 Brussels 609 Frankfurt 542 Amsterda m Hamburg 534 Stockhol m Warsaw 447 Barcelon a Düsseldo rf Milan 390 336 Dublin 254 Lyon 199 Rome NC 470 410 305 Etudes & Recherche March 2007 xxxxx. C 03 Paris:
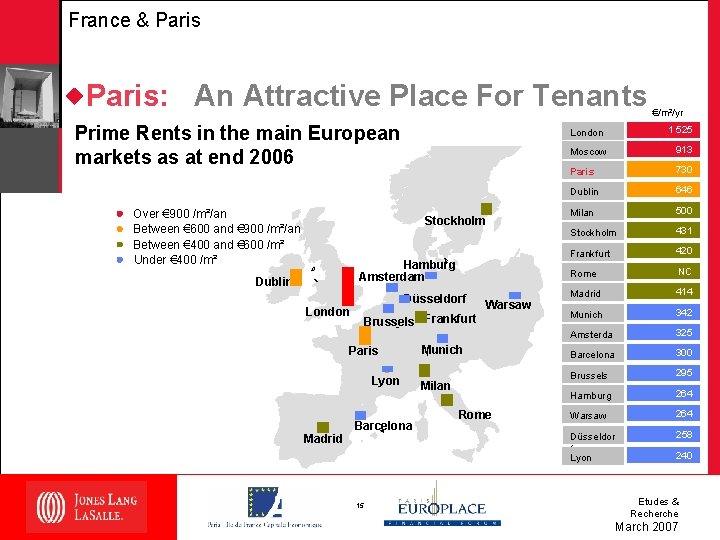
France & Paris An Attractive Place For Tenants Prime Rents in the main European markets as at end 2006 Over € 900 /m²/an Between € 600 and € 900 /m²/an Between € 400 and € 600 /m² Under € 400 /m² Hamburg Amsterdam Dublin London Düsseldorf Warsaw Brussels Frankfurt Paris Lyon Madrid Barcelona 15 1 525 London Stockholm Munich Milan Rome €/m²/yr Moscow 913 Paris 730 Dublin 646 Milan 500 Stockholm 431 Frankfurt 420 Rome NC Madrid 414 Munich 342 Amsterda m Barcelona 325 Brussels 295 Hamburg 264 Warsaw 264 Düsseldor f Lyon 258 300 240 Etudes & Recherche March 2007 xxxxx. C 03 Paris:
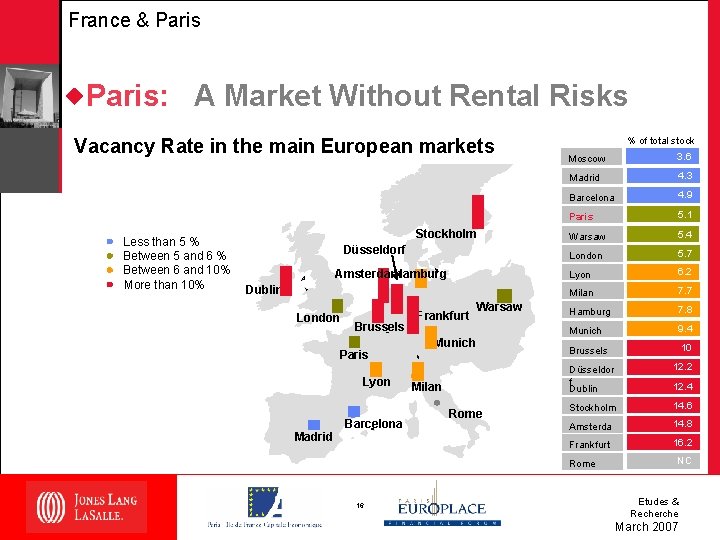
France & Paris A Market Without Rental Risks Vacancy Rate in the main European markets Less than 5 % Between 5 and 6 % Between 6 and 10% More than 10% Stockholm Düsseldorf Amsterdam Hamburg Dublin London Brussels Paris Lyon Madrid Barcelona Frankfurt Warsaw Munich Milan Rome % of total stock Moscow 3. 6 Madrid 4. 3 Barcelona 4. 9 Paris 5. 1 Warsaw 5. 4 London 5. 7 Lyon 6. 2 Milan 7. 7 Hamburg 7. 8 Munich 9. 4 Brussels 10 Düsseldor f Dublin 12. 2 Stockholm 14. 6 Amsterda m Frankfurt 14. 8 Rome 16 12. 4 16. 2 NC Etudes & Recherche March 2007 xxxxx. C 03 Paris:
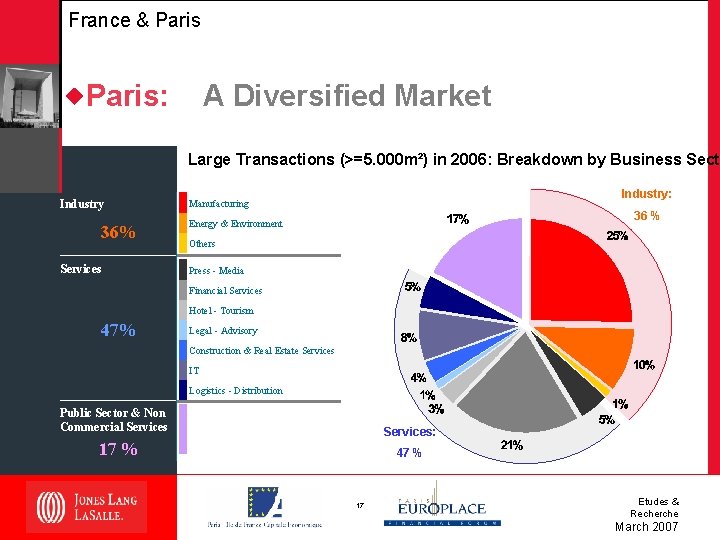
France & Paris: A Diversified Market Large Transactions (>=5. 000 m²) in 2006: Breakdown by Business Secto Industry 36% Services Industry: Manufacturing 36 % Energy & Environment Others Press - Media Financial Services Hotel - Tourism 47% Legal - Advisory Construction & Real Estate Services IT Logistics - Distribution Public Sector & Non Commercial Services xxxxx. C 03 17 % Services: 47 % 17 Etudes & Recherche March 2007
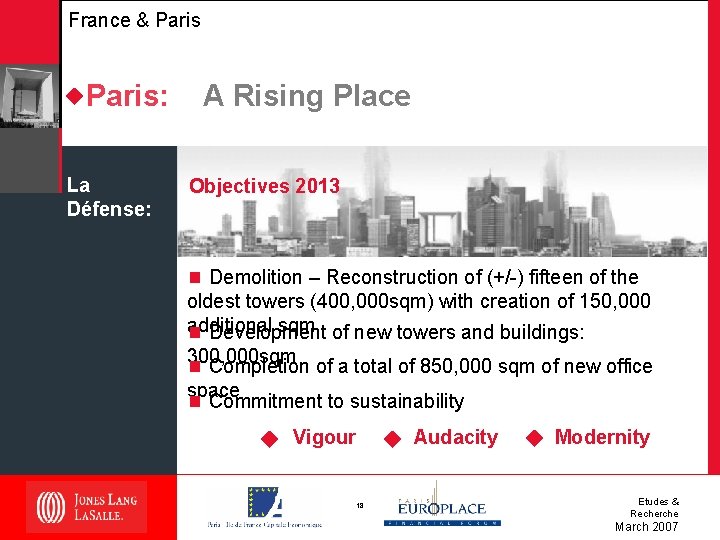
France & Paris La Défense: A Rising Place Objectives 2013 Demolition – Reconstruction of (+/-) fifteen of the oldest towers (400, 000 sqm) with creation of 150, 000 additional sqm of new towers and buildings: Development 300, 000 sqm Completion of a total of 850, 000 sqm of new office space Commitment to sustainability Vigour Audacity 18 Modernity Etudes & Recherche March 2007 xxxxx. C 03 Paris:
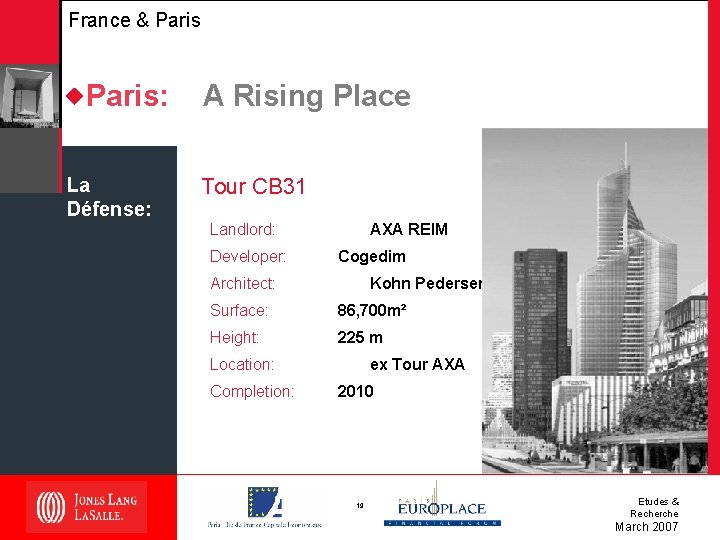
France & Paris: A Rising Place La Défense: Tour CB 31 Landlord: Developer: AXA REIM Cogedim Architect: Kohn Pedersen Fox Surface: 86, 700 m² Height: 225 m Location: 2010 xxxxx. C 03 Completion: ex Tour AXA 19 Etudes & Recherche March 2007
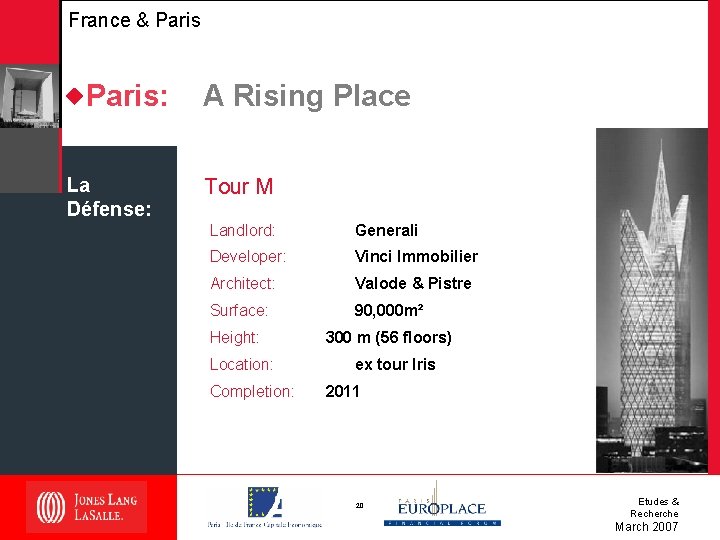
France & Paris: A Rising Place La Défense: Tour M Landlord: Generali Developer: Vinci Immobilier Architect: Valode & Pistre Surface: 90, 000 m² Height: 300 m (56 floors) Completion: ex tour Iris 2011 xxxxx. C 03 Location: 20 Etudes & Recherche March 2007
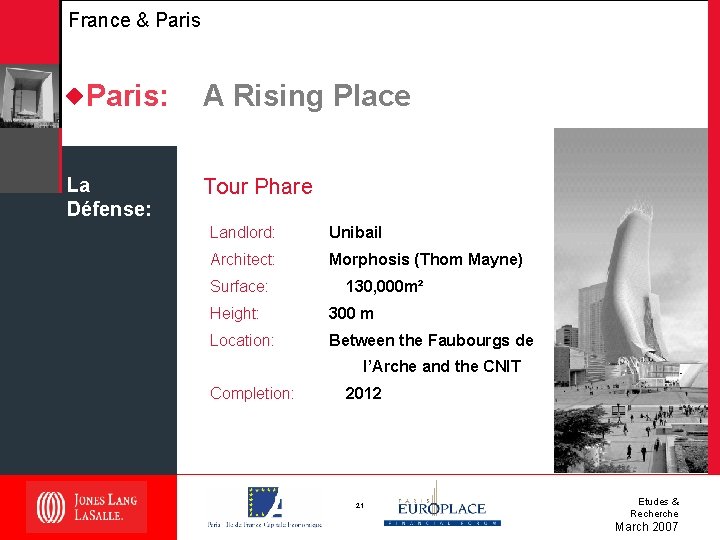
France & Paris: A Rising Place La Défense: Tour Phare Landlord: Unibail Architect: Morphosis (Thom Mayne) Surface: 130, 000 m² Height: 300 m Location: Between the Faubourgs de l’Arche and the CNIT 2012 xxxxx. C 03 Completion: 21 Etudes & Recherche March 2007
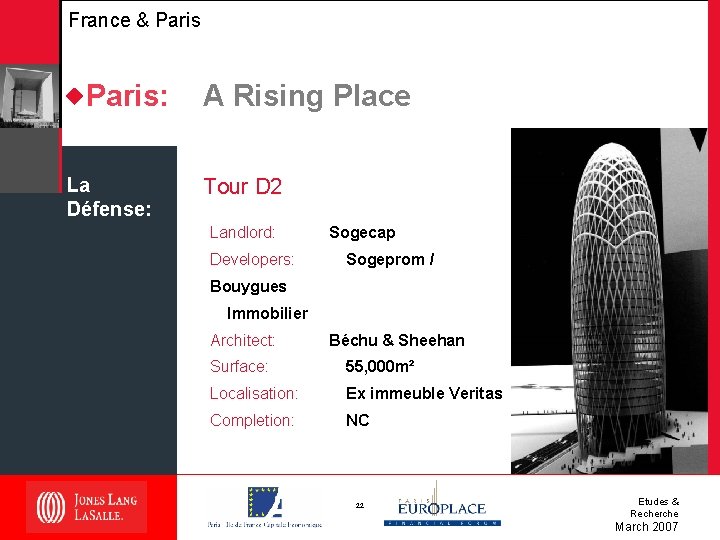
France & Paris: A Rising Place La Défense: Tour D 2 Landlord: Developers: Sogecap Sogeprom / Bouygues Immobilier Architect: Béchu & Sheehan 55, 000 m² Localisation: Ex immeuble Veritas Completion: NC xxxxx. C 03 Surface: 22 Etudes & Recherche March 2007
France & Paris & France: Opportunities … And Many More Outsourcing of Public Real Estate Hotels Shopping Centres Warehousing xxxxx. C 03 Residential 23 Etudes & Recherche March 2007
France & Paris COPYRIGHT © 2007 No part of this presentation may be reproduced or transmitted in any form or by any means, or stored in any database or retrieval system of any nature, without prior written permission of Jones Lang La. Salle except for any permitted fair dealing in accordance with all applicable copyright laws. Full acknowledgement must be given for any such use. This presentation is based upon materials either compiled by us through independent research or supplied to us by third parties. Whilst we have made every effort to ensure the accuracy and completeness of the data used in the presentation, we cannot offer any warranty that no factual errors are present. We take no responsibility for any direct or indirect actual or potential damage or loss suffered as a result of any inaccuracy or incompleteness of any kind in this presentation. We would, however, like to be told of any such errors in order to correct them. These forecasts are generated from a range of statistical techniques, including econometric models. They are subject to errors stemming from three main sources: measurement and statistical errors, which relate to raw data and the econometric model, as well as errors arising from assumptions regarding the future behaviour of explanatory variables. As a result, we place greater emphasis on trends and turning points than on precise values. Jones Lang La. Salle takes no responsibility for any damage or loss suffered by reason of the inaccuracy or incorrectness of this report. 24 Etudes & Recherche March 2007 xxxxx. C 03