PARAMETERS Quantitative parameter Overall Pass percentage or Pass


 SUBJEC T GOVT. App Pass Public")


- Slides: 75
PARAMETERS • Quantitative parameter - Overall Pass percentage or Pass percentage in a particular subject is taken as quantitative parameter. • Qualitative parameter – Summation of marks divided by number of children appeared is taken as qualitative parameter. This is basically mean or average marks obtained by the children.
Units of Analysis and comparison • • • State District Zone Govt. Schools Private Schools All Schools taken together
This year our result has been increased by 11. 7% from 48. 03% of 2004 -05 to 59. 73% In 2006. First time, Directorate of Education achieved this much pass percentage.
• Not only the increase in result is highest but the number of appearing candidates is also highest at 96551 exceeding the previous highest 91422 in 1999 -00 for the last nine years. • This year has started the reversal of trend towards decrease in number of students appearing for Class-X exam from Government Schools.
CBSE Result for Class-X for the last Nine Years Year No. of students appeared Pass percentage(%) 1997 -98 88846 32. 1 1998 -99 89746 34. 57 1999 -00 91422 38. 95 2000 -01 72278 40. 2 2001 -02 83086 46. 14 2002 -03 79069 48. 87 2003 -04 79330 50. 77 2004 -05 85479 48. 0 2005 -06 96551 59. 73
Class -X CBSE Result for the last Nine Years 59. 73 55. 00 50. 00 46. 14 45. 00 48. 03 40. 20 Academic Year 2005 -06 2004 -05 2003 -04 2002 -03 2001 -02 2000 -01 30. 00 48. 87 50. 77 34. 57 32. 10 1999 -00 35. 00 38. 95 1998 -99 40. 00 1997 -98 Pass Percentage 60. 00
However, the result has been increasing for the last Nine Years consistently except 2004 -05.
• RPVV Schools have fared the best. • Sarvodaya Schools have done significantly better than Non Sarvodaya schools, but non-sarvodaya schools have reduced the gap. • Even among Non Sarvodaya Schools Sr. Secondary Schools have done better than Secondary Schools, but this year Non. Sarvodaya schools have reduced the gap.
An overall view of 2006 Result when compared to 2005’s 2006 Category RPVV App 937 Pass 2005 PP % 919 98. 08 App Pass 723 706 PP% 97. 65 Diff in PP% 0. 43 Sarvoda ya 43350 27468 63. 36 40192 21377 53. 19 10. 17 Non Sarvoda ya 52264 29280 56. 02 44564 18973 42. 57 13. 07 Total 96551 57667 59. 73 85479 41056 48. 03 11. 73
Result according to Category of Schools-Class X-2006 Category Appea Passed Pass % red Total Marks Q. I 937 919 98. 08 342460 365. 49 Sarvodaya 43350 27468 63. 36 10325931 238. 20 Sec. 14408 7827 54. 32 3133202 217. 46 Sen. Sec. 37856 21453 56. 67 8494075 224. 37 Total 96551 57667 59. 73 22295668 230. 92 RPVV
Region-wise CBSE Result comparison with 2005's Class X 2006 Region 2005 PP% App Pass Name of the RDE App Pass WEST 15232 9726 63. 9 13136 7072 53. 8 10. 1 Sh. R. S. Khokhar NORTH 19221 12136 63. 1 17294 8219 47. 5 15. 6 Sh. R. S. Khokhar SOUTH 25728 15661 60. 9 22975 EAST 29441 15908 54 Central 6929 4236 61. 1 Total 96551 57667 59. 7 85459 41056 48. 0 11. 7 10487 PP% increa se in PP% 45. 7 15. 2 Sh. D. R. Tamta 25827 12130 47. 0 6227 3148 50. 6 7. 1 Dr. M. C. Mathur 10. 6 Sh. R. S. Khokhar
District wise Ranking according to Quality Index 2006 QI_0 5 Incr_ over 05_P P 55. 30 247. 25 224. 33 8. 76 22. 93 10. 71 5652 56. 68 241. 45 217. 51 8. 68 23. 94 14. 93 5593 2995 53. 55 233. 01 213. 87 8. 89 19. 14 9. 20 69. 32 9781 5200 53. 16 246. 37 214. 55 16. 16 31. 82 5. 31 263 62. 77 329 193 58. 66 229. 50 222. 94 4. 11 6. 56 21. 48 6891 4621 67. 06 6037 3404 56. 39 244. 51 216. 26 10. 67 28. 24 12. 39 WEST-B 9072 5880 64. 81 7543 4077 54. 05 235. 95 214. 41 10. 76 21. 54 16. 85 SOUTH WEST-A 4092 2506 61. 24 3651 1846 50. 56 235. 34 208. 42 10. 68 26. 93 10. 78 NORTH WEST-A 8892 4976 55. 96 7513 3019 40. 18 226. 03 198. 47 15. 78 27. 56 15. 51 SOUTH 14745 8534 57. 88 13287 5237 39. 41 222. 02 192. 85 18. 46 29. 17 9. 89 NORTH EAST 17720 8247 46. 54 15856 6478 40. 86 212. 30 189. 73 5. 69 22. 57 10. 52 1506 767 50. 93 1430 484 33. 85 211. 16 188. 77 17. 08 22. 39 5. 05 96551 57667 59. 73 85459 41056 48. 04 230. 92 205. 42 11. 69 25. 50 11. 49 DISTRICT 2006 PAS S PP% 5004 3206 64. 07 4468 2471 11721 7661 65. 36 9971 6160 3846 62. 44 10329 7160 419 SOUTH WEST-B NORTH EAST WEST-A NORTH WEST-B NEW DELHI CENTRAL TOTAL APP 2005 APP PASS PP% Incr_ over 05_QI %Incr over App_05
Ranking according to Quality Index 2006 DISTRICT 2006 APP NORTH PASS Name of the DDE 2005 PP% APP PASS PP% QI_06 QI_05 5004 3206 64. 07 4468 2471 55. 30 247. 25 224. 33 Shri R. K. Sharma 11721 7661 65. 36 9971 5652 56. 68 241. 45 217. 51 Shri R. N. Sharma 6160 3846 62. 44 5593 2995 53. 55 233. 01 213. 87 Ms. B. Tirkey 10329 7160 69. 32 9781 5200 53. 16 246. 37 214. 55 Sh. K. D. jassal 419 263 62. 77 329 193 58. 66 229. 50 222. 94 Mrs. Neelam Verma SOUTH WEST-B 6891 4621 67. 06 6037 3404 56. 39 244. 51 216. 26 Sh. Prem Singh WEST-B 9072 5880 64. 81 7543 4077 54. 05 235. 95 214. 41 Mrs. Daljit kaur SOUTH WEST-A 4092 2506 61. 24 3651 1846 50. 56 235. 34 208. 42 Sh. R. A. yadav NORTH WEST-A 8892 4976 55. 96 7513 3019 40. 18 226. 03 198. 47 Mrs. Anita Satia SOUTH 14745 8534 57. 88 13287 5237 39. 41 222. 02 192. 85 Sh. B. N. Bajpai NORTH EAST 17720 8247 46. 54 15856 6478 40. 86 212. 30 189. 73 Sh. Dahram vir Singh 1506 767 50. 93 1430 484 33. 85 211. 16 188. 77 Mrs. Neelam Verma 96551 57667 59. 73 85459 41056 48. 04 230. 92 205. 42 EAST WEST-A NORTH WEST-B NEW DELHI CENTRAL TOTAL
0. 00 10. 00 District NEW DELHI WEST-A 19. 14 21. 54 22. 39 CENTRAL WEST-B 22. 57 5. 00 NORTH EAST 15. 00 22. 93 20. 00 NORTH 6. 56 26. 93 27. 56 28. 24 23. 94 25. 00 EAST SOUTH WEST-A NORTH WEST-A SOUTH WEST-B 29. 17 30. 00 SOUTH 31. 82 35. 00 NORTH WEST-B Quality Index Difference Districtwise ranking on the basis of increased quality index over previous year
Ranking according to Actual Pass Percentage CBSE - 2006 DISTRICT 2005 APP PASS PP% APP NORTH WEST-B 10329 7160 69. 32 9781 5200 53. 16 246. 37 214. 55 Sh. K. D. jassal SOUTH WEST-B 6891 4621 67. 06 6037 3404 56. 39 244. 51 216. 26 Sh. Prem Singh 11721 7661 65. 36 9971 5652 56. 68 241. 45 217. 51 Shri R. N. Sharma WEST-B 9072 5880 64. 81 7543 4077 54. 05 235. 95 214. 41 Mrs. Daljit kaur NORTH 5004 3206 64. 07 4468 2471 419 263 62. 77 329 WEST-A 6160 3846 62. 44 5593 2995 53. 55 233. 01 213. 87 Ms. B. Tirkey SOUTH WEST-A 4092 2506 61. 24 3651 1846 50. 56 235. 34 208. 42 Sh. R. A. yadav 14745 8534 57. 88 13287 5237 39. 41 222. 02 192. 85 Sh. B. N. Bajpai NORTH WEST-A 8892 4976 55. 96 7513 3019 40. 18 226. 03 198. 47 Mrs. Anita Satia CENTRAL 1506 767 50. 93 1430 17720 8247 46. 54 15856 EAST NEW DELHI SOUTH NORTH EAST PASS Name of the DDE PP% QI_06 QI_05 55. 3 247. 25 224. 33 Shri R. K. Sharma 193 58. 66 229. 5 222. 94 Mrs. Neelam Verma 484 33. 85 211. 16 188. 77 Mrs. Neelam Verma 6478 40. 86 212. 3 189. 73 Sh. Dahram vir Singh
40. 00 67. 06 District NORTH EAST CENTRAL NORTH WEST-A SOUTH 46. 54 50. 93 55. 96 57. 88 61. 24 62. 44 WEST-A SOUTH WEST-A 62. 77 NEW DELHI 64. 07 45. 00 NORTH 50. 00 64. 81 55. 00 WEST-B 60. 00 65. 36 65. 00 EAST SOUTH WEST-B 69. 32 70. 00 NORTH WEST-B PP% District wise ranking on the basis of actual pass percentage
Ranking according to increase in Pass Percentage - CBSE - 2006 2005 DISTRICT APP SOUTH CENTRAL PASS PP% APP PASS PP% 767 50. 93 1430 Name of the DDE 18. 47 Sh. B. N. Bajpai 484 33. 85 17. 08 Mrs. Neelam Verma 14745 8534 57. 88 13287 5237 39. 41 1506 increase in PP% NORTH WEST-B 10329 7160 69. 32 9781 5200 53. 16 16. 16 Sh. K. D. jassal NORTH WEST-A 8892 4976 55. 96 7513 3019 40. 18 15. 78 Mrs. Anita Satia WEST-B 9072 5880 64. 81 7543 4077 54. 05 10. 76 Mrs. Daljit kaur SOUTH WEST-A 4092 2506 61. 24 3651 1846 50. 56 10. 68 Sh. R. A. yadav SOUTH WEST-B 6891 4621 67. 06 6037 3404 56. 39 10. 67 Sh. Prem Singh WEST-A 6160 3846 62. 44 5593 2995 53. 55 8. 89 Ms. B. Tirkey NORTH 5004 3206 64. 07 4468 2471 55. 3 8. 77 Shri R. K. Sharma EAST 11721 7661 65. 36 9971 5652 56. 68 8. 68 Shri R. N. Sharma NORTH EAST 17720 8247 46. 54 15856 6478 40. 86 5. 68 Sh. Dahram vir Singh 4. 11 Mrs. Neelam Verma NEW DELHI 419 263 62. 77 329 193 58. 66
8. 76 8. 68 NORTH EAST 5. 69 8. 00 6. 00 4. 11 8. 89 10. 67 SOUTH WEST-B WEST-A 10. 68 SOUTH WEST-A 10. 00 District NEW DELHI NORTH EAST 0. 00 CENTRAL 2. 00 SOUTH PP% 12. 00 10. 76 15. 78 NORTH WEST-A 14. 00 WEST-B 16. 16 16. 00 NORTH WEST-B 18. 00 percentage over the last year 17. 08 20. 00 18. 46 on the of increased Ranking on. Ranking the basis of basis increase in pass percentage
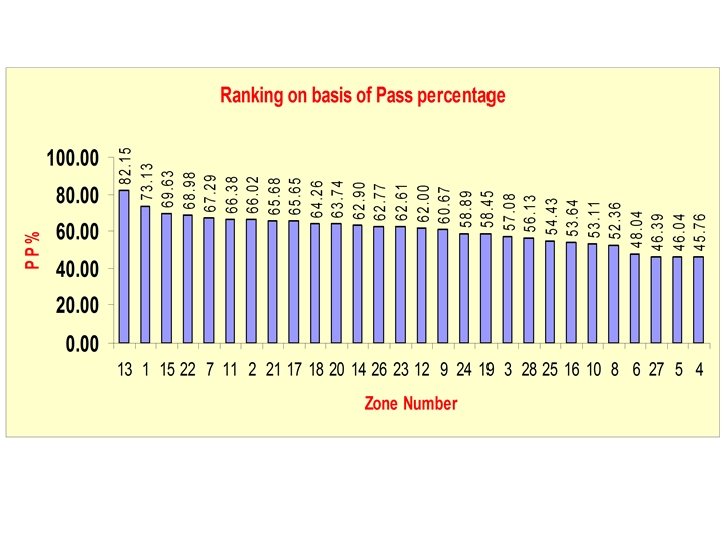
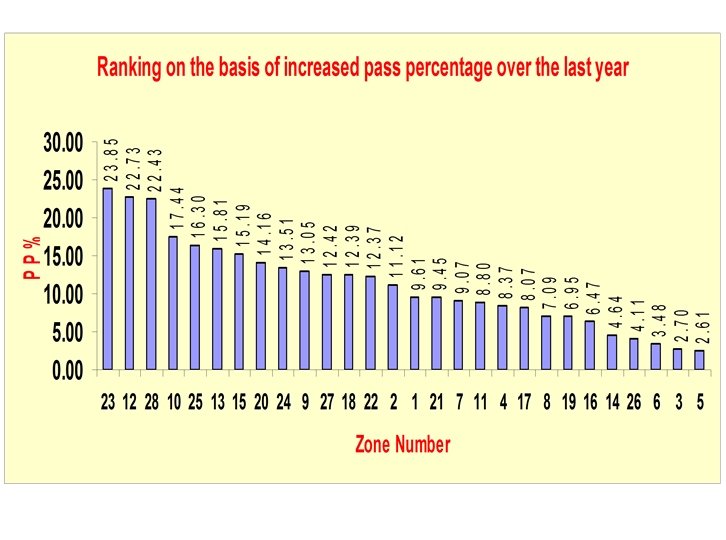
Zone-wise CBSE Result – 2006 according to PP – Class X 2006 2005 Sl. No. Zone 1 13 3064 2517 82. 2 3134 2079 66. 3 15. 8 Mr. R. P. Yadav 2 1 2445 1788 73. 1 2212 1405 63. 5 9. 61 Mrs. B. B. Punj. 3 15 2107 1467 69. 6 1861 1013 54. 4 15. 2 4 22 2888 1992 69 2574 1457 56. 6 12. 4 Shri J. B. Singh 5 7 3925 2641 67. 3 3463 2016 58. 2 9. 07 Mrs. Santosh Sharma 6 11 3165 2101 66. 4 2789 1606 57. 6 8. 8 Mrs. P. D. Yadav. 7 2 6471 4272 66 5381 2954 54. 9 11. 1 Mrs. Savita Kalra 8 21 4003 2629 65. 7 3463 1947 56. 2 9. 45 Mr. V. V. Bhatnagar 9 17 3639 2389 65. 7 2883 1660 57. 6 8. 07 Mrs. Neena Kumari 10 18 5433 3491 64. 3 4660 2417 51. 9 12. 4 Mrs. Uma Suryanarayan 11 20 2162 1378 63. 7 1783 884 49. 6 14. 2 Mr. M. V. S. Thakur 12 14 2213 1392 62. 9 1998 1164 58. 3 4. 64 13 26 419 263 62. 8 329 193 58. 7 4. 11 Mrs. Mona Sawhney, DEO 14 23 4985 3121 62. 6 4954 1920 38. 8 23. 9 Mrs. Bimla Singh APP Pass PP% App Pass Name of the EO/DEO PP% Diff PP Mr. D. K. Seth, DEO Mr. Devi Singh
Zone-wise CBSE Result – 2006 according to PP – Class X Sl. No. 2006 2005 Name of the EO/DEO Zone APP Pass PP% App Pass PP% Diff PP 15 12 4100 2542 62 3858 1515 39. 3 22. 7 Mr. R. A. Haritash 16 9 3354 2035 60. 7 2839 1352 47. 6 13. 1 Mrs. S. R. Kapoor 17 24 2250 1325 58. 9 1917 870 45. 4 13. 5 Ms. Ritu Marwah 18 19 1930 1128 58. 5 1868 962 51. 5 6. 95 Mrs. Kullu 19 3 2805 1601 57. 1 2378 1293 54. 4 2. 7 20 28 702 394 56. 1 644 217 33. 7 22. 4 Mr. Khan Chand 21 25 7510 4088 54. 4 6416 2447 38. 1 16. 3 Dr. Suman Rekha 22 16 1840 987 53. 6 1734 818 47. 2 6. 47 Mrs. Usha Sahawney 23 10 5538 2941 53. 1 4674 1667 35. 7 17. 4 Mr. Kshetra Pal 24 8 1079 565 52. 4 1005 45. 3 7. 09 Mr. J. C. Sharma 25 6 5627 2703 48 5079 2263 44. 6 3. 48 Mrs. Usha Kumari 26 27 804 373 46. 4 786 267 34 12. 4 Mr. Shukla Malhotra 27 5 3534 1627 46 3067 1332 43. 4 2. 61 Mr. R. P. Garg 28 4 8559 3917 45. 8 7710 2883 37. 4 8. 37 Mr. A. P. Dondiyal Mr. L. R. Sailo
• If taken subject wise children of Government Schools have performed worst in Mathematics. • Mathematics is the limiting factor which is pulling down the over all result of Delhi Government Schools. • English is the next limiting factor of Delhi Government School Results.
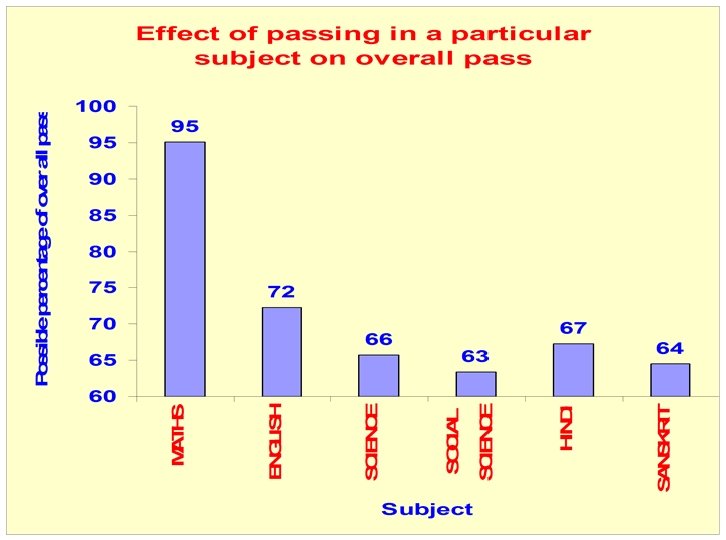
Last Year Slide • Passing in Mathematics gives you the highest possibility in over all passing. • If you pass in Mathematics there is a 90% chance that you will pass overall. • If the pass percentage of mathematics is brought to the level of English the over all result of Delhi Govt. Schools will improve by 12%. PS: It has happened exactly this year.
Subject wise Pass Percentage - All Govt. Subject 2006 2005 Difference Comm. Sanskrit 92. 5 89. 1 3. 4 English Lng. & Lit. 74. 8 67. 3 7. 5 Hindi Course-A 87. 1 85. 8 1. 3 Mathematics 63. 2 53. 3 9. 9 Science & Tech. 91. 1 85. 6 5. 5 Social Science 94. 5 81. 8 12. 7 Punjabi 92. 3 92. 9 -0. 6 Urdu Course-B 91. 3 94. 1 -2. 8
• Like last year, Zone-XIII and Zone-I have the highest pass percentage. • Increase in appearing candidates in all zones with a minimum of 5. 05 in Central and a maximum of 16. 85 in West-B.
There is a slight trend of decrease in pass percentage with increase in percentage of appearing candidates.
Comparison of increase in appearing candidates and increase in pass percentage 18. 46 18. 00 17. 08 16. 16 16. 00 15. 78 14. 00 10. 68 10. 67 12. 00 10. 00 8. 89 8. 00 6. 00 10. 76 8. 68 8. 76 5. 69 4. 11 4. 00 2. 00 10. 78 12. 39 14. 93 15. 51 16. 85 21. 48 SW-A SW-B East NW-A West-B New Delhi 9. 89 South North 10. 71 9. 20 West-A 10. 52 5. 31 NW-B North East 5. 05 0. 00 Central increase in pass percentage 20. 00
GOVERNMENT SCHOOLS - 100% RESULT Sl. No. 2006 Name of the School 2005 App Pass PP% 100 100 1 RPVV, SURAJMAL VIHAR DELHI 95 95 100 2 RPVV, GANDHI NGR DLI 68 68 100 0 3 4 RPVV, SEC 10 DWARKA ND 65 56 100 48 34 48 100 34 100 5 RPVV, NAND NAGRI DLI 70 70 100 0 6 RPVV, KISHAN GUNJ DL 33 33 100 45 43 95. 56 7 GOVT. CO-EDU. SEC SCH SECTOR 15 ROHINI DELHI 33 33 100 32 17 53. 13 8 SARVODAYA GIRLS SSS GHITORNI NEW DELHI 86 86 100 35 35 100 9 GOVT BOYS SEC SCHOOL PHASE II NANGLOI DELHI 72 72 100 26 19 73. 08 RPVV, LODI ROAD ND
RPVVs RESULT AT A GLANCE Sl. No. School Name Schid App Pass PP% 1 PRATIBHA VIKAS VIDYALAYA SURAJMAL VIHAR DELHI 1001104 95 95 100. 00 2 RAJKIYA PRATIBHA VIKAS VIDYALAYA GANDHI NGR DLI 1003261 68 68 100. 00 3 RAJKIYA PRATIBHA VIKAS VIDYALAYA SEC 10 DWARKA ND 1821137 65 65 100. 00 4 PRATIBHA VIKAS VIDYALAYA SEC XI ROHINI DELHI 1413076 94 93 98. 94 5 RAJKIYA PRATHIBHA VIKAS VID. YAMUNA VIHAR DELHI 1104149 102 100 98. 04 6 PRATIBHA VIKAS VIDYALAYA A-6 PASCHIM VIHAR ND 1617009 87 84 96. 55 7 RAJKIYA PRATIBHA VIKAS VIDALAYA LODI ROAD ND 1924038 56 56 100. 00 8 RAJK. PRATB. VIKAS VID. SHALIMAR BAGH DELHI 1309124 69 66 95. 65 9 RAJKIYA PRATIBHA VIKAS VIDYALAYA NAND NAGRI DLI 1106252 70 70 100. 00 10 RAJKIYA PRATIBHA VIKAS VIDYALAYA LAJPAT NGR N D 1925334 22 21 95. 45 11 RAJKIYA PRATIBHA VIKAS VIDYALYA KISHAN GUNJ DL 1208092 33 33 100. 00 12 RAJKIYA PRATIBHA VIKAS VIDYALAYA VASANT KUNJ ND 1720031 70 67 95. 71 13 R. P. V. V. PLOT 1 LINK RD KAROL BAGH N D 2128031 44 43 97. 73 14 RAJKIYA PRATIBHA VIKAS VIDYALAYA HARI NAGAR ND 1514023 62 58 93. 55
• This year there are three schools in top 100 compared to one last year in terms of quality. • Like last year, among Govt. Schools RPVV, Surajmal Vihar is the best performer. It has improved its rank from 27 th to 24 th. • RPVV Gandhi Nagar at 42 nd Rank. • RPVV Dwarka at 52 nd Rank.
RPVVs WHEN COMPARED TO LAST YEAR’S CBSE RESULT 2006 Sl. No. School Name App Pass 2005 PP% APP Pass Overall Rank PP % 2006 Overall Rank 2005 1 PVV SURAJMAL VIHAR DELHI 95 95 100 100 24 27 2 PVV GANDHI NGR DLI 68 68 100 0 42 - 3 PVV SEC 10 DWARKA ND 65 65 100 48 48 100 52 124 4 PVV SEC XI ROHINI DELHI 94 93 98. 9 97 97 100 128 168 5 PVV, YAMUNA VIHAR DELHI 102 100 98 102 100 149 197 6 PVV, PASCHIM VIHAR ND 87 84 96. 6 97 94 96. 9 155 183 7 PVV, LODI ROAD ND 56 56 100 34 34 100 168 200 8 PVV, SHALIMAR BAGH DELHI 69 66 95. 7 70 68 97. 1 170 179 9 PVV, NAND NAGRI DLI 70 70 100 0 186 - 10 PVV, LAJPAT NGR N D 22 21 95. 5 0 0 0 212 - 11 PVV, KISHAN GUNJ DL 33 33 100 45 43 95. 6 218 267 12 PVV, VASANT KUNJ ND 70 67 95. 7 36 34 94. 4 250 297 13 R. P. V. V. PLOT 1 LINK RD KAROL BAGH N D 44 43 97. 7 30 26 86. 7 287 387 14 PVV, HARI NAGAR ND 62 58 93. 5 64 60 93. 8 290 292
Result of Ludlow Castle Schools 2006 SNo Name of the School App Pass PP% 05 QI_06 QI_05 Ran k QI_ 06 1 S A B GOVT SARVODAYA VIDYALAYA LUDLOW CASTLE DLI 152 145 95. 39 94. 16 312. 37 289. 72 21 2 S B B M SARVODAYA VID. SHANKARACHARYA MARG DL 227 192 84. 58 82. 41 301. 68 270. 88 29 3 S B K V SARVODAYA VIDYALAYA CIVIL LINES DELHI 215 199 92. 56 81. 15 301. 32 262. 99 30 4 S AMIR CHAND SARVODAYA VID SHAM NATH MARG DLI 181 144 79. 56 89. 08 284. 69 283. 82 54
Top 10 Non-pratibha Schools Sl. No. 2006 Name of the School APP Pass 2005 PP% APP Pass Quality Index PP% Rank 2006 2005 diff in PP 1 GOVT BOYS SR SEC SCH 1 SHAKTI NAGAR DELHI 105 102 97 152 132 87 340 280 13 22 10 2 GOVT GIRLS SR SEC SCH NO 1 ROOP NAGAR DELHI 173 169 98 146 135 92 339 316 14 12 5 3 SARVODAYA GIRLS SSS SECT -VIII ROHINI DLI 94 90 96 104 94 90 327 279 16 24 5 4 SARVODAYA CO-ED SR SEC SCH SARASWATI VIHAR DL 121 119 98 116 100 86 318 282 19 21 12 5 GOVT GIRLS SR SEC SCHOOL 1 SHAKTI NAGAR DELHI 169 155 92 164 150 91 318 300 20 13 0 6 S A B GOVT SARVODAYA VIDYALAYA LUDLOW CASTLE DLI 152 145 95 137 129 94 312 290 21 17 1 7 SARVODAYA GIRLS SS O-BLK MANGOLPURI DELHI 64 62 97 60 46 77 311 241 22 115 20 8 GOVT GIRLS SEC SCH GHUMANHERA N DELHI 30 27 90 25 16 64 310 239 23 128 26 9 SCSD SARVODYA CO-ED S SECTOR-9 ROHINI DELHI 142 139 98 186 159 85 304 279 24 23 12 10 GOVT. CO-EDU. SEC SCH SECTOR 15 ROHINI DELHI 33 33 100 32 17 53 304 221 25 272 47
Best Schools Some schools do much better keeping in view the larger number of appearing candidates. If we take top seventy students of such a school, it surpasses the performance of almost all RPVVs, which have seventy students on an average.
Top 5 Pratibha PRATIBHA VIKAS VIDYALAYA SURAJMAL VIHAR DELHI RAJKIYA PRATIBHA VIKAS VIDYALAYA GANDHI NGR DLI RAJKIYA PRATIBHA VIKAS VIDYALAYA SEC 10 DWARKA ND PRATIBHA VIKAS VIDYALAYA SEC XI ROHINI DELHI RAJKIYA PRATHIBHA VIKAS VID. YAMUNA VIHAR DELHI QI_06 Top 5 Non. Pratibha(Top 70) QI_06 407 GOVT GIRLS SR SEC SCH NO 1 ROOP NAGAR DELHI 398 399 GOVT GIRLS SR SEC SCHOOL 1 SHAKTI NAGAR DELHI 381 392 S B B M SARVODAYA VID. SHANKARACHARYA MARG DL 381 371 S A B GOVT SARVODAYA VIDYALAYA LUDLOW CASTLE DLI 373 366 S B K V SARVODAYA VIDYALAYA CIVIL LINES DELHI 372
• There are four schools having less than 10% results. All these four have 0% result. This number has reduced to 4 from the previous year’s 9.
Schools having less than 10% Result 2006 Name of the School schid 2005 APP Pas s PP % AP P 2004 Pas PP s % AP P Pa ss PP% G G SEC SCH 2 SFT CHASHMA BLD BALLI. MARAN DLI 2127028 12 0 0 5 0 0 13 1 7. 69 G G SR SEC SCH SUSHILA MOHAN MRG NAYA BZR DL 1208089 2 0 0 6 0 0 14 2 14. 29 GOVT CO EDU SR SEC SCHOOL ISSAPUR NEW DELHI 1822029 4 0 0 10 3 30 16 5 31. 25 GOVT LADY NOYCE S SCH(D&D)FEROZSHAH KOTLA N D 2127034 45 0 0 56 24 43 54 1 1. 85
Schools having pass percentage 25% or below Sl. No. 2006 School Name Schid App Pas s 2005 PP% App Pas s PP% 1 GOVT CO-EDU SEC SCH TELIWARA SHAHDARA DELHI 1001151 16 4 25. 00 18 5 27. 78 2 GOVT BOYS SR SEC SCH DEV NAGAR NEW DELHI 2128007 36 9 25. 00 43 14 32. 56 3 GOVT BOYS SR SEC SCHOOL SEEMA PURI DELHI 1106009 252 63 25. 00 213 42 19. 72 4 GOVT GIRLS SR SEC SCH K BLK JAHANGIR PURI DELHI 1310158 326 80 24. 54 203 34 16. 75 5 GOVT BOYS SR SEC SCHOOL CHHAWLA NEW DELHI 1821036 45 11 24. 44 37 12 32. 43 6 GOVT BOYS SEC SCH NO-2 NEW SEELAMPUR DELHI 1105009 153 37 24. 18 79 24 30. 38 7 GOVT BOYS SR SEC SCH KARAWAL NAGAR DELHI 1104143 302 73 24. 17 311 85 27. 33 8 SARVODAYA BOYS SR SEC SCH BANKNER DELHI 1310168 120 29 24. 17 86 30 34. 88 9 GOVT GIRLS SEC SCH KALA MAHAL DARYAGANJ N DLI 2127027 46 11 23. 91 30 8 26. 67 10 GOVT BOYS SR SEC SCHOOL 2 SHAKTI NAGAR DELHI 1207020 74 17 22. 97 26 6 23. 08 11 SARVODAYA COED SSS TIKRI KHURD DELHI 1310005 88 20 22. 73 74 19 25. 68 12 GOVT BOYS SEC SCH 2 ND SHIFT ANAND VAS DELHI 1411020 62 14 22. 58 37 11 29. 73 13 SARVODAYA BOYS SEC SCHOOL SANOTH DELHI 1310004 71 16 22. 54 64 17 26. 56 14 GOVT BOYS SEC SCH PRASAD NAGAR NEW DELHI 2128033 18 4 22. 22 31 4 12. 90 15 SARVODAYA GIRLS SR SEC SCH SHASTRI PARK DELHI 1105021 160 34 21. 25 138 45 32. 61 16 GOVT CO EDU SR SEC SCHOOL JHATIKARA NEW DELHI 1822025 19 4 21. 05 36 8 22. 22
Schools having pass percentage 25% or below 17 GOVT GIRLS S S SCHOOL HAVELI AZAMKHAN N DELHI 2127022 48 10 20. 83 28 12 42. 86 18 GOVT GIRLS SR SEC SCHOOL NEW SEELAMPUR DELHI 1105025 91 18 19. 78 10 3 11 10. 68 19 GOVT BOYS SR SEC SCH SHAHBAD MOHD PUR N DELHI 1821041 57 11 19. 30 31 17 54. 84 20 SARVODAYA BOYS SSS NO 1 NEW SEELAMPUR DLI 1105004 126 24 19. 05 11 3 20 17. 70 21 GOVT GIRLS SR. SEC SCH NO 1 LAL KUAN DELHI 1208024 11 2 18. 18 14 4 28. 57 22 GOVT CO-ED SEC SCHOOL BARA HINDU RAO DELHI 1208091 22 4 18. 18 7 2 28. 57 23 SARVODAYA BOYS S QUTAB ROAD DELHI 1208002 36 6 16. 67 21 8 38. 10 24 GOVT BOYS SEC SCH UM MATIA MAHAL J MASJID DLI 2127008 12 2 16. 67 18 1 5. 56 25 GOVT BOYS SR SEC SCHOOL R P BAGH DELHI 1309012 44 7 15. 91 48 2 4. 17 26 SARVODAYA BOYS SSS NO-1 (UM) JAMA MASJID DLI 2127002 20 3 15. 00 34 5 14. 71 27 GOVT BOYS SR SEC SCHOOL RAMPURA DELHI 1411018 29 4 13. 79 45 8 17. 78 28 G G SR SEC SCHOOL CHASHMA BLDG BALLIMARAN DLI 2127025 44 6 13. 64 40 9 22. 50 29 GOVT GIRLS SR SEC SCH PATAUDI HOUSE D GANJ ND 2127020 15 2 13. 33 22 0 0. 00 30 G G SR SEC SCH GALI BARAF WALI KINARI BZR DLI 1208023 9 1 11. 11 6 2 33. 33 31 G G SEC SCH 2 SFT CHASHMA BLD BALLI. MARAN DLI 2127028 12 0 0. 00 5 0 0. 00 32 G G SR SEC SCH SUSHILA MOHAN MRG NAYA BZR DL 1208089 2 0 0. 00 6 0 0. 00 33 GOVT CO EDU SR SEC SCHOOL ISSAPUR NEW DELHI 1822029 4 0 0. 00 10 3 30. 00 34 GOVT LADY NOYCE S SCH(D&D)FEROZSHAH KOTLA N D 2127034 45 0 0. 00 56 24 42. 86
Schools having pass percentage > 95% Sl. No Name of the School schid App Pass PP% 1 PRATIBHA VIKAS VIDYALAYA SURAJMAL VIHAR DELHI 1001104 95 95 100 2 RAJKIYA PRATIBHA VIKAS VIDYALAYA GANDHI NGR DLI 1003261 68 68 100 3 RAJKIYA PRATIBHA VIKAS VIDYALAYA SEC 10 DWARKA ND 1821137 65 65 100 4 RAJKIYA PRATIBHA VIKAS VIDALAYA LODI ROAD ND 1924038 56 56 100 5 RAJKIYA PRATIBHA VIKAS VIDYALAYA NAND NAGRI DLI 1106252 70 70 100 6 RAJKIYA PRATIBHA VIKAS VIDYALYA KISHAN GUNJ DL 1208092 33 33 100 7 GOVT. CO-EDU. SEC SCH SECTOR 15 ROHINI DELHI 1413071 33 33 100 8 SARVODAYA GIRLS SSS GHITORNI NEW DELHI 1720033 86 86 100 9 GOVT BOYS SEC SCHOOL PHASE II NANGLOI DELHI 1617024 72 72 100 10 PRATIBHA VIKAS VIDYALAYA SEC XI ROHINI DELHI 1413076 94 93 98. 9 11 SARVODAYA CO-ED SR SEC SCH SARASWATI VIHAR DL 1411123 121 119 98. 3 12 RAJKIYA PRATHIBHA VIKAS VID. YAMUNA VIHAR DELHI 1104149 102 100 98. 0 13 SCSD SARVODYA CO-ED S SECTOR-9 ROHINI DELHI 1413010 142 139 97. 9 14 R. P. V. V. PLOT 1 LINK RD KAROL BAGH N D 2128031 44 43 97. 7 15 GOVT GIRLS SR SEC SCH NO 1 ROOP NAGAR DELHI 1207039 173 169 97. 7 16 GOVT BOYS SR SEC SCH 1 SHAKTI NAGAR DELHI 1207019 105 102 97. 1 17 SARVODAYA GIRLS SS O-BLK MANGOLPURI DELHI 1412031 64 62 96. 9 18 PRATIBHA VIKAS VIDYALAYA A-6 PASCHIM VIHAR ND 1617009 87 84 96. 6 19 SARVODAYA GIRLS S RAJOURI GARDEN EXT ND 1515021 131 126 96. 2 20 SARVODAYA GIRLS SSS SECT-VIII ROHINI DLI 1413027 94 90 95. 7 21 RAJKIYA PRATIBHA VIKAS VIDYALAYA VASANT KUNJ ND 1720031 70 67 95. 7 22 RAJK. PRATB. VIKAS VID. SHALIMAR BAGH DELHI 1309124 69 66 95. 7 23 RAJKIYA PRATIBHA VIKAS VIDYALAYA LAJPAT NGR N D 1925334 22 21 95. 5 24 S A B GOVT SARVODAYA VIDYALAYA LUDLOW CASTLE DLI 1207108 152 145 95. 4
Schools having pass percentage 90% or upto 95% 1 SARVODAYA CO-ED S S S NAJAFGARH N DELHI 1822002 78 74 94. 9 2 SARVODAYA GIRLS SSS PRASHANT VIHAR DELHI 1413067 109 103 94. 5 3 GOVT SARVODAYA KANYA VIDYALAYA PUL BANGASH DELHI 1208025 16 15 93. 8 4 RAJKIYA PRATIBHA VIKAS VIDYALAYA HARI NAGAR ND 1514023 62 58 93. 5 5. GOVT GIRLS SR SEC SCH KHAIRA NEW DELHI 1822056 72 67 93. 1 6. SARVODAYA G SSS HARI NGR CLOCK TOWER ND 1514021 43 40 93. 0 7. S B K V SARVODAYA VIDYALAYA CIVIL LINES DELHI 1207113 215 199 92. 6 8. SARVODAYA KANYA VIDYALAYA NO 2 MEHRAULI NEW DELHI 1923038 61 56 91. 8 9. GOVT BOYS SR SEC SCHOOL NO 1 ROOP NAGAR DELHI 1207017 134 123 91. 8 10. GOVT GIRLS SR SEC SCHOOL 1 SHAKTI NAGAR DELHI 1207037 169 155 91. 7 11. SARVODAYA GIRLS SR SEC SCH SAMALKA NEW DELHI 1821022 70 64 91. 4 12. GOVT BOYS SR SEC SCH D BLK ASHOK VIHAR DELHI 1411014 45 41 91. 1 13. SARVODAYA GIRLS SR SEC SCH A-BLK VIKAS PURI N D 1618062 145 132 91. 0 14. SARVODAYA GIRLS SR SEC SCH ALIPUR DELHI 1310031 98 89 90. 8 15. SARVODAYA BOYS SR SEC SCHOOL MANDAWALI DELHI 1002001 76 69 90. 8 16. GOVT GIRLS SEC SCHOOL SECTOR-1 ROHINI DELHI 1413069 140 127 90. 7 17. GOVT CO EDU SEC SCHOOL BHORGARH DELHI 1310022 43 39 90. 7 18. SARVODAYA BOYS SSS NO-1 SAROJINI NGR ND 1719002 96 87 90. 6 19. GOVT BOYS SEC SCH AVANTIKA SECT-I ROHINI DLI 1413019 64 58 90. 6 20. V S SARVODAYA GIRLS S NO 1 KALKAJI N DELHI 1925029 149 135 90. 6 21. SARVODAYA COED SSS SECT-III ROHINI DELHI 1413002 201 182 90. 5 22. SARVODAYA GIRLS SSS KANJHAWALA DELHI 1413025 101 91 90. 1 23. SARVODAYA CO-ED SR SEC SCH SECT-7 ROHINI DLI 1413074 141 127 90. 1 24. GOVT GIRLS SEC SCH GHUMANHERA N DELHI 1822051 30 27 90. 0 25. GOVT BOYS SR SEC SCHOOL DHANSA NEW DELHI 1822014 10 9 90. 0
District wise number of schools, whose pass percentage is 90% or more than 90% North 8 60 13. 3 North West-B 13 106 12. 3 South West-B 6 71 8. 5 South West-A 3 44 6. 8 West-B 3 65 4. 6 West-A 3 67 4. 5 North West-A 3 79 3. 8 South 4 131 3. 1 East 3 100 3 Central 1 39 2. 6 North East New Delhi 2 0 92 5 2. 2 0. 0
Number of children passed in Class-X • 2005 = 41056 • 2006 = 57667 Increase over 2005 = 16611
Effect of the increased number of passed students i. e. 16611 Increase of 16611 in number of passing candidates from Class-X may mean a substantial increase in the posts of PGTs and thereby promotion opportunities.
• Performance of Co-Ed Schools is significantly better than that of Girls Schools. • Performance of Girls Schools is significantly better than that of Boys Schools.
CBSE Result 2006 - GOVT. SCHOOLS Boys Schools/Girls Schools/Co-Ed Schools Class X Boys Schools Appeared Passed 36334 19465 Pass % 53. 6 Total Marks Q. I 7873378 216. 7 Total Marks Q. I 10038418 236. 5 Total Marks Q. I 4383872 246. 7 Girls Schools Appeared Passed 42445 26195 Pass % 61. 7 Co-Ed Schools Appeared Passed 17772 12007 Pass % 67. 6
The performance of Schools having children between 1000 -1500 is the best.
Pass % based on enrolment in Govt. schools Appeared Passed PP Total_Marks QI <=300 1051 631 60. 0 252602 240. 3 >300 & <=600 5348 2977 55. 5 1195061 223. 1 >600 & <=1000 17618 10436 59. 2 4062284 230. 6 >1000 & <=1500 26960 16964 62. 9 6365216 236. 1 >1500 41369 24652 59. 6 9535291 230. 5 Enrolment
• Single shifted schools performed significantly better than double shifted schools. • In double shifted schools, the Morning Shift performed significantly better than the Evening shift schools.
CBSE RESULT SHIFT WISE Appeared 30407 Appeared 60924 Class X Single Shift Schools Passed Pass % Total Marks Q. I 7352105 241. 8 Double Shift Schools Passed Pass % Total Marks Q. I 19761 35200 65. 0 57. 8 13815816 226. 8
CBSE Result comparison between Morning Shift Schools and Evening Shift Schools of Double shifted schools Morning Shift Schools Appeared Passed 64325 40405 Pass % 62. 8 Total Marks 15308751 Q. I 238. 0 Evening Shift Schools Appeared 30972 Passed 16572 Pass % 53. 5 Total Marks 6711375 Q. I 216. 7
Merged Schools Appeared Passed PP% Before merger 2005 589 163 27. 65 After Merger 2006 479 244 50. 94
Adopted Schools Result Appeared Passed PP% Before Adoption - 2005 5988 1008 16. 83 After Adoption 2006 5265 2036 38. 67
Top 10 Adopted Schools – Class X Sl. No Name of the School 1 GOVT BOYS SR SEC SCH PHASE II ASHOK VIHAR DL 2 2006 increa se in PP Name of the adopted officer pass PP% App 33 29 87. 9 114 20 17. 5 70. 33 Sh. B. L. Yadav, DDE(Plg. ) GOVT BOYS SEC SCHOOL GARHI JHARIA MARIA ND 42 32 76. 2 30 5 16. 7 59. 52 Mrs. Mandakini Thakur, JDE(Admn. ) 3 GOVT BOYS SEC SCH R BLK MANGOL PURI DELHI 45 33 73. 3 47 9 19. 2 54. 18 Smt. Satinder Kaur, DDE(Insp. ) 4 GOVT BOYS SR SEC SCH NEW ROHTAK ROAD N DELHI 25 18 72 27 5 18. 5 53. 48 Shri P. V. Barapatre, DDE(Insp. ) 5 SARVODAYA G SS(J J CAMP) NARAINA N DELHI 45 32 71. 1 51 9 17. 7 53. 46 Sh. Ashutosh Kumar, JDE(Fin. ) 6 7 8 9 10 GOVT BOYS SEC SCH C BLK SANGAM VIHAR NEW DELHI App 2005 111 73 65. 8 219 Pass PP% 42 19. 2 46. 59 Sh. B. Srivastava, DDE(Science) Sh. S. A. Ali, DDE(Patrachar) GOVT GIRLS SR SEC SCH NICHOLSON ROAD DELHI 30 16 53. 3 43 3 6. 98 46. 36 GOVT GIRLS SS NO-1 SECT V DR. AMBEDKAR NGR ND 76 40 52. 6 117 9 7. 69 44. 94 GOVT CO-EDU. SEC. SCHOOL JAGATPUR DELHI GOVT BOYS SR SEC SCHOOL KATEWARA DELHI 69 51 37 25 53. 6 49 57 64 6 5 10. 5 7. 81 Sh. S. N. Misra, JDE(Act) 43. 1 Sh. O. P. Arora, Ade(Textbook) 41. 21 Sh. S. A. Ali, DDE(Patrachar)
Subject wise Pass % of Class-X(Govt. Vs Public) SUBJEC T GOVT. App Pass Public PP% QI APP Pass PP% QI Diff in PP Diff in QI Maths 95990 60669 63. 2 37. 4 58866 52570 89. 3 63. 4 -26. 1 -26. 0 Social Science 96393 91074 94. 5 54. 9 59026 57876 98. 1 70. 2 -3. 6 -15. 2 Science 96408 87794 91. 1 47. 7 58995 57186 96. 9 69. 2 -5. 9 -21. 4 English 95130 71174 74. 8 40. 2 14820 13468 90. 9 55. 3 -16. 1 -15. 1 Hindi 95416 83160 87. 2 46. 7 26732 25338 94. 8 57. 9 -7. 6 -11. 2 Sanskrit 89023 82380 92. 5 47. 9 18577 17977 96. 8 68. 4 -4. 2 -20. 5 Punjabi 2682 2474 92. 2 49. 9 2562 2429 94. 8 55. 5 -2. 6 -5. 6 Urdu 1440 1315 91. 3 55. 3 59 59 100. 0 84. 1 -8. 7 -28. 9
GOVERNMENT Vs. PUBLIC SCHOOLS - Class-X 2006 SUBJECT Diff in PP 2005 Diff in PP 2006 Diff in QI 2005 Diff in QI -26 -35 -26. 0 -29. 7 SOCIAL SCIENCE -4 -15. 2 -21. 8 Science -6 -11 -21. 4 -24. 6 English -16 -24 -15. 1 -18. 4 Hindi -8 -10 -11. 2 -11. 6 Sanskrit -4 -7 -20. 5 -21. 7 Punjabi -3 -1 -5. 6 -2. 9 MATHEMATICS
Subject 2006 2005 MATHS 35. 45 26. 10 SOCIAL SCIENCE 13. 71 3. 57 SCIENCE & TECH. 11. 17 5. 87 ENGLISH 23. 94 16. 06 HINDI 9. 97 7. 63 SANSKRIT 6. 87 4. 23
SUBJECT 2006 2005 MATHEMATICS 26 30 SOCIAL SCIENCE 15 22 Science 21 25 English 15 18 Hindi 11 12 Sanskrit 21 22
ZONE WISE – SUBJECT WISE PASS PERCENTAGE Maths Zo ne Science Social Science English Hindi Sanskrit App Pass PP% App Pass PP% 1 2436 1826 75. 0 2444 2334 95. 5 2443 2395 98. 0 2429 2035 83. 8 2436 2208 90. 6 2411 2345 97. 3 2 6452 4424 68. 6 6472 6027 93. 1 6472 6259 96. 7 6443 4966 77. 1 6444 5759 89. 4 6354 6036 95. 0 3 2795 1680 60. 1 2803 2540 90. 6 2802 2643 94. 3 2793 2203 78. 9 2795 2386 85. 4 2496 2294 91. 9 4 8511 4185 49. 2 8553 7561 88. 4 8538 7789 91. 2 8504 5225 61. 4 8500 6769 79. 6 8011 6913 86. 3 5 3506 1714 48. 9 3527 3091 87. 6 3523 3199 90. 8 3506 2221 63. 3 3471 2850 82. 1 2798 2515 89. 9 6 5610 2882 51. 4 5634 5050 89. 6 5629 5168 91. 8 5589 3704 66. 3 5610 4583 81. 7 5482 4759 86. 8 7 3907 2729 69. 8 3923 3682 93. 9 3924 3797 96. 8 3895 3168 81. 3 3841 3455 90. 0 3669 3504 95. 5 8 1062 590 55. 6 1066 939 88. 1 1076 1022 95. 0 1070 811 75. 8 975 816 83. 7 843 783 92. 9 9 3338 2144 64. 2 3349 3122 93. 2 3349 3244 96. 9 3233 2480 76. 7 3334 2936 88. 1 3124 2914 93. 3 10 5509 3140 57. 0 5531 4913 88. 8 5526 5145 93. 1 5311 3625 68. 3 5508 4687 85. 1 5432 4998 92. 0 11 3149 2218 70. 4 3157 2903 92. 0 3162 3034 96. 0 3108 2552 82. 1 3137 2879 91. 8 2358 2191 92. 9 12 4070 2681 65. 9 4092 3717 90. 8 4089 3908 95. 6 4039 2866 71. 0 4067 3689 90. 7 3857 3521 91. 3 13 3056 2577 84. 3 3059 2974 97. 2 3064 3012 98. 3 2924 2569 87. 9 3056 2969 97. 2 2991 2937 98. 2 14 2187 1446 66. 1 2206 2060 93. 4 2208 2109 95. 5 2185 1830 83. 8 2184 1999 91. 5 1373 1297 94. 5
15 2091 1508 72. 1 2100 1960 93. 3 2103 1997 95. 0 2046 1731 84. 6 2088 1935 92. 7 1671 1560 93. 4 16 1830 1068 58. 4 1838 1497 81. 4 1837 1680 91. 5 1784 1241 69. 6 1828 1561 85. 4 1499 1286 85. 8 17 3616 2463 68. 1 3629 3352 92. 4 3636 3470 95. 4 3615 3177 87. 9 3615 3239 89. 6 3548 3380 95. 3 18 5419 3686 68. 0 5434 4901 90. 2 5433 5203 95. 8 5420 4482 82. 7 5419 4747 87. 6 5132 4666 90. 9 19 1919 1193 62. 2 1927 1834 95. 2 1924 1857 96. 5 1891 1564 82. 7 1894 1659 87. 6 1643 1507 91. 7 20 2149 1477 68. 7 2163 1964 90. 8 2157 2059 95. 5 2113 1648 78. 0 2150 1890 87. 9 2111 1991 94. 3 21 3992 2725 68. 3 3996 3779 94. 6 4001 3878 96. 9 3991 3187 79. 9 3993 3712 93. 0 3936 3790 96. 3 22 2879 2068 71. 8 2888 2823 97. 7 2892 2812 97. 2 2879 2116 73. 5 2881 2651 92. 0 2878 2696 93. 7 23 4959 3324 67. 0 4975 4468 89. 8 4981 4646 93. 3 4942 3661 74. 1 4960 4292 86. 5 4854 4604 94. 8 24 2241 1405 62. 7 2243 2032 90. 6 2246 2136 95. 1 2241 1773 79. 1 2242 1928 86. 0 2198 2115 96. 2 25 7461 4415 59. 2 7491 6565 87. 6 7507 6839 91. 1 7338 5064 69. 0 7381 6153 83. 4 6870 6356 92. 5 26 416 270 64. 9 416 384 92. 3 418 404 96. 7 415 325 78. 3 415 373 89. 9 406 402 99. 0 27 738 409 55. 4 798 685 85. 8 755 714 94. 6 732 472 64. 5 497 458 92. 2 391 369 94. 4 28 692 422 61. 0 694 637 91. 8 698 655 93. 8 694 478 68. 9 695 577 83. 0 687 651 94. 8
District Wise – Subject Wise Pass Percentage District Maths Science Social Science English App Pass PP% App East 11683 7930 67. 88 11719 10901 93. 02 11717 11297 96. 42 11665 North. East 17627 8781 49. 82 17714 15702 88. 64 17690 16156 91. 33 North 4969 3319 66. 79 4989 4621 92. 62 5000 4819 North West -A 8847 5284 59. 73 8880 8035 90. 48 8875 North West -B 10275 7476 72. 76 10308 9594 93. 07 West-A 6108 4022 65. 85 6144 5517 West-B 9035 6149 68. 06 9063 South West-A 4068 2670 65. 63 South West-B 6871 4793 South 14661 New Delhi Central Pass Hindi PP% App Pass PP% 9204 78. 90 11675 10353 88. 68 17599 11150 63. 36 17581 14202 80. 78 96. 38 4965 3979 80. 14 4816 4271 88. 68 8389 94. 52 8544 6105 71. 45 8842 7623 86. 21 10315 9954 96. 50 10071 7987 79. 31 10260 9537 92. 95 89. 79 6148 5786 94. 11 6015 4802 79. 83 6100 5495 90. 08 8253 91. 06 9069 8673 95. 63 9035 7659 84. 77 9034 7986 88. 40 4090 3798 92. 86 4081 3916 95. 96 4004 3212 80. 22 4044 3549 87. 76 69. 76 6884 6602 95. 90 6893 6690 97. 05 6870 5303 77. 19 6874 6363 92. 57 9144 62. 37 14709 13065 88. 82 14734 13621 92. 45 14521 10498 72. 30 14583 12373 84. 85 416 270 64. 90 416 384 92. 31 418 404 96. 65 415 325 78. 31 415 373 89. 88 1430 831 58. 11 1492 1322 88. 61 1453 1369 94. 22 1426 950 66. 62 1192 1035 86. 83
Maths & English Pass Percentage - CBSE 2006 School Type Maths Pass % English Pass % Overall Pass % Sarvodaya Schools 66. 41 79. 01 63. 36 Non-Sarvodaya Schools 59. 90 70. 93 56. 02
District wise pass % target 2007 District Math Science SST English Hindi Sanskrit EAST 87. 92 95. 56 98. 67 83. 69 91. 73 96. 37 NORTH EAST 75. 21 93. 84 97. 09 69. 98 85. 41 90. 45 NORTH 86. 46 95. 31 98. 56 83. 77 91. 78 96. 23 NORTH WESTA 82. 88 93. 98 98. 07 77. 90 89. 38 94. 02 NORTH WESTB 89. 80 95. 34 98. 48 84. 59 95. 07 95. 46 WEST-A 86. 87 93. 47 97. 50 84. 19 92. 98 92. 91 WEST-B 87. 87 93. 67 98. 32 88. 52 91. 72 94. 63 SOUTH WESTA 87. 32 95. 16 98. 43 85. 51 90. 78 95. 34 SOUTH WESTB 88. 40 97. 39 98. 96 82. 45 94. 56 96. 71 SOUTH 84. 58 92. 78 97. 05 78. 29 88. 79 95. 37 NEW DELHI 86. 54 94. 71 98. 56 85. 78 93. 01 99. 51 CENTRAL 81. 40 92. 36 97. 45 72. 30 90. 52 95. 92
district wise QI Target 2007 District Math Science SST English Hindi Sanskrit EAST 53. 06 54. 52 63. 07 47. 33 53. 44 55. 54 NORTH EAST 46. 00 50. 76 56. 74 41. 28 48. 75 49. 83 NORTH 53. 47 56. 79 64. 38 49. 81 53. 47 56. 32 NORTH WESTA 49. 36 52. 67 59. 07 43. 08 51. 75 55. 72 NORTH WESTB 55. 04 55. 03 63. 51 47. 18 56. 27 55. 61 WEST-A 51. 91 51. 78 59. 49 47. 75 54. 34 52. 38 WEST-B 53. 42 52. 57 59. 93 49. 33 52. 37 52. 72 SOUTH WESTA 52. 03 54. 40 61. 49 46. 76 52. 04 53. 09 SOUTH WESTB 53. 32 56. 89 62. 36 46. 23 55. 30 54. 29 SOUTH 49. 92 50. 18 57. 72 43. 74 49. 58 54. 25 NEW DELHI 51. 06 52. 37 61. 20 45. 63 50. 15 57. 50 CENTRAL 47. 62 50. 27 59. 36 40. 70 50. 34 55. 89
Zone wise Pass % Target 2007 Zone Math Science SST English Hindi Sanskrit 1 91. 42 96. 97 99. 22 86. 83 93. 14 98. 47 2 88. 34 95. 63 98. 69 82. 52 92. 26 96. 41 3 83. 90 94. 18 98. 14 83. 64 89. 27 94. 23 4 75. 38 93. 45 97. 20 68. 65 84. 36 90. 14 5 71. 71 92. 91 96. 62 69. 05 86. 55 92. 10 6 77. 13 94. 99 97. 21 72. 57 86. 29 90. 06 7 88. 00 96. 15 98. 78 84. 80 92. 48 96. 54 8 80. 79 92. 21 97. 77 80. 00 89. 03 94. 90 9 86. 76 95. 82 99. 01 82. 59 91. 06 94. 81 10 80. 52 92. 86 97. 50 75. 05 88. 36 93. 56 11 88. 63 94. 65 98. 32 86. 74 94. 17 94. 32 12 86. 44 93. 82 97. 99 78. 06 93. 31 93. 57 13 95. 48 98. 10 99. 28 91. 31 98. 33 98. 80 14 88. 93 96. 06 98. 01 87. 60 94. 18 95. 48
Zone wise Pass % Target 2007 Zone Math Science SST English Hindi Sanskrit 15 90. 67 95. 86 97. 81 88. 32 94. 92 95. 21 16 80. 05 87. 65 96. 52 75. 28 89. 33 87. 99 17 87. 75 94. 65 97. 96 90. 71 92. 86 96. 42 18 87. 95 93. 01 98. 56 87. 07 90. 96 93. 39 19 85. 83 96. 94 98. 86 88. 05 90. 81 94. 58 20 88. 65 93. 57 98. 05 83. 25 90. 74 95. 93 21 87. 88 96. 42 98. 93 84. 67 94. 87 97. 54 22 89. 13 98. 72 99. 00 79. 37 94. 13 95. 59 23 87. 38 93. 47 97. 31 80. 07 89. 88 96. 54 24 85. 72 93. 67 98. 31 83. 85 90. 05 97. 22 25 82. 39 92. 06 96. 51 75. 40 87. 67 93. 96 26 86. 54 94. 71 98. 56 85. 78 93. 01 99. 51 27 77. 51 89. 97 96. 95 70. 77 94. 77 95. 40 28 85. 55 95. 10 97. 99 73. 92 87. 48 96. 22
Zone wise QI Target 2007 zone Math Science SST English Hindi Sanskrit 1 57. 32 59. 77 66. 27 51. 46 55. 37 58. 54 2 52. 29 53. 02 62. 73 45. 29 53. 36 55. 02 3 51. 13 53. 43 61. 05 48. 44 51. 93 53. 99 4 45. 89 50. 70 56. 18 40. 76 48. 24 49. 43 5 45. 69 50. 66 56. 64 41. 73 49. 53 51. 79 6 46. 36 50. 90 57. 67 41. 79 49. 02 49. 40 7 55. 14 58. 38 65. 54 51. 14 54. 01 56. 92 8 47. 35 50. 95 60. 14 44. 97 51. 32 53. 67 9 51. 13 54. 30 61. 68 44. 88 52. 21 55. 00 10 48. 29 51. 69 57. 49 41. 98 51. 48 56. 13 11 54. 27 54. 55 62. 73 49. 05 55. 63 54. 71 12 51. 03 51. 56 62. 65 42. 71 54. 02 52. 33 13 61. 17 60. 17 65. 44 51. 36 59. 90 60. 55 14 52. 67 53. 39 59. 89 49. 41 55. 13 54. 89
Zone wise QI Target 2007 zone Math Science SST English Hindi Sanskrit 15 54. 18 53. 81 60. 88 49. 78 55. 88 53. 13 16 48. 39 47. 52 57. 42 43. 38 51. 62 49. 24 17 53. 62 53. 41 60. 59 51. 13 53. 98 54. 89 18 53. 29 52. 02 59. 48 48. 12 51. 30 51. 21 19 50. 23 56. 90 61. 88 47. 93 50. 78 51. 17 20 53. 63 52. 17 61. 15 45. 70 53. 15 54. 59 21 52. 54 53. 66 61. 87 47. 06 55. 64 55. 28 22 54. 40 61. 35 63. 03 45. 08 54. 83 52. 93 23 51. 36 50. 73 59. 09 43. 90 50. 48 55. 66 24 50. 19 51. 02 59. 48 46. 98 49. 75 56. 36 25 48. 88 49. 57 56. 28 42. 64 48. 92 52. 58 26 51. 06 52. 37 61. 20 45. 63 50. 15 57. 50 27 46. 08 48. 05 59. 69 40. 35 51. 97 55. 19 28 49. 26 52. 82 58. 99 41. 07 49. 18 56. 29
School wise Target for 2007 schid Name of the School M_PP Sc_PP SS_PP En_PP Hn_PP Skt_PP 1001001 B R SARVODAYA BOYS S SHAHDARA DLI 72. 86 98. 57 87. 14 98. 57 92. 86 1001002 SARVODAYA BOYS S VIVEK VIHAR DLI 92. 53 98. 36 98. 77 97. 51 97. 10 99. 17 1001004 SARVODAYA BOYS S KANTI NAGAR DELHI 85. 19 100. 00 98. 77 96. 30 83. 95 92. 59 1001006 SARVODAYA BOYS S SEC SCH SURAJMAL VIHAR DELHI 93. 84 100. 00 95. 89 100. 00 98. 63 1001008 SARVODAYA BOYS SS NO 1 B. N. NGR DELHI 66. 30 91. 30 94. 57 73. 91 81. 52 98. 91 1001009 GOVT SARVODAYA COED SR SEC SCH ANAND VIHAR DELHI 88. 30 94. 74 99. 42 85. 96 93. 57 95. 32 1001010 GOVT BOYS SR SEC SCH NO 3 B. N. NGR SHAHDARA DLI 72. 92 83. 84 98. 96 62. 50 68. 75 89. 58 1001011 G SARVODAYA BAL VIDYALAYA VISHWAS NGR SHAHDARA 87. 04 81. 48 89. 09 61. 11 83. 33 90. 74 1001012 GOVT BOYS SEC SCHOOL CBLK VIVEK VIHAR DELHI 65. 45 96. 43 98. 21 72. 73 83. 64 100. 00
Strong & Weak Subjects in a particular school Schname Rank Math Scien ce SSt Eng Hindi Skt 4 0 -2 -15 -11 2 0 GOVT BOYS SR SEC SCH 1 SHAKTI NAGAR DELHI 13 -4 2 3 1 -55 -10 SARVODAYA GIRLS SSS SECTVIII ROHINI DLI 16 0 -5 -29 -131 -9 -4 R. P. V. V. PLOT 1 LINK RD KAROL BAGH N D 17 5 5 -8 -43 -1 -11 RAJKIYA PRATIBHA VIKAS VIDYALAYA HARI NAGAR ND 18 -4 -5 2 5 -11 GOVT GIRLS SR SEC SCHOOL 1 SHAKTI NAGAR DELHI 20 -14 0 -1 3 -56 -14 SARVODAYA GIRLS SS O-BLK MANGOLPURI DELHI 22 8 -71 -22 0 5 5 GOVT GIRLS SEC SCH GHUMANHERA N DELHI 23 -2 8 -107 -138 -71 -13 SCSD SARVODYA CO-ED S SECTOR-9 ROHINI DELHI 24 4 -11 -149 -1 -17 -26 GOVT. CO-EDU. SEC SCH SECTOR 15 ROHINI DELHI 25 4 0 -76 -79 4 -63 PRATIBHA VIKAS VIDYALAYA SEC XI ROHINI DELHI
THANKS