PARAMETER SENSITIVITY ANALYSIS OF PHOTON RECYCLING IN GALIUM


 regression does not depend on the invertability of input data.")


 can give us the following information: (1) Significance of independent")


: function map KEY GPR (x) = 2π ∫d E ∫")
: function dependency chart GPR E α Φ RF μ RF")
: code sample")


- Slides: 51
PARAMETER SENSITIVITY ANALYSIS OF PHOTON RECYCLING IN GALIUM ARSENIDE SOLAR CELLS: METHODOLOGICAL DEVELOPMENT GRACE CAREY, ILYA KORSUNSKY, ARJUNEN KUTAYIAH, KATHLEEN MCGOVERN, LAUREN SWADDELL
Outline • • Motivation: Environmental Impact Solar Cells: Behind the Physics Modeling and Optimization Sensitivity Analysis (PLS regression) Implementation Results Design Conclusions Future Directions
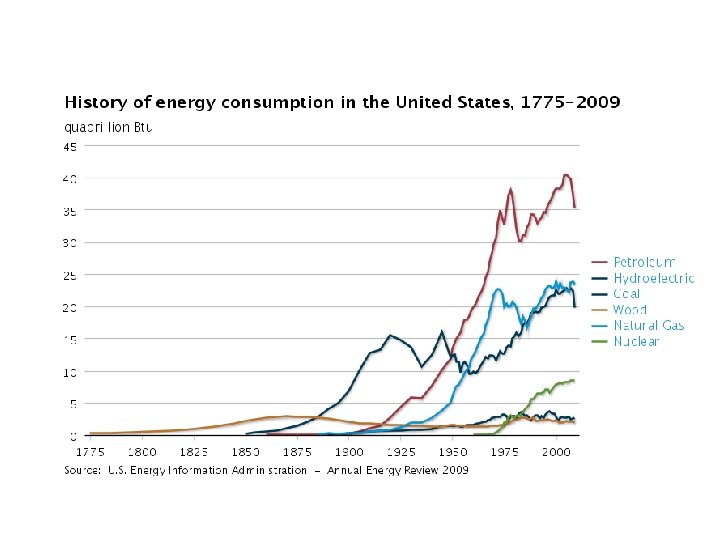
U. S. Energy Consumption and Production predictions Source: U. S. Energy Information Administration, Annual Energy Outlook 2011, Early Release, December 16, 2011.
U. S. energy consumption in 2009
U. S. Primary Energy Flow
Source: U. S. Department of Energy, Department of Fossil Fuels, 2011
Carbon Dioxide Emissions
Ice Core Data and The Keeling Curve
Vostok Ice-Core Data
Alternatives to fossil fuels? The suspense is terrible… I hope it’ll last
Nuclear Energy • • 400 nuclear plants in the world 100 nuclear plants in the US alone Powers ~15% of US energy needs Relies on the use of uranium and other fissible materials to generate electricity • • Uranium is a finite mineral resource Cooling methods often employ the use of local water systems endangering aquatic life Nuclear power plants in the US produce 2000 metric tons of radioactive waste Nuclear disasters can emit large amounts of radiation which can be lethal and detrimental to the environment • •
Solar Energy • • Sustainable and renewable resource which does not emit greenhouse gases ~1% of U. S. energy Solar energy hitting the earth is approximately 274 million gigawatt/year = 8. 2 million quads of Btu/year Solar cells currently have an average efficiency of 15% 369 thousand quads of Btu/year can be collected if all land mass of earth had solar panels Total potential for solar energy is 444, 000 TWh The world’s total energy consumption is 132, 000 TWh The total annual energy consumption in the US is less than 0. 5% theoretical amount of sunlight received
Solar Cell Efficiency Tables
Solar Cell Efficiency Tables
Solar Cell Efficiency Tables
Solar Cell Efficiency Tables
Outline • • Motivation: Environmental Impact Solar Cells: Behind the Physics Modeling and Optimization Sensitivity Analysis (PLS regression) Implementation Results Design Conclusions Future Directions
N type Contacts P type N type Electric field Space Charged Region Photon P type N type P type
Radiative Recombination Conducing Band, Ec Band Gap, Eg = Ec - Ev Valence Band, Ev
Photon Recycling • Re-absorption of photons generated in a semiconductor device as a product of radiative recombinations. • Increases efficiency by 1 -2% Ga. As • Semiconductor • Direct Band Gap • No energy is lost to phonons (lattice vibrations) as a result of radiative recombinations. • Good for optical devices
Outline • • Motivation: Environmental Impact Solar Cells: Behind the Physics Modeling and Optimization Sensitivity Analysis (PLS regression) Implementation Results Design Conclusions Future Directions
Modeling: Motivation • Goal: create the best solar cell we can! – Efficacy – Cost – Environmental Impact • Need some design guidelines • Computational model handles complexity
The Model
The Model • Output: Photon Recycling Rate • Inputs: – – – – – Temperature Front Surface Reflection Width Angle of Incidence Refractive index Light Wavelength Internal Surface Reflectance of Metal Grid Front Internal Shadow Factor
How do we use the model? • Optimize Photon Recycling over the input parameters
Dealing with Complexity • 9 input parameters => 9 dimensional hypercube • Are all the parameters important? • Sensitivity analysis gives importance of each parameter • Cut down search space
Outline • • Motivation: Environmental Impact Solar Cells: Behind the Physics Modeling and Optimization Sensitivity Analysis (PLS regression) Implementation Results Design Conclusions Future Directions
The simplest and most powerful relationship between independent and dependent variables is linear. The dependent variable can be predicted from the independent variable by fitting the data to as follows:
The problem is almost always more complicated. If the dependent variable is a function of multiple independent variables, we have: This describes multilinear dependencies for only one sample; for n samples y can be written as a column vector and the values of x form the rows of matrix X:
In multiple linear regression, the solution for the b vector take the form: Can anyone see a potential problem here? The formula for b depends on the invertability of the product matrix of the X row vector and the X matrix!
Partial least squares (PLS) regression does not depend on the invertability of input data. Assume a linear relationship between independent parameter matrix X and dependent output matrix Y: PLS regression uses a variation of the NIPALS algorithm to find the best approximation of this linear relationship in the form of regression matrix, B.
What does the PLS algorithm look like?
The Model
The previous complexity can be reduced to the following:
The regression coefficients (Bpls) can give us the following information: (1) Significance of independent parameters to output(s) of interest (2) Prediction of dependent parameters from independent parameters (unlike PCA) (3) Indication of parameters to be tested in future experiments (4) Unreasonable results indicate that a mathematical model needs to be reevaluated in some regard
Outline • • Motivation: Environmental Impact Solar Cells: Behind the Physics Modeling and Optimization Sensitivity Analysis (PLS regression) Implementation Results Design Conclusions Future Directions
The Model
Photon recycling rate (GPR): function map KEY GPR (x) = 2π ∫d E ∫ dμ α b(E, x, μ) = { 2αw Φ= exp μ ΨOF = RR ΨOR = RF ∫ ∫ α + μ exp α - μ exp - R F RR αx' bn exp μ ( α x' bn exp μ ( ∞ 1 EG -1 ( -αx μ b(E, x, μ) )x [ RF Φ ΨOF + )x [ RR Φ ΨOR + bn(E, x) = )dx’ + exp( 2 h 3 c 2 2αw μ )dx’ +∫ b exp( n Experimental variables Constants Functions ∞ ∫b 0 n exp w ∫b x n exp ( α x' μ )dx’ ] if 1 ≤ μ < 0 ( α x' μ ) dx’ ] if 0 > μ ≥ -1 ˆn 2 E -qφ(x) ( k. T ) - 1 )∫ b exp( n - α x’ μ ) dx’ α= - α x’ μ ) dx’ 4 log(10) π κ λ μ = cosθ E= h*c λ RF = κF * FSF + ρF * (1 – FSF)
Photon recycling rate (GPR): function dependency chart GPR E α Φ RF μ RF b μ bn E α μ α ΨOF ΨOR RF bn bn E E
Photon recycling rate (GPR): code sample
Outline • • Motivation: Environmental Impact Solar Cells: Behind the Physics Modeling and Optimization Sensitivity Analysis (PLS regression) Implementation Results Design Conclusions Future Directions
We can apply the PLS algorithm to our input and output data. Input Trials Output 1. 5 0 Parameters T ha t n q W SF F r F k l k -1. 5 GPR
Results of PLS regression: BPLS Input Matrix Output k 1. 5 l k. F *F r = SF 0 W q nhat -1. 5 T ha t n q W SF F r F k l k T GPR
Results of PLS Regression: GPR Regression Coefficients 1 These give quantitative insight into how changing input parameters affects output. 0. 5 0 Significant parameters include wavelength of light, temperature, and the front reflectance. -0. 5 T ha t n q W SF F r F k l k -1
Accuracy of regression
Conclusions: 1. PLS regression is an accurate tool for both determining parameter sensitivities from our simulated data sets and predicting the output variable data of interest. 2. As conserving energy is of optimal interest to the environment, photon recycling is an important physical phenomenon to energy conservation and solar cell efficiency. 3. From our regression analysis, the parameters which should be maximized in future cell design are wavelength of light directed at the solar cell, temperature, and front reflectance.
Future Directions • Function for cost • Function for environmental impact • Convex optimization
Questions • Any? • No? • Thanks!
Acknowledgements • • The Catalyst Scholarship Program! Dr. Haydee Salmun All of our wonderful advisors Dr. Eric Sobie and Amrita Sarkar