Parallel Computing Explained Timing and Profiling Slides Prepared
![Profile Listings on the Linux Clusters gprof Output Second Listing Call graph: index ----[1] Profile Listings on the Linux Clusters gprof Output Second Listing Call graph: index ----[1]](https://slidetodoc.com/presentation_image/26e544a1739d0f322217832eb4542b27/image-25.jpg)
- Slides: 39

Parallel Computing Explained Timing and Profiling Slides Prepared from the CI-Tutor Courses at NCSA http: //ci-tutor. ncsa. uiuc. edu/ By S. Masoud Sadjadi School of Computing and Information Sciences Florida International University March 2009

Agenda 1 Parallel Computing Overview 2 How to Parallelize a Code 3 Porting Issues 4 Scalar Tuning 5 Parallel Code Tuning 6 Timing and Profiling 6. 1 Timing 6. 1. 1 Timing a Section of Code 6. 1. 1. 1 CPU Time 6. 1. 1. 2 Wall clock Time 6. 1. 2 Timing an Executable 6. 1. 3 Timing a Batch Job 6. 2 Profiling 6. 2. 1 Profiling Tools 6. 2. 2 Profile Listings 6. 2. 3 Profiling Analysis 6. 3 Further Information

Timing and Profiling Now that your program has been ported to the new computer, you will want to know how fast it runs. This chapter describes how to measure the speed of a program using various timing routines. The chapter also covers how to determine which parts of the program account for the bulk of the computational load so that you can concentrate your tuning efforts on those computationally intensive parts of the program. This chapter also gives a summary of some available profiling tools.

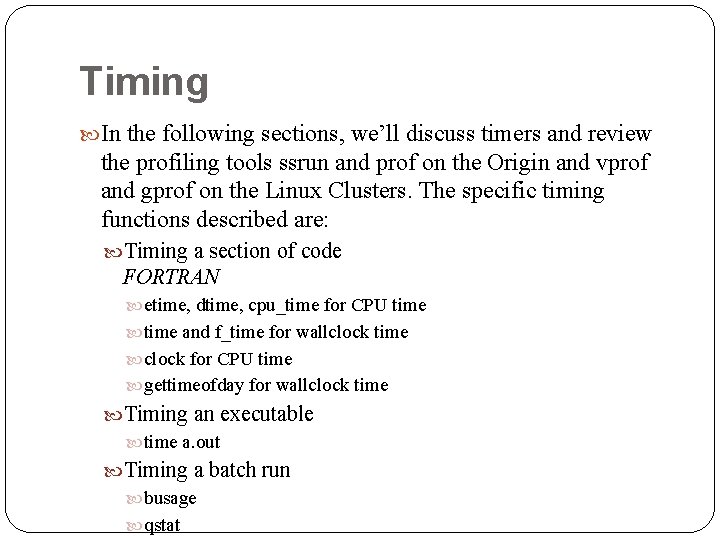
Timing In the following sections, we’ll discuss timers and review the profiling tools ssrun and prof on the Origin and vprof and gprof on the Linux Clusters. The specific timing functions described are: Timing a section of code FORTRAN etime, dtime, cpu_time for CPU time and f_time for wallclock time clock for CPU time gettimeofday for wallclock time Timing an executable time a. out Timing a batch run busage qstat

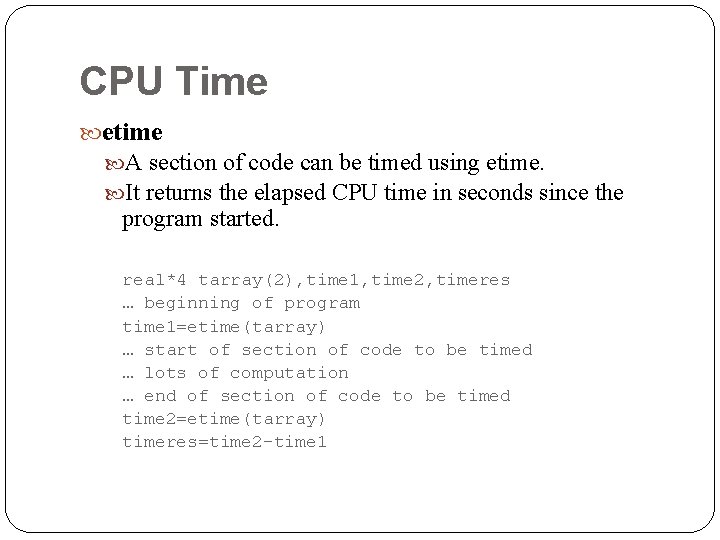
CPU Time etime A section of code can be timed using etime. It returns the elapsed CPU time in seconds since the program started. real*4 tarray(2), time 1, time 2, timeres … beginning of program time 1=etime(tarray) … start of section of code to be timed … lots of computation … end of section of code to be timed time 2=etime(tarray) timeres=time 2 -time 1

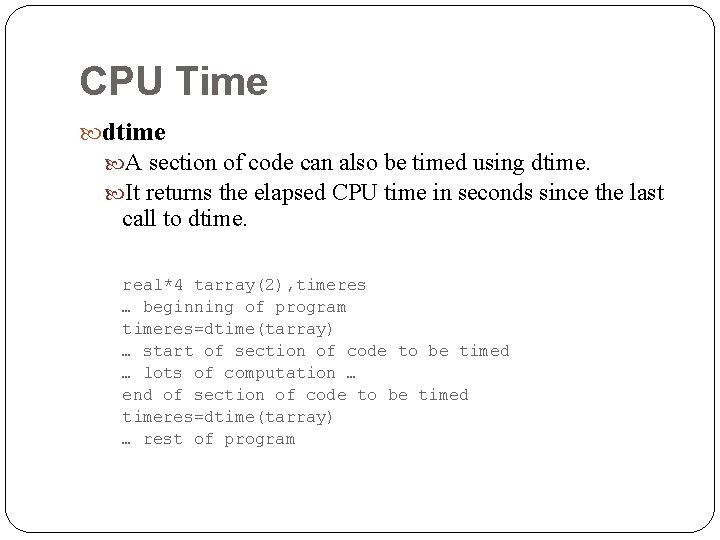
CPU Time dtime A section of code can also be timed using dtime. It returns the elapsed CPU time in seconds since the last call to dtime. real*4 tarray(2), timeres … beginning of program timeres=dtime(tarray) … start of section of code to be timed … lots of computation … end of section of code to be timed timeres=dtime(tarray) … rest of program

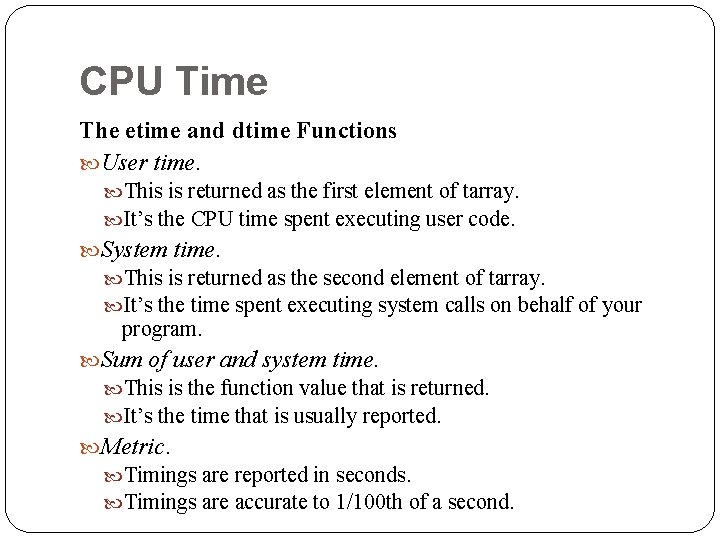
CPU Time The etime and dtime Functions User time. This is returned as the first element of tarray. It’s the CPU time spent executing user code. System time. This is returned as the second element of tarray. It’s the time spent executing system calls on behalf of your program. Sum of user and system time. This is the function value that is returned. It’s the time that is usually reported. Metric. Timings are reported in seconds. Timings are accurate to 1/100 th of a second.

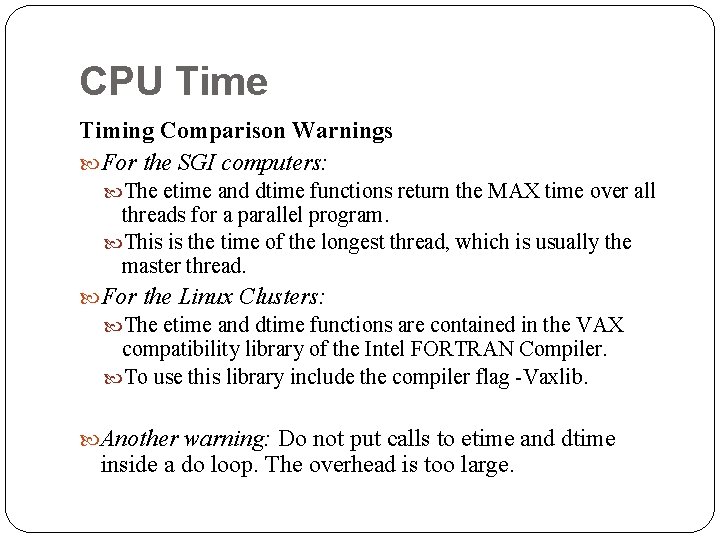
CPU Time Timing Comparison Warnings For the SGI computers: The etime and dtime functions return the MAX time over all threads for a parallel program. This is the time of the longest thread, which is usually the master thread. For the Linux Clusters: The etime and dtime functions are contained in the VAX compatibility library of the Intel FORTRAN Compiler. To use this library include the compiler flag -Vaxlib. Another warning: Do not put calls to etime and dtime inside a do loop. The overhead is too large.

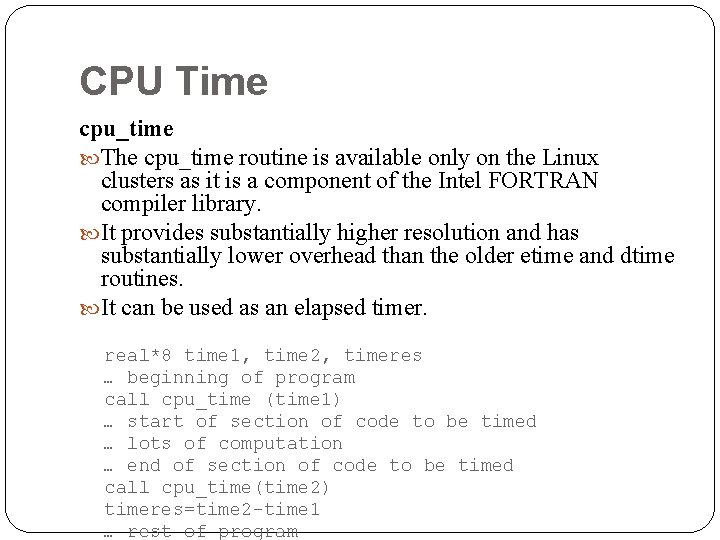
CPU Time cpu_time The cpu_time routine is available only on the Linux clusters as it is a component of the Intel FORTRAN compiler library. It provides substantially higher resolution and has substantially lower overhead than the older etime and dtime routines. It can be used as an elapsed timer. real*8 time 1, time 2, timeres … beginning of program call cpu_time (time 1) … start of section of code to be timed … lots of computation … end of section of code to be timed call cpu_time(time 2) timeres=time 2 -time 1 … rest of program

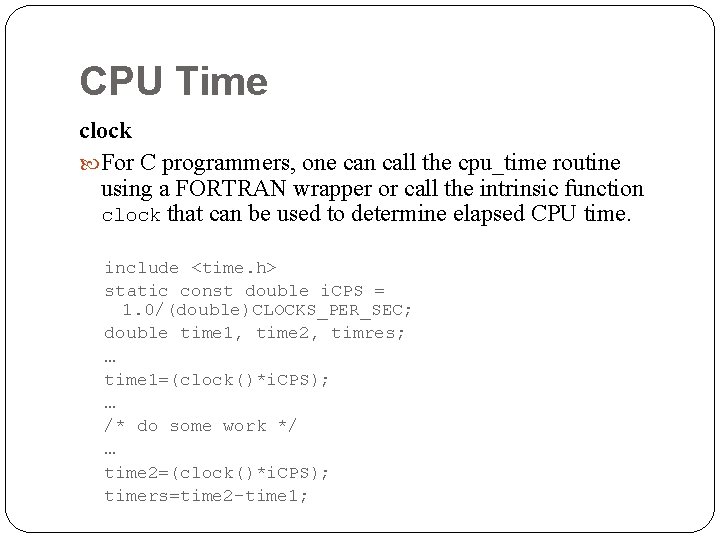
CPU Time clock For C programmers, one can call the cpu_time routine using a FORTRAN wrapper or call the intrinsic function clock that can be used to determine elapsed CPU time. include <time. h> static const double i. CPS = 1. 0/(double)CLOCKS_PER_SEC; double time 1, time 2, timres; … time 1=(clock()*i. CPS); … /* do some work */ … time 2=(clock()*i. CPS); timers=time 2 -time 1;

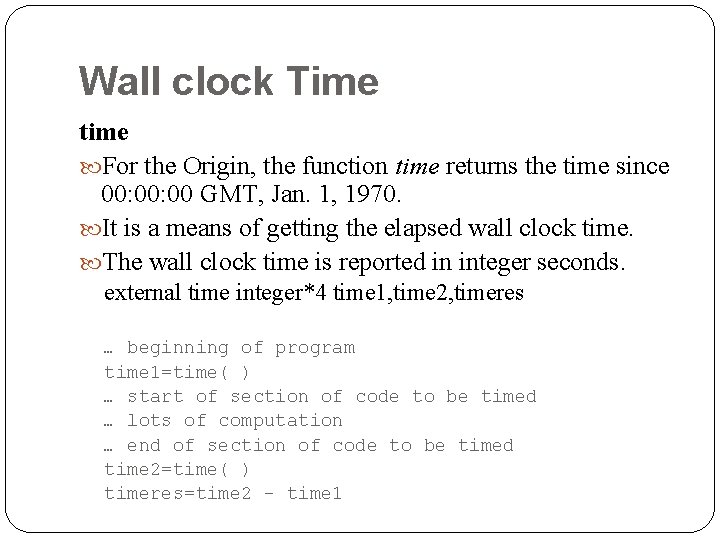
Wall clock Time time For the Origin, the function time returns the time since 00: 00 GMT, Jan. 1, 1970. It is a means of getting the elapsed wall clock time. The wall clock time is reported in integer seconds. external time integer*4 time 1, time 2, timeres … beginning of program time 1=time( ) … start of section of code to be timed … lots of computation … end of section of code to be timed time 2=time( ) timeres=time 2 - time 1

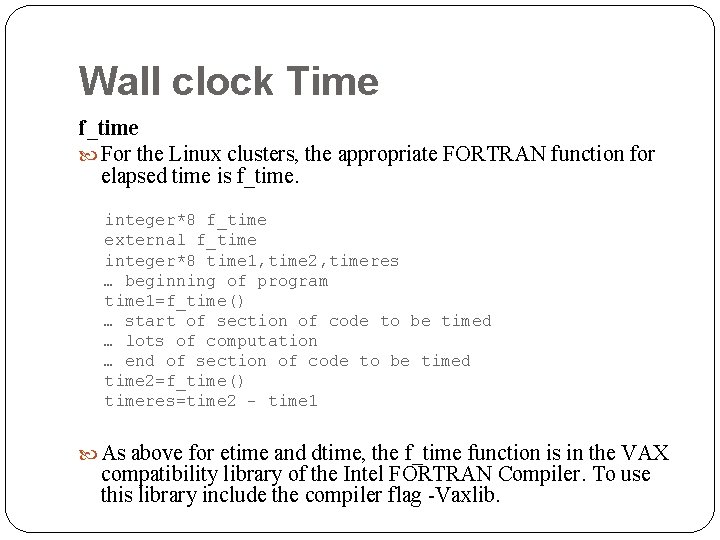
Wall clock Time f_time For the Linux clusters, the appropriate FORTRAN function for elapsed time is f_time. integer*8 f_time external f_time integer*8 time 1, time 2, timeres … beginning of program time 1=f_time() … start of section of code to be timed … lots of computation … end of section of code to be timed time 2=f_time() timeres=time 2 - time 1 As above for etime and dtime, the f_time function is in the VAX compatibility library of the Intel FORTRAN Compiler. To use this library include the compiler flag -Vaxlib.

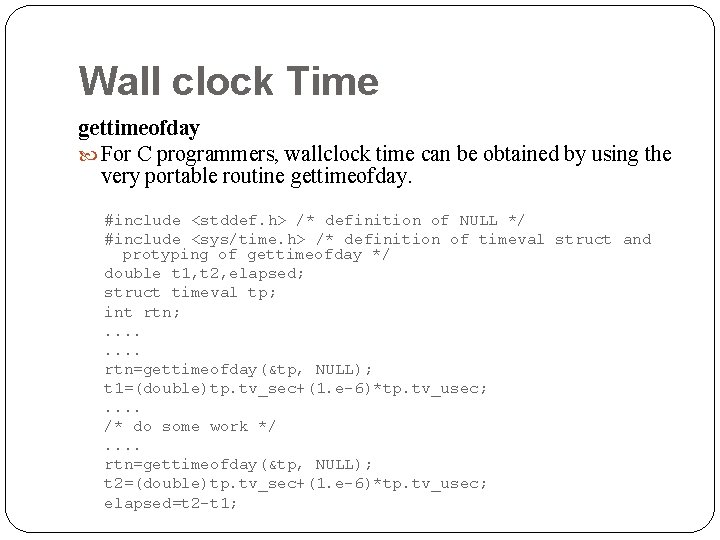
Wall clock Time gettimeofday For C programmers, wallclock time can be obtained by using the very portable routine gettimeofday. #include <stddef. h> /* definition of NULL */ #include <sys/time. h> /* definition of timeval struct and protyping of gettimeofday */ double t 1, t 2, elapsed; struct timeval tp; int rtn; . . . . rtn=gettimeofday(&tp, NULL); t 1=(double)tp. tv_sec+(1. e-6)*tp. tv_usec; . . /* do some work */. . rtn=gettimeofday(&tp, NULL); t 2=(double)tp. tv_sec+(1. e-6)*tp. tv_usec; elapsed=t 2 -t 1;

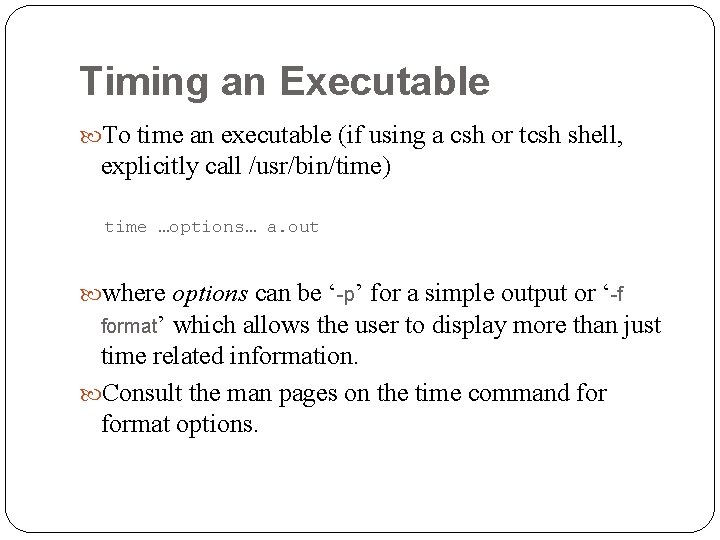
Timing an Executable To time an executable (if using a csh or tcsh shell, explicitly call /usr/bin/time) time …options… a. out where options can be ‘-p’ for a simple output or ‘-f format’ which allows the user to display more than just time related information. Consult the man pages on the time command format options.

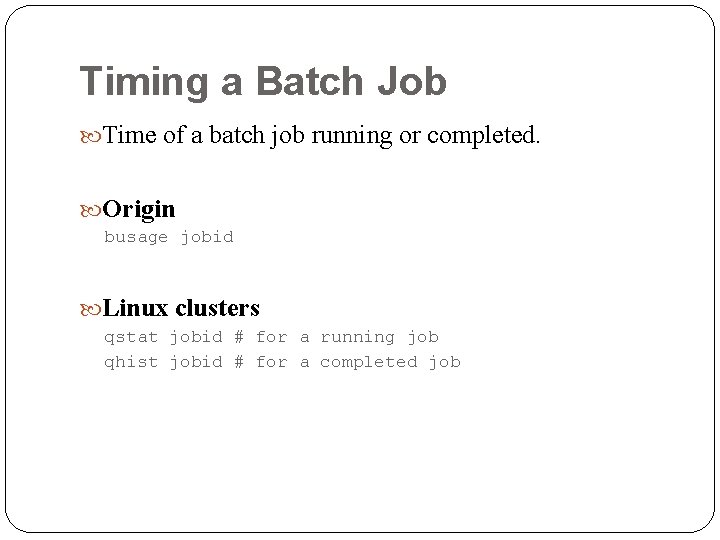
Timing a Batch Job Time of a batch job running or completed. Origin busage jobid Linux clusters qstat jobid # for a running job qhist jobid # for a completed job

Agenda 1 Parallel Computing Overview 2 How to Parallelize a Code 3 Porting Issues 4 Scalar Tuning 5 Parallel Code Tuning 6 Timing and Profiling 6. 1 Timing 6. 1. 1 Timing a Section of Code 6. 1. 1. 1 CPU Time 6. 1. 1. 2 Wall clock Time 6. 1. 2 Timing an Executable 6. 1. 3 Timing a Batch Job 6. 2 Profiling 6. 2. 1 Profiling Tools 6. 2. 2 Profile Listings 6. 2. 3 Profiling Analysis 6. 3 Further Information

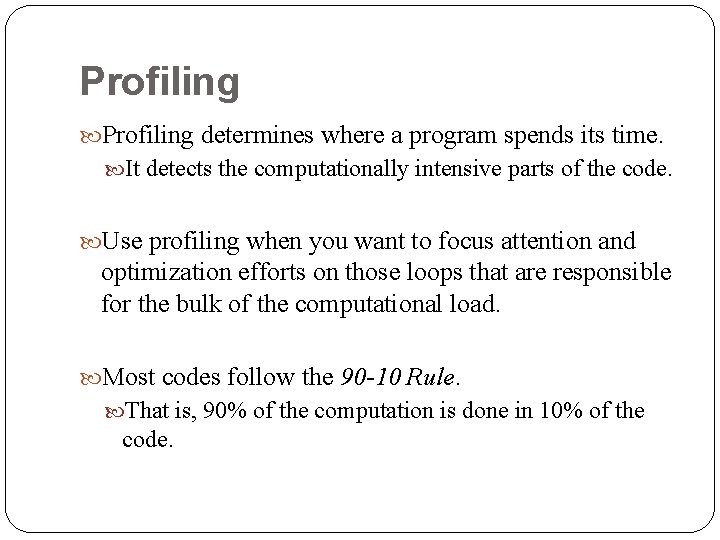
Profiling determines where a program spends its time. It detects the computationally intensive parts of the code. Use profiling when you want to focus attention and optimization efforts on those loops that are responsible for the bulk of the computational load. Most codes follow the 90 -10 Rule. That is, 90% of the computation is done in 10% of the code.

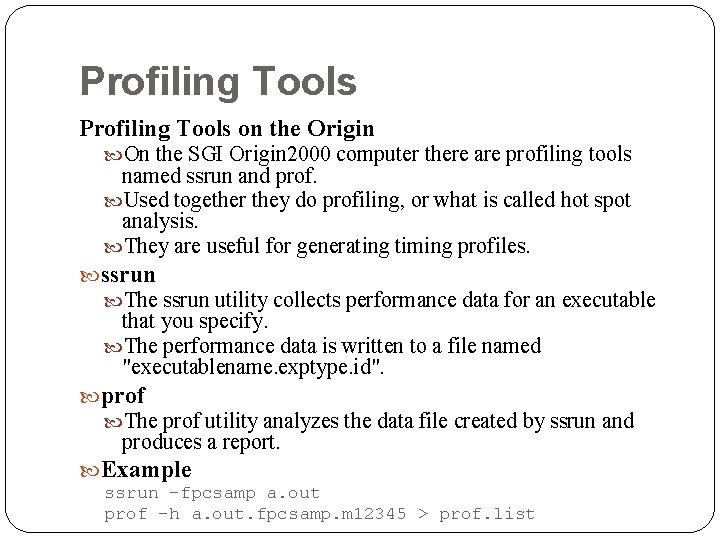
Profiling Tools on the Origin On the SGI Origin 2000 computer there are profiling tools named ssrun and prof. Used together they do profiling, or what is called hot spot analysis. They are useful for generating timing profiles. ssrun The ssrun utility collects performance data for an executable that you specify. The performance data is written to a file named "executablename. exptype. id". prof The prof utility analyzes the data file created by ssrun and produces a report. Example ssrun -fpcsamp a. out prof -h a. out. fpcsamp. m 12345 > prof. list

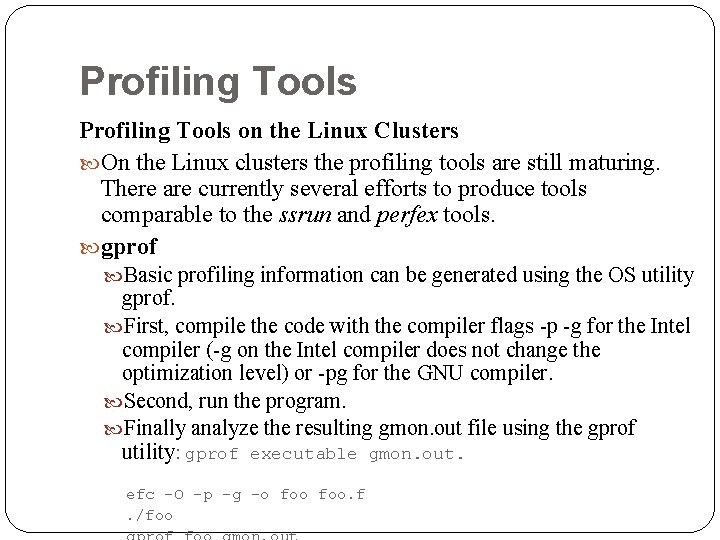
Profiling Tools on the Linux Clusters On the Linux clusters the profiling tools are still maturing. There are currently several efforts to produce tools comparable to the ssrun and perfex tools. gprof Basic profiling information can be generated using the OS utility gprof. First, compile the code with the compiler flags -p -g for the Intel compiler (-g on the Intel compiler does not change the optimization level) or -pg for the GNU compiler. Second, run the program. Finally analyze the resulting gmon. out file using the gprof utility: gprof executable gmon. out. efc -O -p -g -o foo. f. /foo

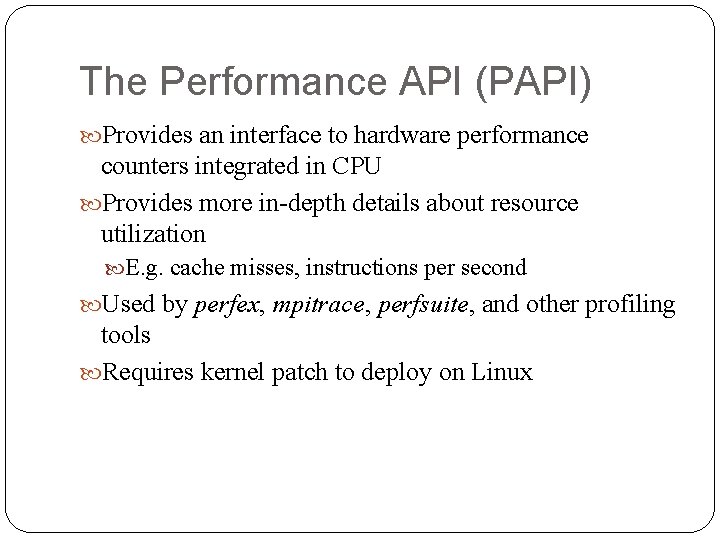
The Performance API (PAPI) Provides an interface to hardware performance counters integrated in CPU Provides more in-depth details about resource utilization E. g. cache misses, instructions per second Used by perfex, mpitrace, perfsuite, and other profiling tools Requires kernel patch to deploy on Linux

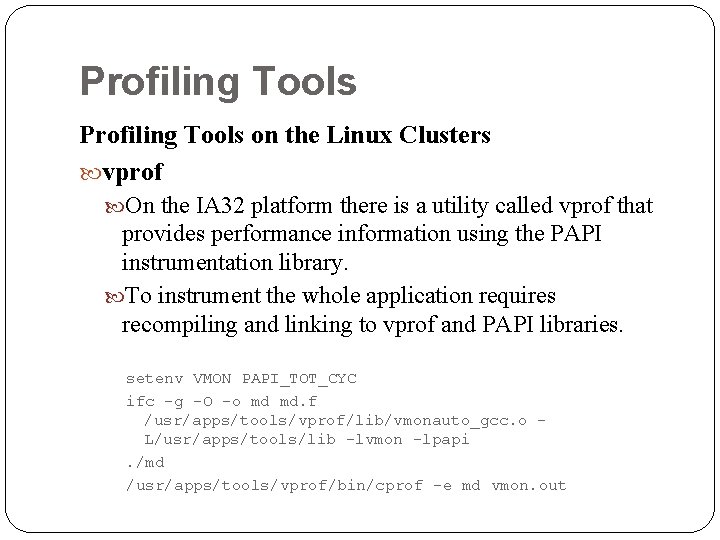
Profiling Tools on the Linux Clusters vprof On the IA 32 platform there is a utility called vprof that provides performance information using the PAPI instrumentation library. To instrument the whole application requires recompiling and linking to vprof and PAPI libraries. setenv VMON PAPI_TOT_CYC ifc -g -O -o md md. f /usr/apps/tools/vprof/lib/vmonauto_gcc. o L/usr/apps/tools/lib -lvmon -lpapi. /md /usr/apps/tools/vprof/bin/cprof -e md vmon. out

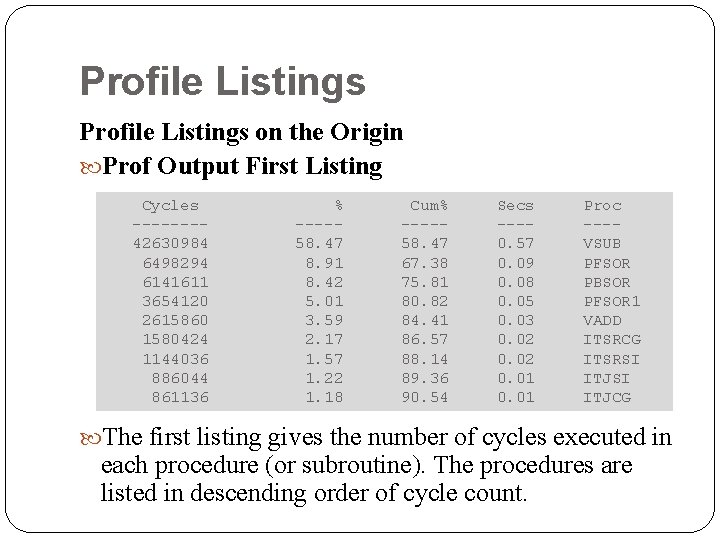
Profile Listings on the Origin Prof Output First Listing Cycles -------42630984 6498294 6141611 3654120 2615860 1580424 1144036 886044 861136 % ----58. 47 8. 91 8. 42 5. 01 3. 59 2. 17 1. 57 1. 22 1. 18 Cum% ----58. 47 67. 38 75. 81 80. 82 84. 41 86. 57 88. 14 89. 36 90. 54 Secs ---0. 57 0. 09 0. 08 0. 05 0. 03 0. 02 0. 01 Proc ---VSUB PFSOR PBSOR PFSOR 1 VADD ITSRCG ITSRSI ITJCG The first listing gives the number of cycles executed in each procedure (or subroutine). The procedures are listed in descending order of cycle count.

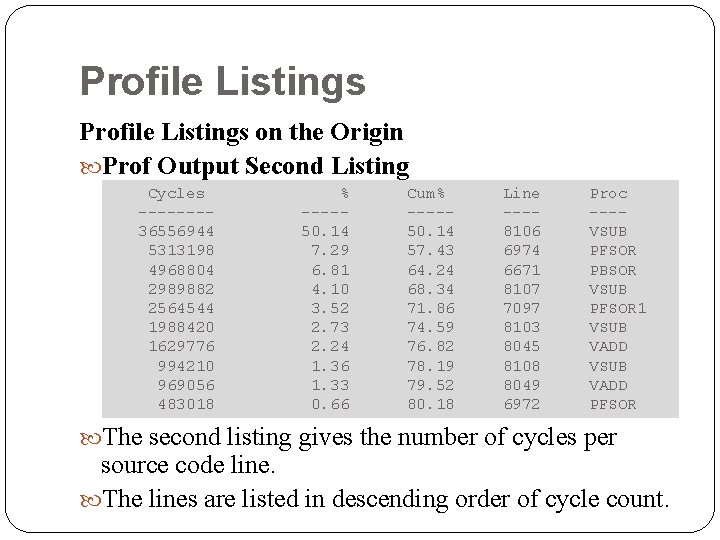
Profile Listings on the Origin Prof Output Second Listing Cycles -------36556944 5313198 4968804 2989882 2564544 1988420 1629776 994210 969056 483018 % ----50. 14 7. 29 6. 81 4. 10 3. 52 2. 73 2. 24 1. 36 1. 33 0. 66 Cum% ----50. 14 57. 43 64. 24 68. 34 71. 86 74. 59 76. 82 78. 19 79. 52 80. 18 Line ---8106 6974 6671 8107 7097 8103 8045 8108 8049 6972 Proc ---VSUB PFSOR PBSOR VSUB PFSOR 1 VSUB VADD PFSOR The second listing gives the number of cycles per source code line. The lines are listed in descending order of cycle count.

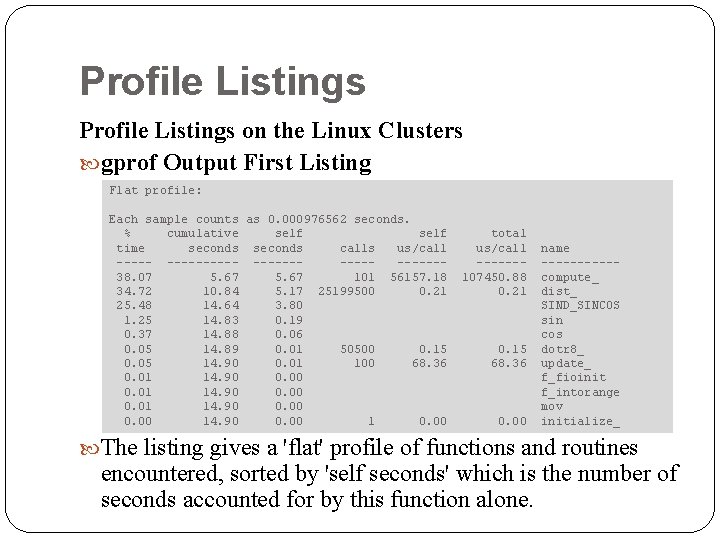
Profile Listings on the Linux Clusters gprof Output First Listing Flat profile: Each sample counts as 0. 000976562 seconds. % cumulative self time seconds calls us/call ----------38. 07 5. 67 101 56157. 18 34. 72 10. 84 5. 17 25199500 0. 21 25. 48 14. 64 3. 80 1. 25 14. 83 0. 19 0. 37 14. 88 0. 06 0. 05 14. 89 0. 01 50500 0. 15 0. 05 14. 90 0. 01 100 68. 36 0. 01 14. 90 0. 00 14. 90 0. 00 1 0. 00 total us/call ------107450. 88 0. 21 0. 15 68. 36 0. 00 name -----compute_ dist_ SIND_SINCOS sin cos dotr 8_ update_ f_fioinit f_intorange mov initialize_ The listing gives a 'flat' profile of functions and routines encountered, sorted by 'self seconds' which is the number of seconds accounted for by this function alone.
![Profile Listings on the Linux Clusters gprof Output Second Listing Call graph index 1 Profile Listings on the Linux Clusters gprof Output Second Listing Call graph: index ----[1]](https://slidetodoc.com/presentation_image/26e544a1739d0f322217832eb4542b27/image-25.jpg)
Profile Listings on the Linux Clusters gprof Output Second Listing Call graph: index ----[1] % time -----72. 9 self children called name ---------------------0. 00 10. 86 main [1] 5. 67 5. 18 101/101 compute_ [2] 0. 01 0. 00 100/100 update_ [8] 0. 00 1/1 initialize_ [12] ----------------------------------5. 67 5. 18 101/101 main [1] [2] 72. 8 5. 67 5. 18 101 compute_ [2] 5. 17 0. 00 25199500/25199500 dist_ [3] 0. 01 0. 00 50500/50500 dotr 8_ [7] ----------------------------------5. 17 0. 00 25199500/25199500 compute_ [2] [3] 34. 7 5. 17 0. 00 25199500 dist_ [3] ----------------------------------<spontaneous> [4] 25. 5 3. 80 0. 00 SIND_SINCOS [4] … … The second listing gives a 'call-graph' profile of functions and routines encountered. The definitions of the columns are specific to the line in question. Detailed information is contained in the full output from gprof.

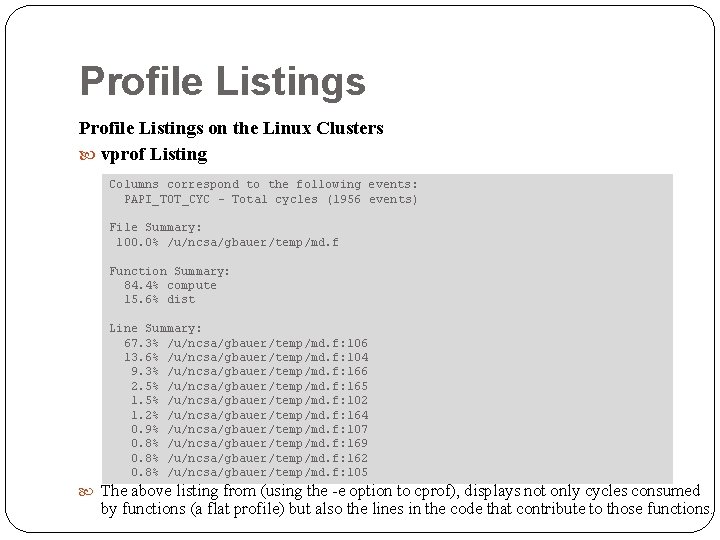
Profile Listings on the Linux Clusters vprof Listing Columns correspond to the following events: PAPI_TOT_CYC - Total cycles (1956 events) File Summary: 100. 0% /u/ncsa/gbauer/temp/md. f Function Summary: 84. 4% compute 15. 6% dist Line Summary: 67. 3% /u/ncsa/gbauer/temp/md. f: 106 13. 6% /u/ncsa/gbauer/temp/md. f: 104 9. 3% /u/ncsa/gbauer/temp/md. f: 166 2. 5% /u/ncsa/gbauer/temp/md. f: 165 1. 5% /u/ncsa/gbauer/temp/md. f: 102 1. 2% /u/ncsa/gbauer/temp/md. f: 164 0. 9% /u/ncsa/gbauer/temp/md. f: 107 0. 8% /u/ncsa/gbauer/temp/md. f: 169 0. 8% /u/ncsa/gbauer/temp/md. f: 162 0. 8% /u/ncsa/gbauer/temp/md. f: 105 The above listing from (using the -e option to cprof), displays not only cycles consumed by functions (a flat profile) but also the lines in the code that contribute to those functions.

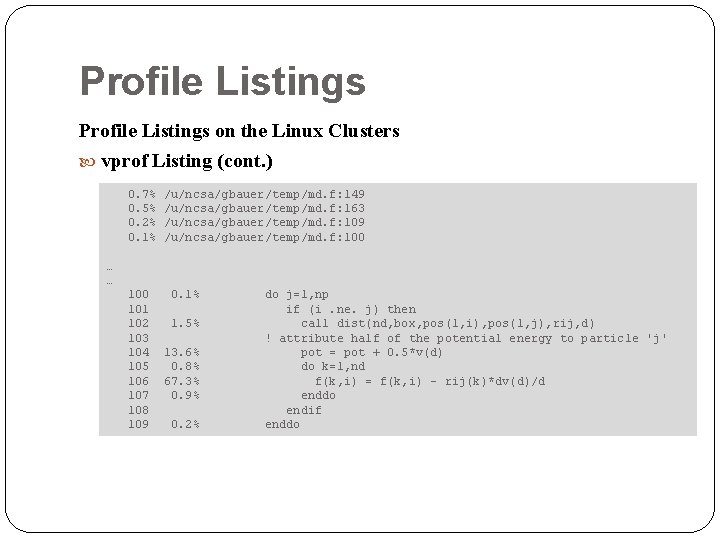
Profile Listings on the Linux Clusters vprof Listing (cont. ) 0. 7% 0. 5% 0. 2% 0. 1% /u/ncsa/gbauer/temp/md. f: 149 /u/ncsa/gbauer/temp/md. f: 163 /u/ncsa/gbauer/temp/md. f: 109 /u/ncsa/gbauer/temp/md. f: 100 … … 100 101 102 103 104 105 106 107 108 109 0. 1% 1. 5% 13. 6% 0. 8% 67. 3% 0. 9% 0. 2% do j=1, np if (i. ne. j) then call dist(nd, box, pos(1, i), pos(1, j), rij, d) ! attribute half of the potential energy to particle 'j' pot = pot + 0. 5*v(d) do k=1, nd f(k, i) = f(k, i) - rij(k)*dv(d)/d enddo endif enddo

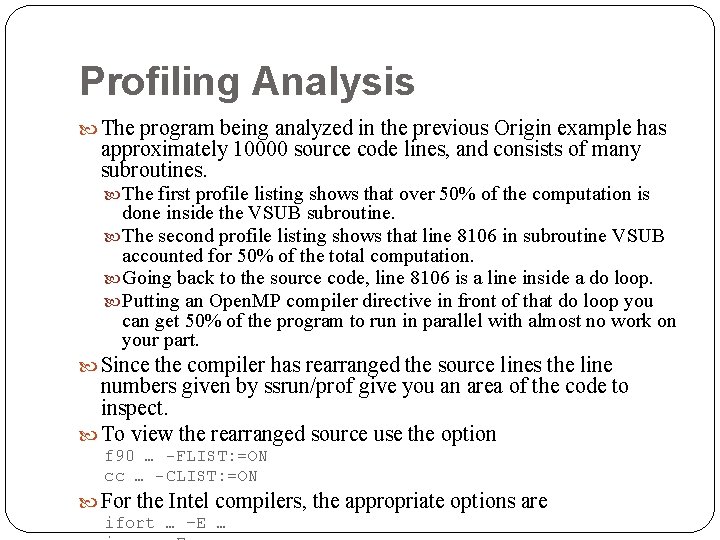
Profiling Analysis The program being analyzed in the previous Origin example has approximately 10000 source code lines, and consists of many subroutines. The first profile listing shows that over 50% of the computation is done inside the VSUB subroutine. The second profile listing shows that line 8106 in subroutine VSUB accounted for 50% of the total computation. Going back to the source code, line 8106 is a line inside a do loop. Putting an Open. MP compiler directive in front of that do loop you can get 50% of the program to run in parallel with almost no work on your part. Since the compiler has rearranged the source lines the line numbers given by ssrun/prof give you an area of the code to inspect. To view the rearranged source use the option f 90 … -FLIST: =ON cc … -CLIST: =ON For the Intel compilers, the appropriate options are ifort … –E …

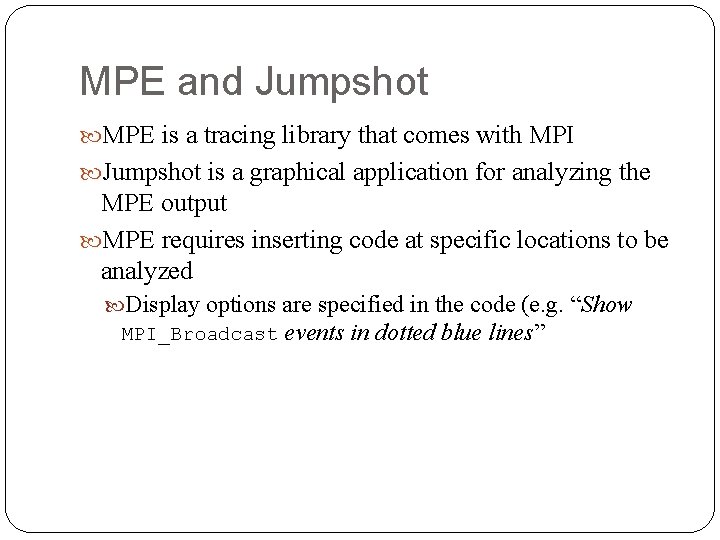
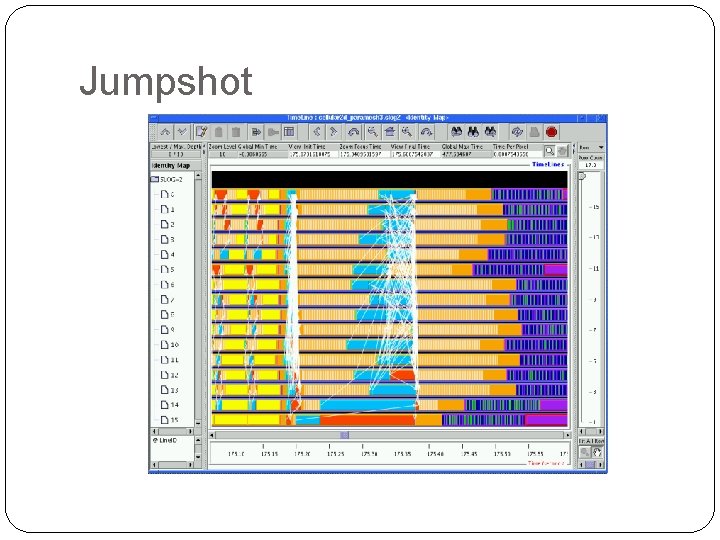
MPE and Jumpshot MPE is a tracing library that comes with MPI Jumpshot is a graphical application for analyzing the MPE output MPE requires inserting code at specific locations to be analyzed Display options are specified in the code (e. g. “Show MPI_Broadcast events in dotted blue lines”

Jumpshot

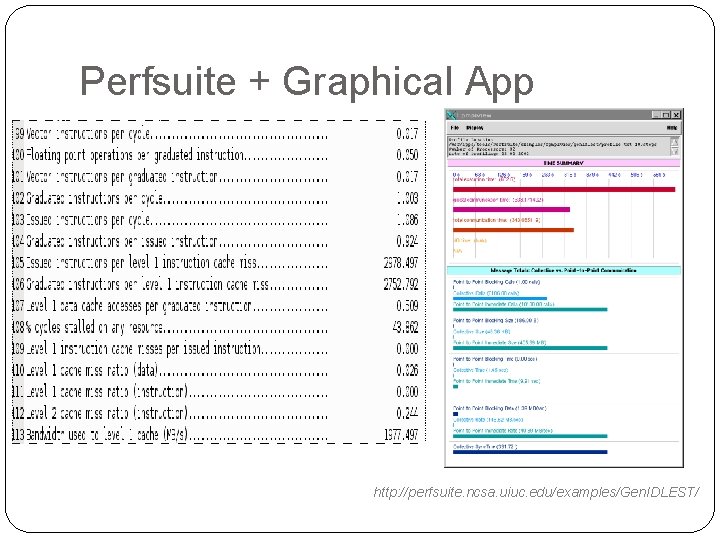
Perfsuite Collection of tools, utilities, and libraries for software performance analysis Intel architectures only Provides many in-depth statistics Operations per cycle, Cache miss/hit data, etc. Not difficult to use (but may be difficult to compile) mpiexec –np $NN psrun wrf. exe psprocess wrf. exe. NN_n. xml Requires PAPI kernel patch for showing most information

Perfsuite + Graphical App http: //perfsuite. ncsa. uiuc. edu/examples/Gen. IDLEST/

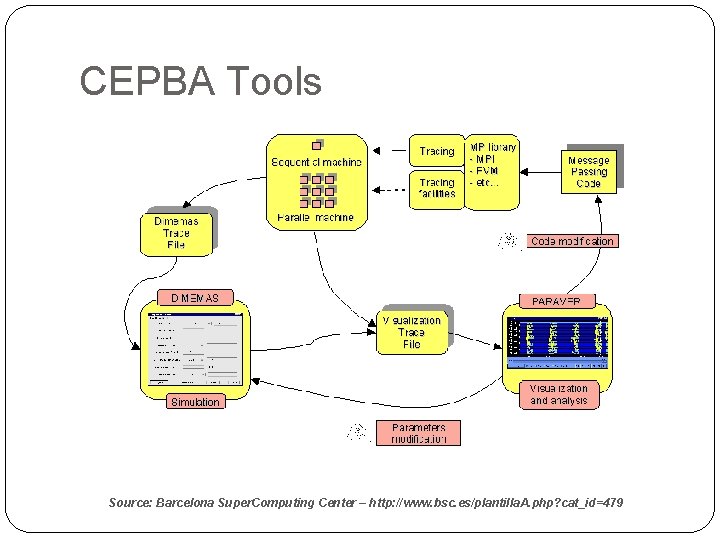
CEPBA Tools Developed at the European Center for Parallelism at Barcelona Currently not free Provide text-based and graphical applications for: Execution analysis and optimization Execution prediction 3 Main tools: Mpitrace, Dimemas, Paraver

CEPBA Tools Powerful, but complex Requires PAPI kernel patch for showing most information May require application to be recompiled Very large trace files for long executions and/or high number of processors (e. g. over 10 GB)

CEPBA Tools Source: Barcelona Super. Computing Center – http: //www. bsc. es/plantilla. A. php? cat_id=479

Visualizing with Paraver Process: 1. (Compile application with mpitrace libraries linked) 2. Execute application (and preload mpitrace libraries if not linked to the application) 3. Convert individual trace files to a Paraver file 4. “Chop” paraver trace file, if it is too big

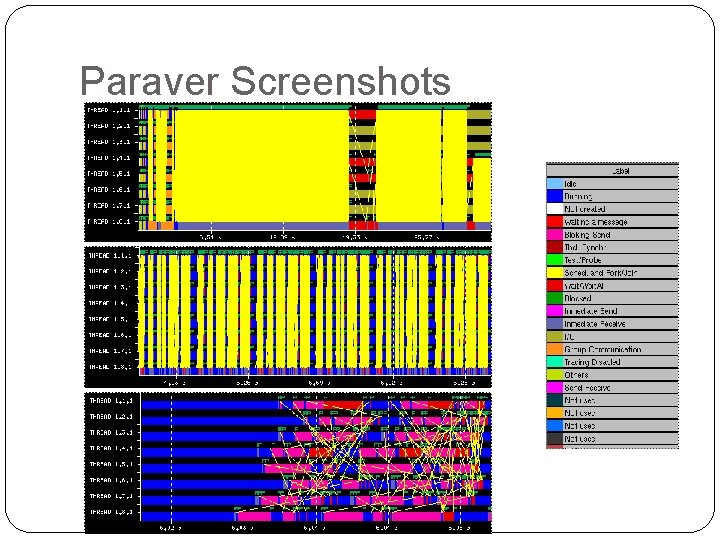
Paraver Screenshots

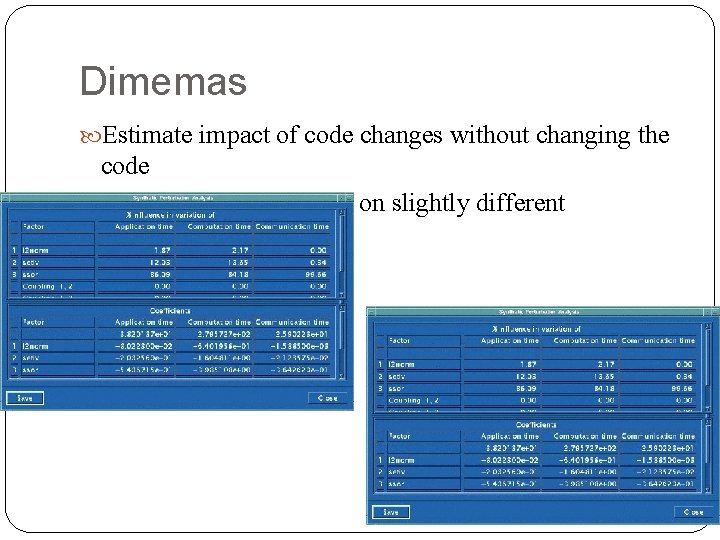
Dimemas Estimate impact of code changes without changing the code Estimate execution time on slightly different architectures

Further Information SGI Irix man etime man 3 time man 1 time man busage man timers man ssrun man prof Origin 2000 Performance Tuning and Optimization Guide Linux Clusters man 3 clock man 2 gettimeofday man 1 time man 1 gprof man 1 B qstat Intel Compilers Vprof on NCSA Linux Cluster