Paper 6 Neuropeptide Y overexpression in the hypothalamus


 if energy")


- Slides: 23
Paper 6 Neuropeptide Y overexpression in the hypothalamus
Defending body weight during “Feast or famine” Human: weight returns to normal after dieting 100 Rat: Weight returns to normal after overfeeding or restriction 500 Follow up obese subjects after a weight loss % subjects with reduced weight Overconsumption Weight (g) 300 restriction 0 0 1 2 years 3 0 30 45 days 80
Food Intake and Set Point Energy content of diet 6 MJ/d 13 MJ/d Weight Change (kg) 3 0 60 130 Time (d) -5 Isocaloric is 10 MJ/d
A Set Point for body weight? • Weight constant (over medium term) if energy intake = energy expenditure • So there must be acute compensatory changes – Increased intake when expenditure high • And vice-versa so decreased intake when expenditure low – Decreased expenditure when intake low • And vice-versa so increased expenditure when intake high
Metabolic Rate correlates with FFM total 13 Metabolic Rate MJ/day obese control 9 basal 5 35 45 55 Fat free mass (kg) 65
BMR/RMR • BMR is determined by the lean body mass – The mass of metabolically active tissue • Muscle metabolically active because it is continually pumping ions, even when it is ‘still’ – Adipose tissue is relatively inactive – So plots of metabolic rates vs fat free mass (FFM) are linear • Slope is 4 ml O 2 consumed per min per kg FFM (ie, about 100 k. J/day/kg FFM) • Overweight people do not have lower BMRs • Indeed the extra weight makes whole body metabolic rate higher • But the situation changes if the subject is not in ‘energy balance’
RMR change during acute weight loss In an adult rats in energy balance RMR is linearly associated with weight 40 RMR (kcal/d) Weight loss ie: negative energy balance is associated with drop in RMR greater than predicted from change in weight alone 20 330 380 Weight (g) 430 In the Zucker obese rat, a weight loss of just 6% causes RMR to decrease to that of a control rat 50% the size!
Weight Loss in Humans It was expected that as weight declines, so should metabolic rate – and that the ‘slope’ of the relationship would be the same as the red line “Normal” relationship between metabolic rate and weight in these subjects 350 RMR (ml O 2/min) 250 As weight declines, metabolic rate goes down MORE than expected 150 50 100 Weight (kg) 150 In obese humans, weight loss disproportionally reduces RMR (they end up with the same RMR as people who weigh much less)
Changes in BMR reflect energy imbalance • BMR strongly linked to fat free mass when – subject is in energy balance – near their ‘set point’ • If your BMR differs from the ‘norm’ then you are probably not in energy balance – Once away from the set point the BMR/weight relationship is skewed • Can the set point be manipulated?
Determinants of Set Point • Genetic and early life events • Environmental
• Lack of will power, lazy – YOUR fault • Availability of food, lack of opportunity to exercise – SOCIETY’S fault • Heredited, genetically hardwired set point – YOUR PARENT’S fault
Set Point Inheritance • Correlation of weights between family members • • • Spouses 0. 12 Mother/daughter, father/son 0. 2 Different sex siblings 0. 2 Same sex siblings 0. 26 Twins 0. 6 – BUT NOTE even among twins IT IS ONLY 60% ‘GENETICS • Twins reared apart vs reared together – Several different studies – Correlation of ‘within’ twin weights always about 0. 6 – Regardless of co- or separate upbringing
Set Point Inheritance • Identical twins put on either excess calories or calorie reduction – Between different pairs of twins the weight gains/losses were vastly different – Within pairs of twins, the weight gains/losses were very similar
Environmental influences Increasing the Set Point weight gain ie: positive energy balance • Increased consumption of a palatable, high-calorie diet accelerates weight gain 500 Fed cafeteria diet – Some rats resistant Body – Trait can be selectively bred Wt (g) – Set point defended ‘Normal’ diet • But rats in middle range interesting – So even lean rats eventually become obese – Reversible in the short term but not after extended hyperphagia • A new ‘set point’ created 200 0 12 Weeks 24
Early life events and Set Point • Fetal environment – Both under and over supply of calories – Depends on trimester • Under nutrition in first trimester • Over nutrition in third trimester • Also “obeseogenic” environment early in life – Administration of insulin and other hormones to mothers • Hard wiring of neurones involved in lipostat system? – Cross fostering experiments – under/overfed mothers – Effects can even be transferred to the next generation • Exercise early in life – Appears to lower the set point • Common theme is importance of intervention during period of active brain and nervous system development
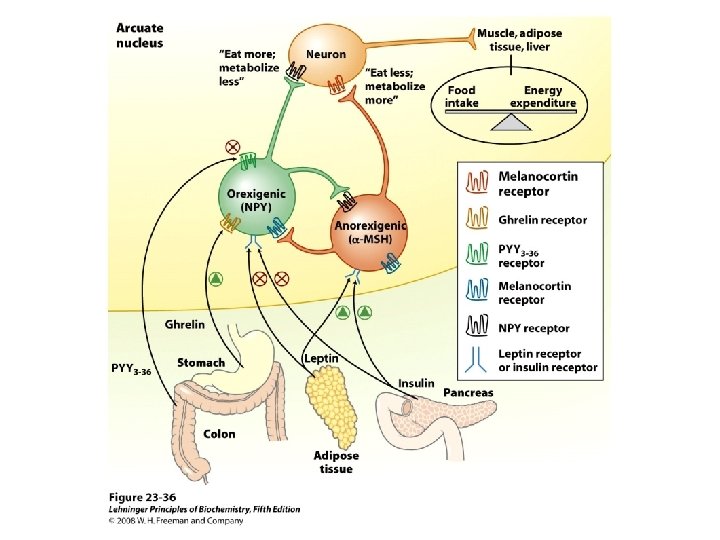
Inputs to eat and reduce energy expenditure Agouti-related Protein Neuropeptide Y ANABOLIC OREXIGENIC NPY + AGRP Y 1/Y 5 - Food Intake MC 4 -R ARCUATE NUCLEUS Metabolic rate + CATABOLIC ANOREXIGENIC Inputs to stop eating and increase energy expenditure PARAVENTRICULAR NUCLEUS Melanocortin-4 receptor α-MSH α-melanocyte stimulating hormone Pro-opiomelanocortin POMC and CART Cocaine- and amphetamine regulated transcript
Added complexity • The two arms interact more directly – agonists of one arm often direct antagonists of other – The Fighting Squid • Many other areas involved – Lateral Hypothalamus • E. g. Destruction causes anorexia • Many other different types of neurons involved – Interaction with other areas that use serotonin (5 -HT) • POMC/CART neurons receive projections from these • Serotonin reuptake inhibitors - appetite suppressing drugs – Endogenous cannabinoids, dopamine systems • cannabinoid receptors current drug targets
Tools to research hypothalamic appetite control • Genetic manipulation in mice – Knockouts – Over-expression • Intracerebroventricular injection – agonists, antagonists, – drugs, – antibodies
NPY • Long-term central administration – Reduced energy expenditure and hyperphagia • Leading to obesity – A lot of extra hormonal changes • insulin, corticosternone – But which arm is more important? • Hyperphagia or reduced expenditure • Does NPY exert its effects only through increased food intake? • NPY overexpression in hypothalamus – Hypothalamic injections of adenovirus expressing NPY • r. AAV-NPY • Finer injection of r. AAV-NPY to paraventricular nucleus – Still causes obesity • Does NPY cause obesity if food is restricted?
Approach • Rats injected with r. AAV-NPY or control adenovirus into PVN – Followed for several weeks – Confirm NPY expression in PVN • Then AAV-NPY subdivided into pair fed and unrestricted groups – Pair fed are food matched to controls • Transmitters in the abdominal cavity to follow – Motion – Body temperature – Measures of energy expenditure (? )
Focus • Simple concept • Good for practicing describing • Interesting relationship to Set Point control – Does NPY expression cause over-eating and weight gain – Forever or only up until a certain point?
3 groups… easy measures