
PANEL REGRESSION plm package By Mike Jadoo Purpose

PANEL REGRESSION (plm package) By Mike Jadoo
Purpose • Bring about an awareness • Enable individuals to properly create analysis • Select the most appropriate model(s).

Special Thank you
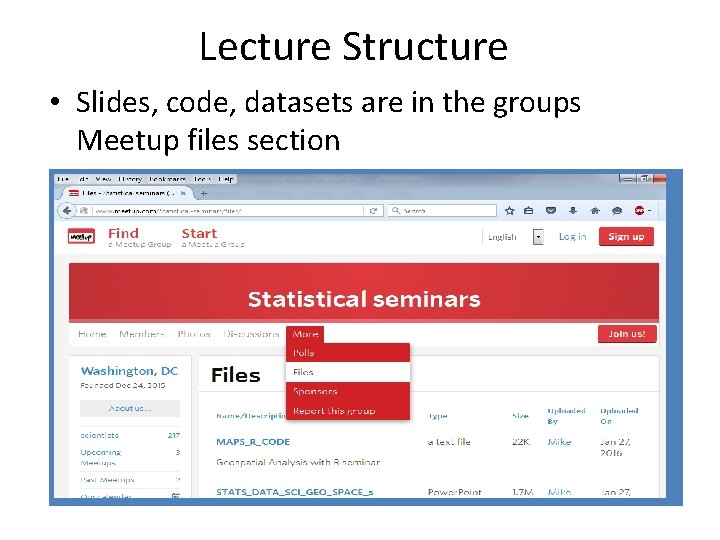
Lecture Structure • Slides, code, datasets are in the groups Meetup files section
Lecture Structure • Can follow lecture and code or code after • You can use your own data sets • There will be some web exercises

R-Studio PACKAGE task Plm Lmtest XLCONNECT f. Basics Tseries stargazer PSYCH panel regression model additional statistical tests Read in excel files for the Jarque Bera Test ADF test for nice reports Describe( ) descriptive statistics
Data series • SNAP benefits data from USDA • Civilian population estimates from Census • Food store employment data from BEA
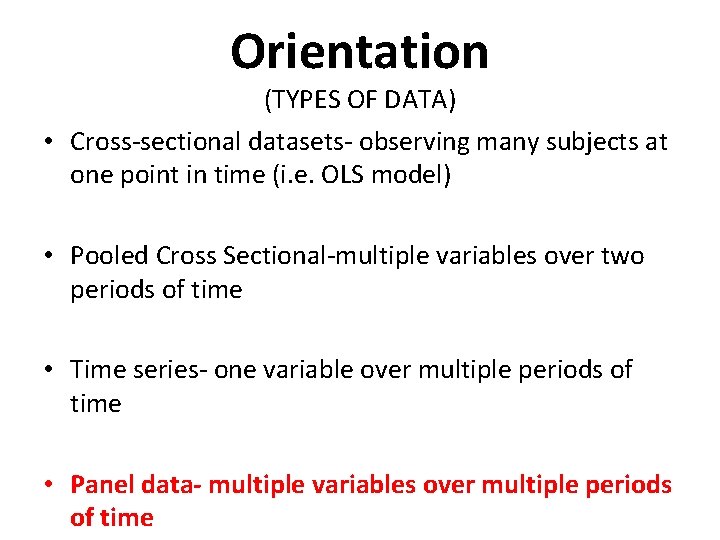
Orientation (TYPES OF DATA) • Cross-sectional datasets- observing many subjects at one point in time (i. e. OLS model) • Pooled Cross Sectional-multiple variables over two periods of time • Time series- one variable over multiple periods of time • Panel data- multiple variables over multiple periods of time

Orientation (Terminology Clarification) Longitudinal data • Pooled Cross sectional • Time series • Panel Data
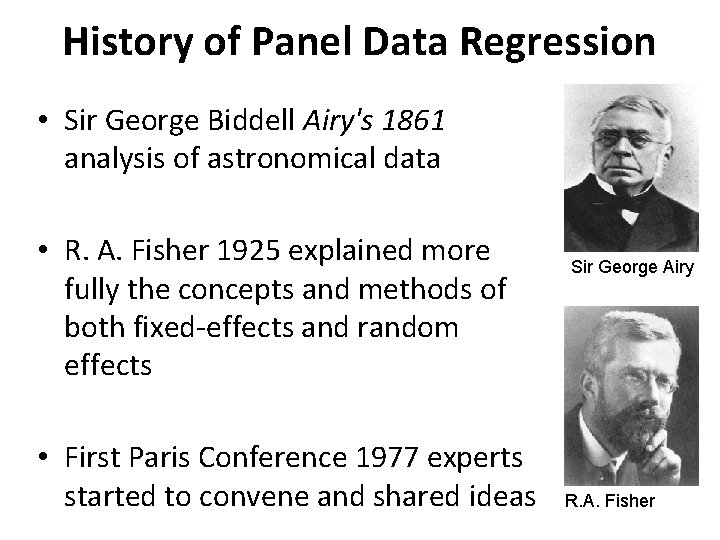
History of Panel Data Regression • Sir George Biddell Airy's 1861 analysis of astronomical data • R. A. Fisher 1925 explained more fully the concepts and methods of both fixed-effects and random effects • First Paris Conference 1977 experts started to convene and shared ideas Sir George Airy R. A. Fisher
Why use panel regression model? • Gives more observations to analyze • More complicated characteristics and behavioral hypothesis can be tested • Better analysis of the nature of unobserved errors and individual [idiosyncratic] errors
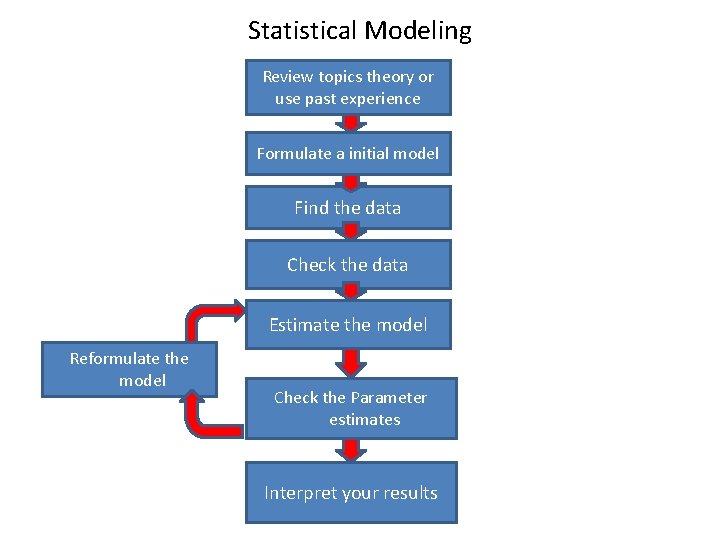
Statistical Modeling Review topics theory or use past experience Formulate a initial model Find the data Check the data Estimate the model Reformulate the model Check the Parameter estimates Interpret your results
Statistical modeling process review • Create the hypothesis - What are you trying to analyze or predict • Go over the topics relative theory -May involve extensive reading but it is the good first start!!
Finding the data sources Government sources Can’t find the data your looking for? Staff is there to help. There are more providers of data, some have a cost.

Panel data sets sources
Methodology • Review the data series methodology (document that tells you how the data is made), is this acceptable?
Reproducibility-(the NSF study) • The inability to reproduce scientific work has lead to the distrust in scientific findings among the public and experts. • Efforts have been made across all scientific backgrounds (including economics) to bring awareness to this issue and improve reproducibility of scientific work.

Reproducibility-(the NSF study) Why is this important: Improve scientific discovery Enhancing and Clarifying Protocols Increasing Sharing of Research Material Enhancing Education and Training
Reproducibility-(the NSF study) What can we do? -Make your code available and easy to read -Document each step when creating your model carefully and clearly
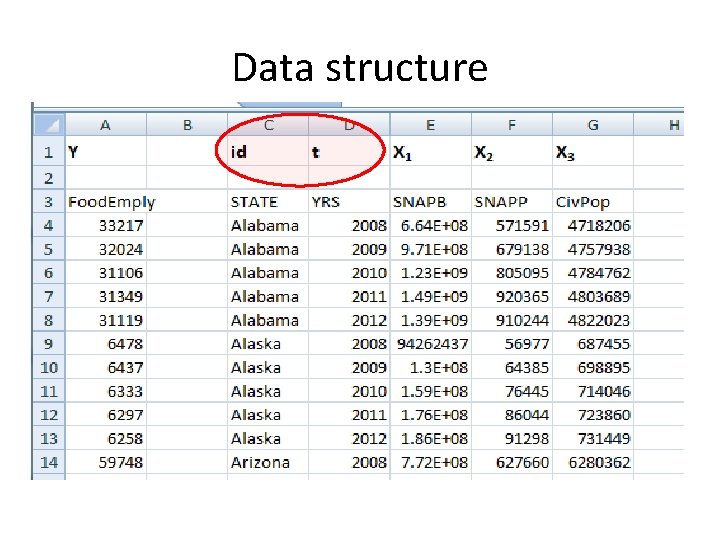
Data structure

Data structure
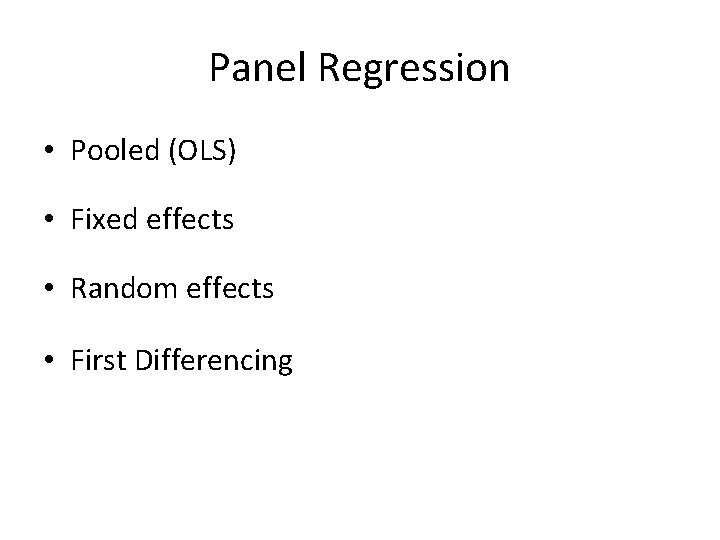
Panel Regression • Pooled (OLS) • Fixed effects • Random effects • First Differencing

Models Assumptions Fixed Effects 1. The model has parameter estimates and unobserved effect ai. 2. Data comes from cross sectional random sample 3. X variables changes over time, no prefect linear relationships exists among X’s 4. For each period, the expected value of the idiosyncratic errors given all X’s and the ai is 0 5. Variance for the idiosyncratic error terms and the ai is constant 6. The idiosyncratic errors are uncorrelated 7. The idiosyncratic errors are independent and normally distributed
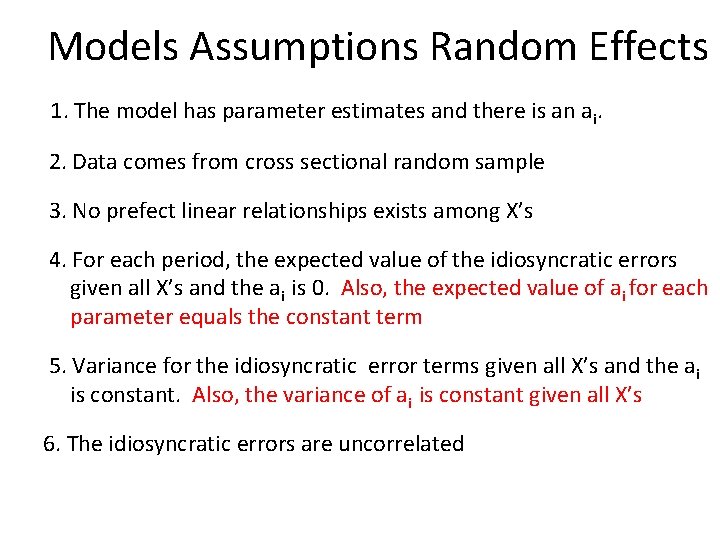
Models Assumptions Random Effects 1. The model has parameter estimates and there is an ai. 2. Data comes from cross sectional random sample 3. No prefect linear relationships exists among X’s 4. For each period, the expected value of the idiosyncratic errors given all X’s and the ai is 0. Also, the expected value of ai for each parameter equals the constant term 5. Variance for the idiosyncratic error terms given all X’s and the ai is constant. Also, the variance of ai is constant given all X’s 6. The idiosyncratic errors are uncorrelated
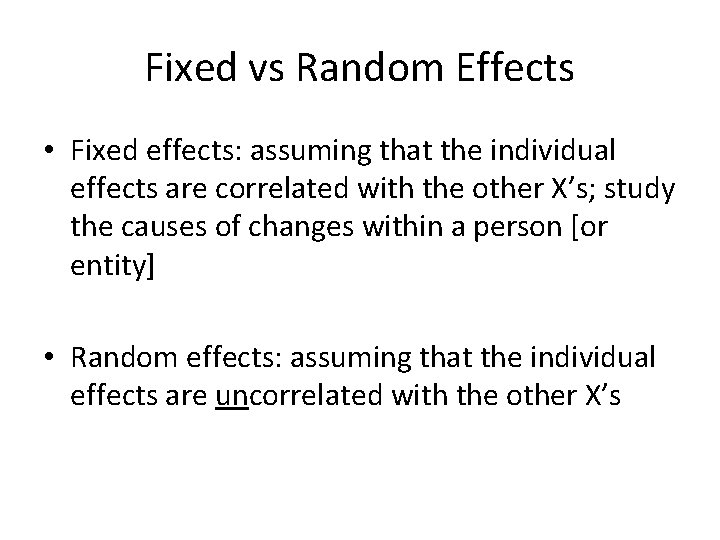
Fixed vs Random Effects • Fixed effects: assuming that the individual effects are correlated with the other X’s; study the causes of changes within a person [or entity] • Random effects: assuming that the individual effects are uncorrelated with the other X’s
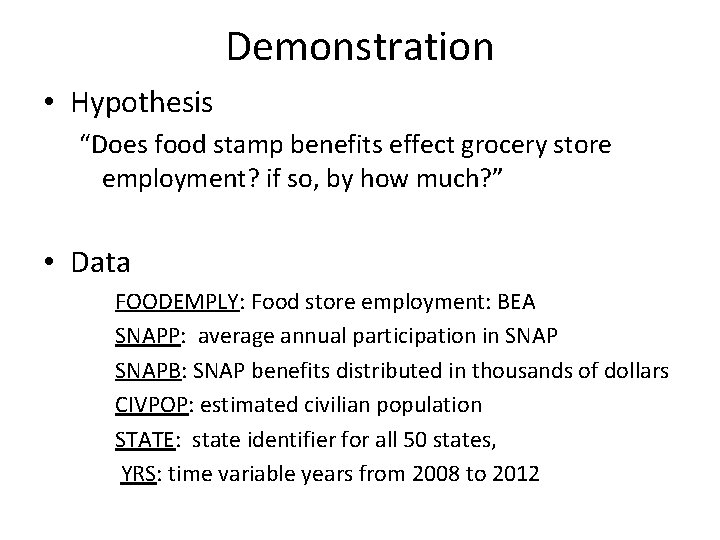
Demonstration • Hypothesis “Does food stamp benefits effect grocery store employment? if so, by how much? ” • Data FOODEMPLY: Food store employment: BEA SNAPP: average annual participation in SNAPB: SNAP benefits distributed in thousands of dollars CIVPOP: estimated civilian population STATE: state identifier for all 50 states, YRS: time variable years from 2008 to 2012
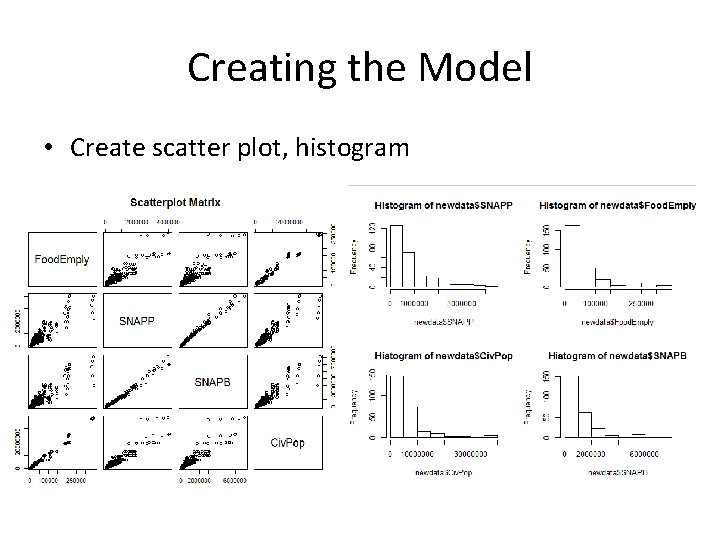
Creating the Model • Create scatter plot, histogram
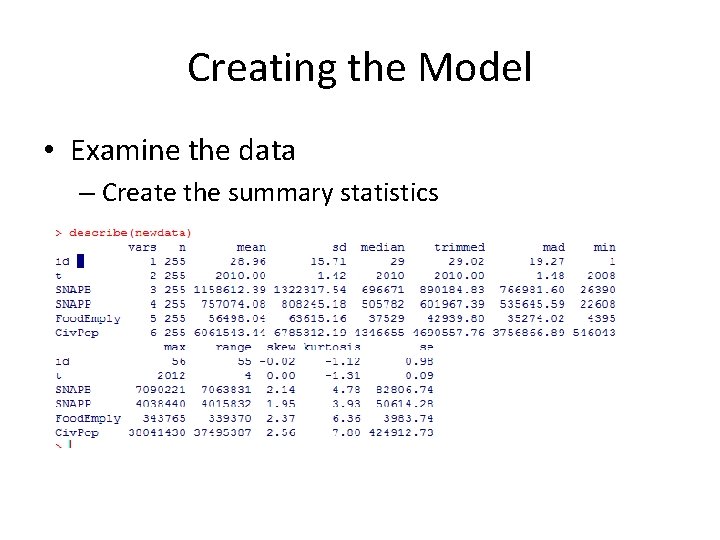
Creating the Model • Examine the data – Create the summary statistics
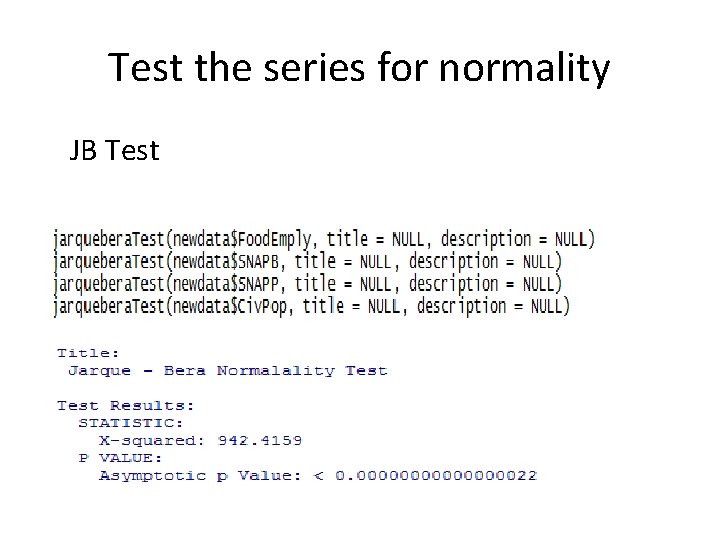
Test the series for normality JB Test
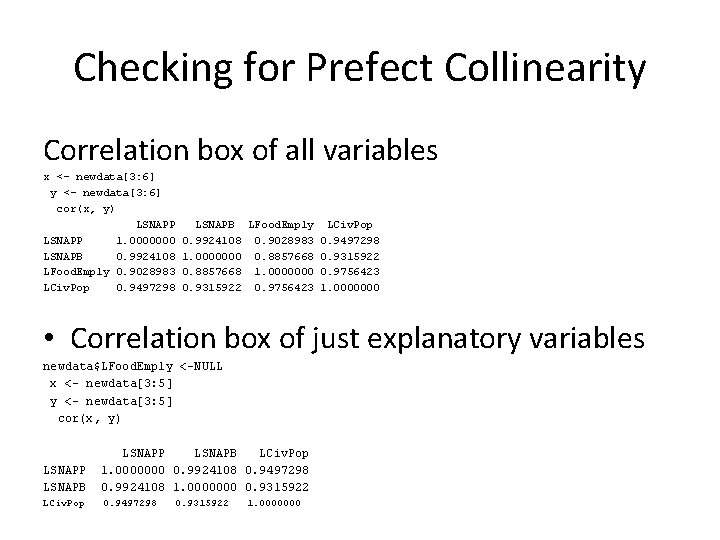
Checking for Prefect Collinearity Correlation box of all variables x <- newdata[3: 6] y <- newdata[3: 6] cor(x, y) LSNAPP 1. 0000000 LSNAPB 0. 9924108 LFood. Emply 0. 9028983 LCiv. Pop 0. 9497298 LSNAPB LFood. Emply LCiv. Pop 0. 9924108 0. 9028983 0. 9497298 1. 0000000 0. 8857668 0. 9315922 0. 8857668 1. 0000000 0. 9756423 0. 9315922 0. 9756423 1. 0000000 • Correlation box of just explanatory variables newdata$LFood. Emply <-NULL x <- newdata[3: 5] y <- newdata[3: 5] cor(x, y) LSNAPP LSNAPB LCiv. Pop 1. 0000000 0. 9924108 0. 9497298 0. 9924108 1. 0000000 0. 9315922 LCiv. Pop 0. 9497298 0. 9315922 1. 0000000
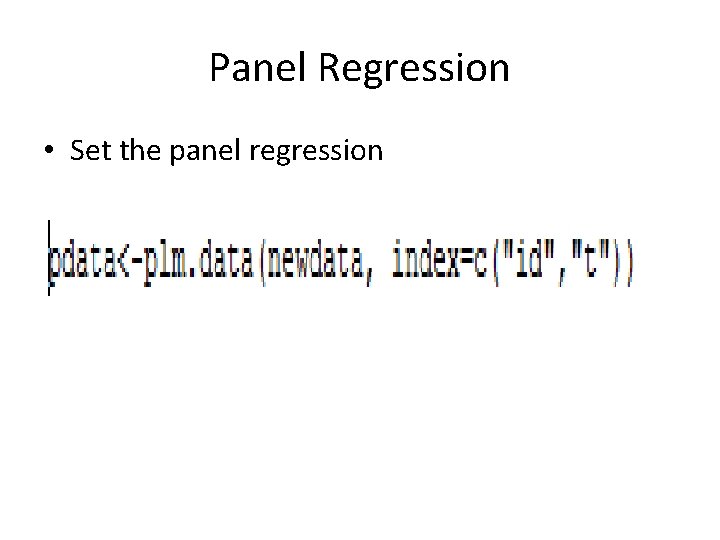
Panel Regression • Set the panel regression
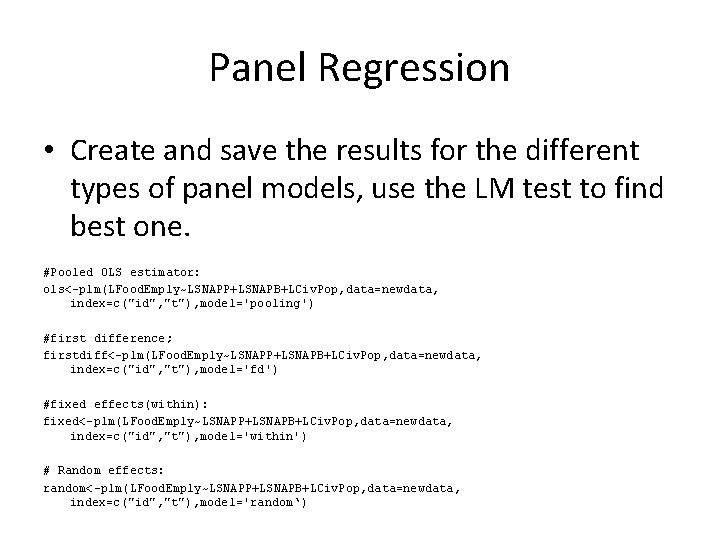
Panel Regression • Create and save the results for the different types of panel models, use the LM test to find best one. #Pooled OLS estimator: ols<-plm(LFood. Emply~LSNAPP+LSNAPB+LCiv. Pop, data=newdata, index=c("id", "t"), model='pooling') #first difference; firstdiff<-plm(LFood. Emply~LSNAPP+LSNAPB+LCiv. Pop, data=newdata, index=c("id", "t"), model='fd') #fixed effects(within): fixed<-plm(LFood. Emply~LSNAPP+LSNAPB+LCiv. Pop, data=newdata, index=c("id", "t"), model='within') # Random effects: random<-plm(LFood. Emply~LSNAPP+LSNAPB+LCiv. Pop, data=newdata, index=c("id", "t"), model='random‘)
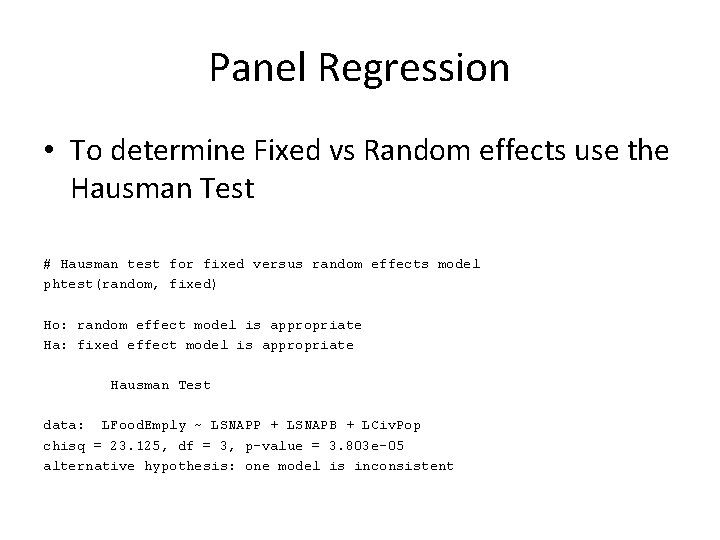
Panel Regression • To determine Fixed vs Random effects use the Hausman Test # Hausman test for fixed versus random effects model phtest(random, fixed) Ho: random effect model is appropriate Ha: fixed effect model is appropriate Hausman Test data: LFood. Emply ~ LSNAPP + LSNAPB + LCiv. Pop chisq = 23. 125, df = 3, p-value = 3. 803 e-05 alternative hypothesis: one model is inconsistent
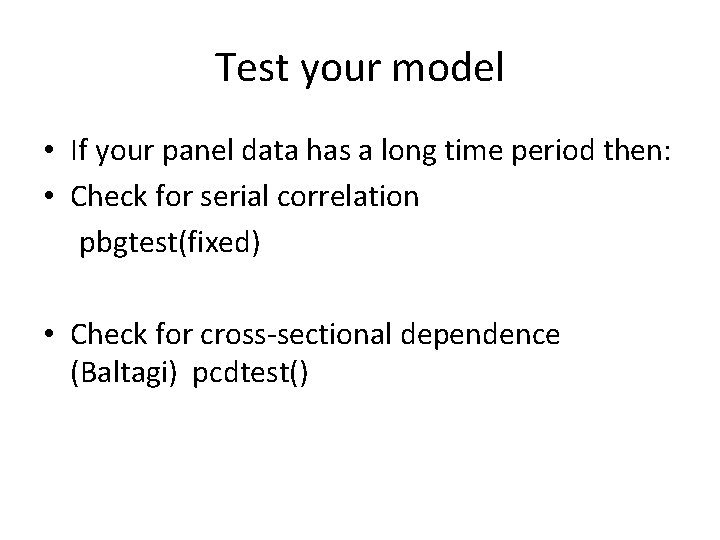
Test your model • If your panel data has a long time period then: • Check for serial correlation pbgtest(fixed) • Check for cross-sectional dependence (Baltagi) pcdtest()
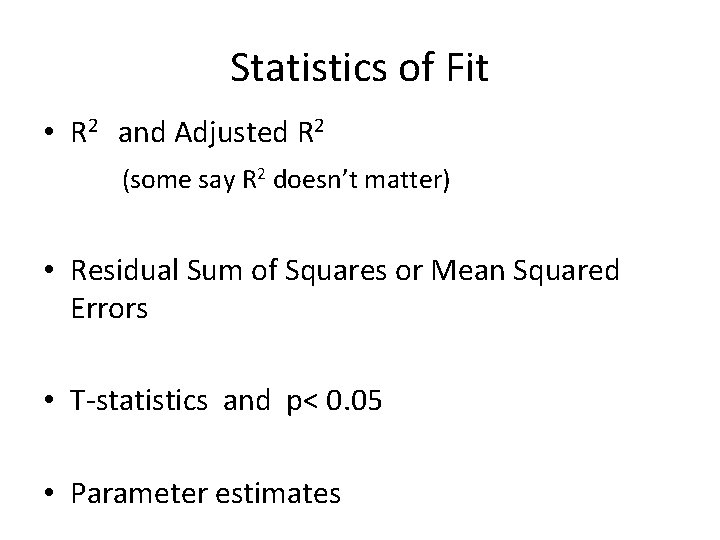
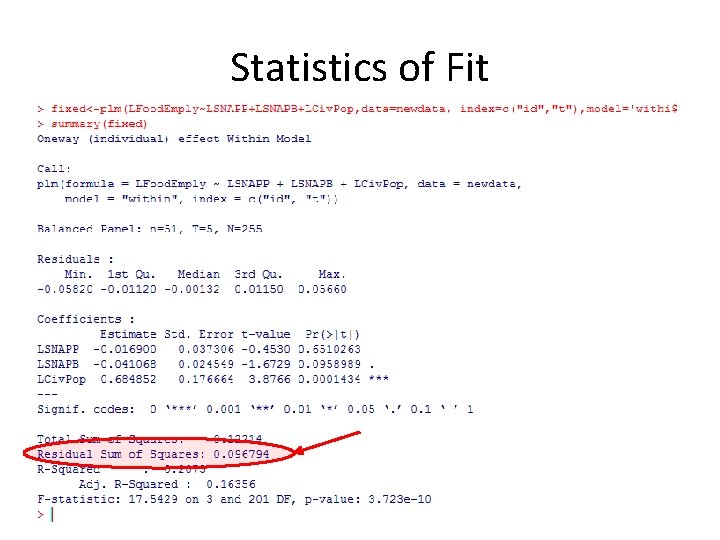
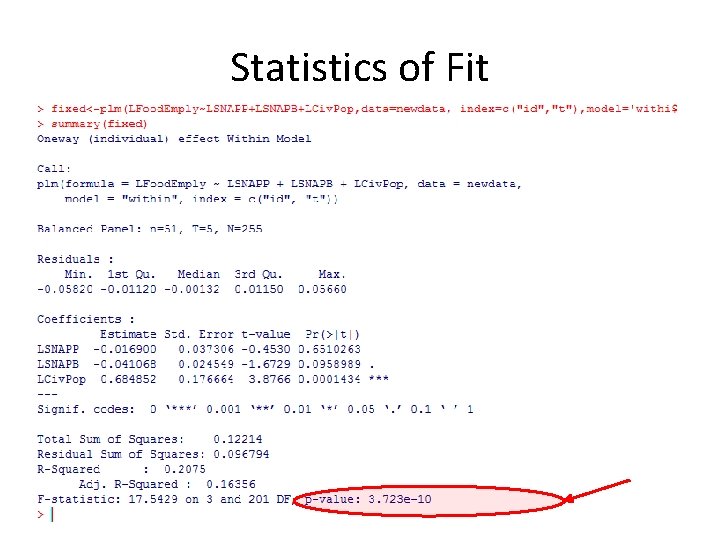
Statistics of Fit • R 2 and Adjusted R 2 (some say R 2 doesn’t matter) • Residual Sum of Squares or Mean Squared Errors • T-statistics and p< 0. 05 • Parameter estimates
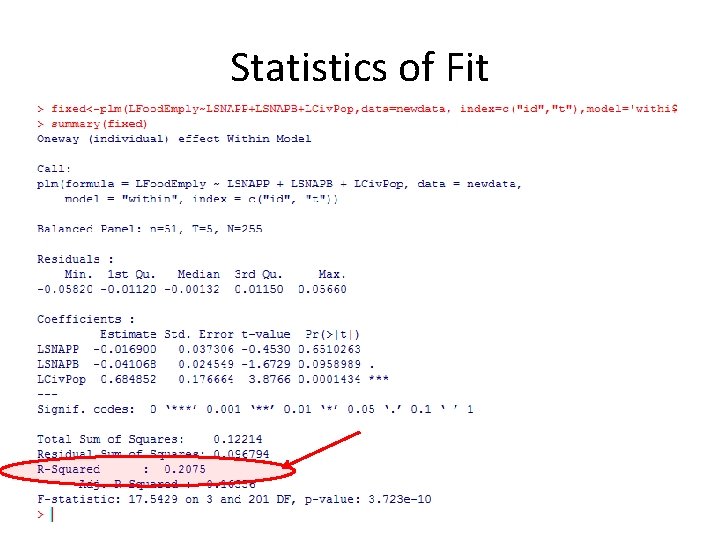
Statistics of Fit
Statistics of Fit
Statistics of Fit
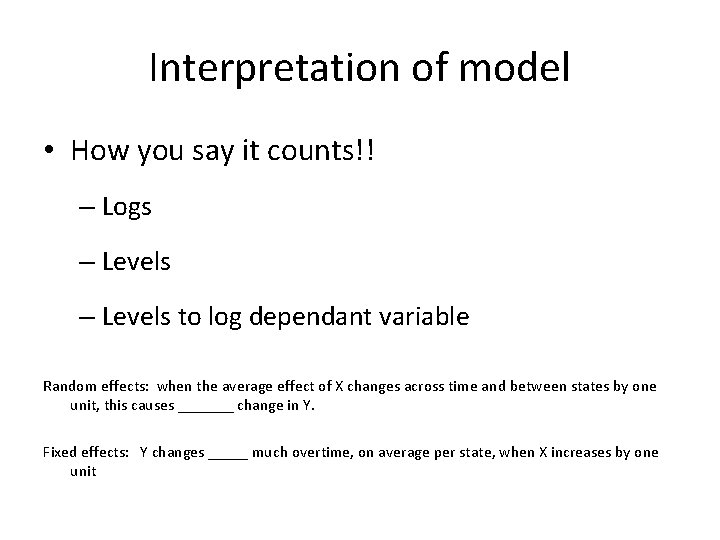
Interpretation of model • How you say it counts!! – Logs – Levels to log dependant variable Random effects: when the average effect of X changes across time and between states by one unit, this causes _______ change in Y. Fixed effects: Y changes _____ much overtime, on average per state, when X increases by one unit
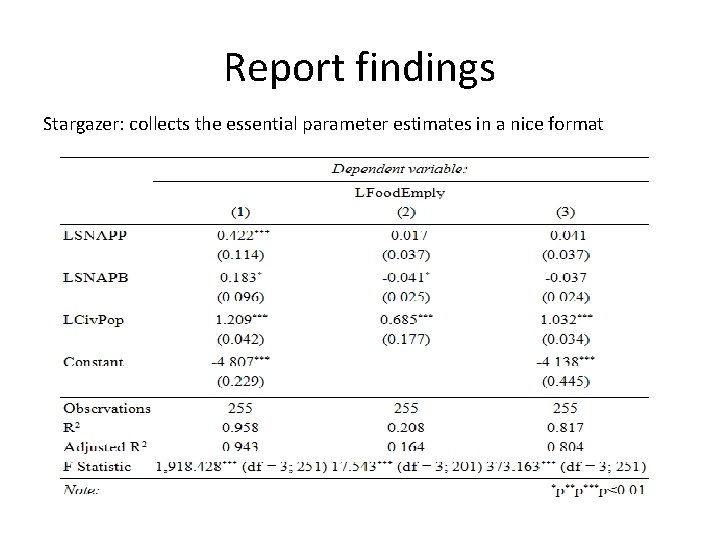
Report findings Stargazer: collects the essential parameter estimates in a nice format
Summary • • Orientation History Statistical model process Data sources Data Structure of panel data model Panel data model in R Interpretation of models parameter estimates Reporting
MORE TO EXPLORE!!! • R for Data Science, Grolemund and Wickham: http: //r 4 ds. had. co. nz/ • Practical Regression and Anova using R, Faraway: http: //cran. mtu. edu/doc/contrib/Faraway-PRA. pdf • Web Companion – Applied Regression: http: //socserv. socsci. mcmaster. ca/jfox/Books/Companion/ap pendix. html • Data cleaning in R: http: //cran. mtu. edu/doc/contrib/de_Jonge+van_der_Loo. Introduction_to_data_cleaning_with_R. pdf • Online: – http: //www. statmethods. net/index. html – Coursera: https: //www. coursera. org/
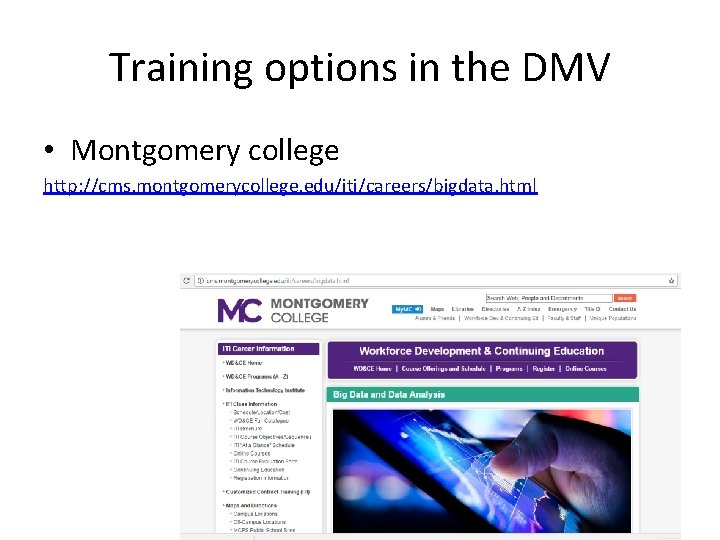
Training options in the DMV • Montgomery college http: //cms. montgomerycollege. edu/iti/careers/bigdata. html
Announcements • October 5 th Data Viz
Special Thanks Ani Katchova- Econometric Academy Sayed Hossain: Hossain Academy
- Slides: 45