Pairwise Sequence Alignment LESSON 3 1 Alignment l


 T H I S A S E Q U E")


")


 Substitution Matrix Pairs of amino")
 Substitution Matrix KAWSADV KDWSAEV 5+0+17+2+2+3+4 = 33 KAWSADV KYWSAEV 5 -3+17+2+2+3+4")

 matrix Dayhoff model : accepted point mutation Mutation probability Matrix")


 matrices blocks substitution matrix (BLOSUM) Blocks : conserved")


ﺑﺤﻜﻤﺔ Forcing two sequences to match up simply")


- Slides: 55
Pairwise Sequence Alignment LESSON 3 -1
Alignment l. Comparison of different DNA or protein sequences Ø Identifying regions of similarity Ø Functional, structural, or evolutionary relationships between the sequences. • key stage in the analysis of newly found sequences • Important part of bioinformatics
Why “Similarity”? Similar sequences Similar structure Similar function Function prediction
Similarity vs. Homology Similarity Homology Degree of match Evolutionary implication Quantifiable value Binary relationship ? % Homologous ? Non-homologous?
How similar must sequences be in order to be considered homologous? homologous >25 % of the amino acids present for proteins >70 % of the nucleotides present for DNA
2 types of Homology Orthologs Homologous sequences in different species Paralogs Homologous sequences within a single species
Pairwise Multiple
Pairwise Sequence Alignment The process of lining up two sequences to achieve maximal levels of identity. for the purpose of assessing the degree of similarity and the possibility of homology.
Alignment l Line up sequences! l To maximize their similarity T H I S S E Q U E N C E 10/12 = 83. 3% T H A T S E Q U E N C E
Line up sequences! To maximize their similarity T H I S A S E Q U E N C E │ │ T H A T S E Q U E N C E tions l Introduce gaps Posi : s p a G tte a le h c i h w at with a d e r i a r is p T H I S A - S E Q U E N C E T H - - A T S E Q U E N C E null
Percentage identity (% ID) T H I S A S E Q U E N C E │ │ T H A T S E Q U E N C E 4/15 = 27% T H I S A - S E Q U E N C E │ │ │ │││ │ T H - - A T S E Q U E N C E 11/16 = 69%
The quality of an alignment Is measured by giving it a quantitative score Optimal alignment -> Best score! The simplest way of quantifying similarity between two sequences Percentage identity (% ID)
Dotplot Visual assessment of similarity based on identity THISSEQUENCE THISISASEQUENCE
Dotplot The similarity appears in parallel diagonals. The parallel shifts indicate that there are gaps. Insertions/Deletions THIS---SEQUENCE THISISASEQUENCE
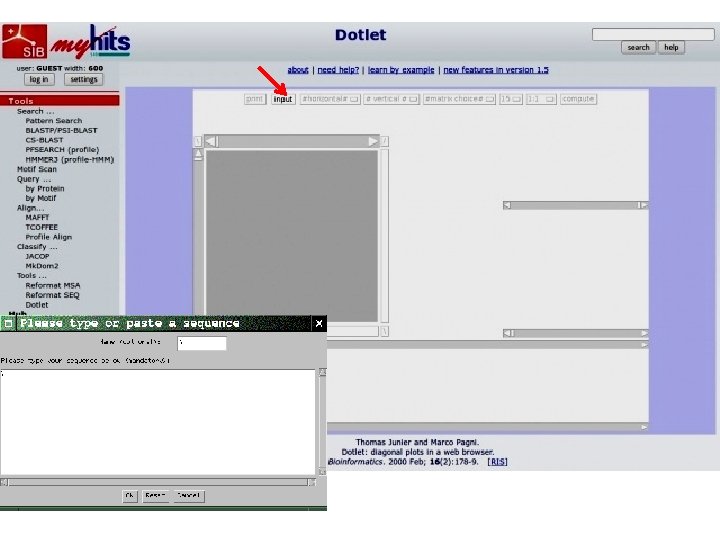
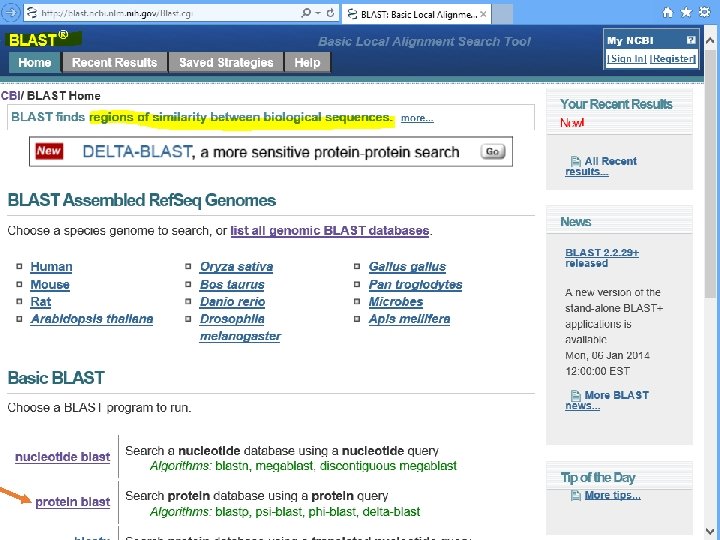
Dotlet • Dot-plot programs available over the internet • http: //myhits. isb-sib. ch/cgi-bin/dotlet • Java applet
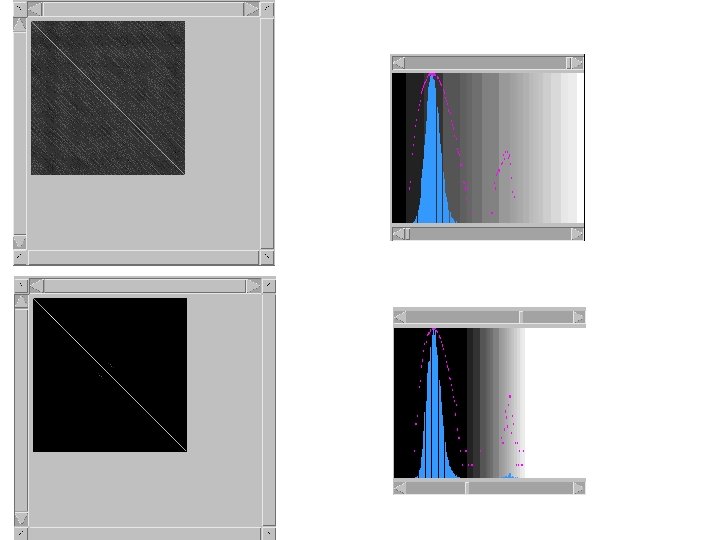
Filter Windows of 10 residue Minimum identity score of 3
Low-complexity regions e. g. Plasmodium falciparum serine-repeat antigen protein precursor
Plasmodium falciparum serine-repeat antigen protein precursor
Repeated protein domains e. g. Drosophila melanogaster SLIT protein
Drosophila melanogaster SLIT protein against itself
Conserved protein domains
Exons and introns
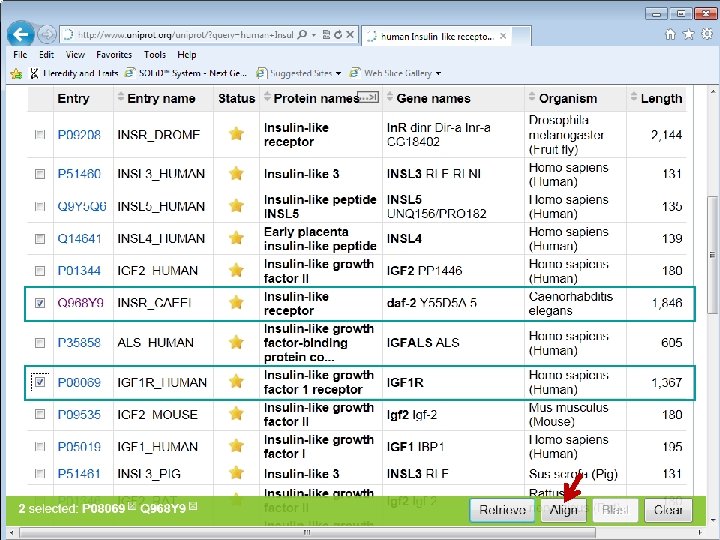
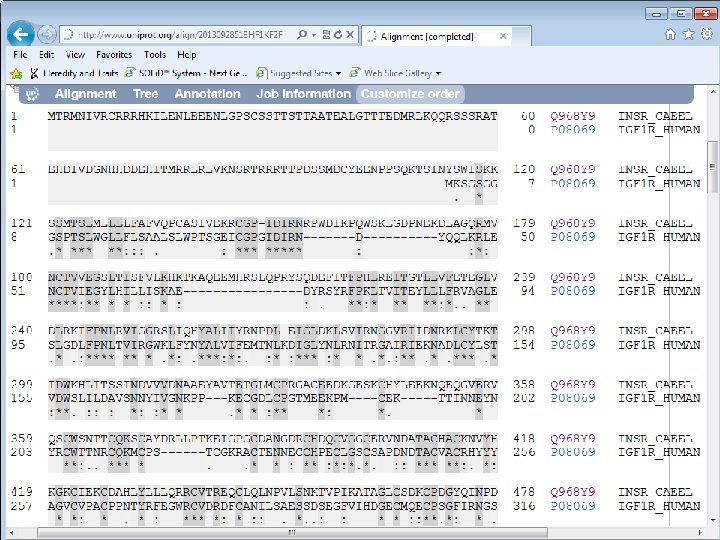
C. elegans Daf-2 human IGF 1 R
C. elegans Daf-2 Human IGF 1 R C. elegans Daf-2
Daf-2 IGF 1 R Identity or similarity (+)
Score from MATRIX
Scoring Matrix 1. Identity matrix 2. Substitution matrix PAM BLOSUM
How to use scoring matrices q Using the identity matrix (e. g. match=1 and mismatch=− 1) q Summing the value at all position KAWSADV KDWSAEV 1− 1+1+1+1− 1+1=3
Genuine matches do not have to be identical l Percentage identity is a crude and does not give a complete picture of the degree of similarity l. Certain amino acids resemble each other Ø substitute functionally for each other
Identical amino acids : highest score (BLOSUM 62) Substitution Matrix Pairs of amino acids with similar properties score more highly than those with quite different properties Pairs of cysteins(C) and tryptophans(W) : high value Important structure Disulfide bonds / hydrophobic core of protein KAWSADV KDWSAEV 5− 2+11+4+4+2+4 = 28
(PAM 250 matrix) Substitution Matrix KAWSADV KDWSAEV 5+0+17+2+2+3+4 = 33 KAWSADV KYWSAEV 5 -3+17+2+2+3+4 = 30
Substitution Matrices constructed by assembling a large and diverse sample of verified alignments of amino acids. values proportional to the probability of mutations PAM BLOSUM
PAM (percentage accepted mutations) matrix Dayhoff model : accepted point mutation Mutation probability Matrix how often a given amino acid is exchanged for another in already aligned similar sequences. “PAM N” matrix : N substitutions per hundred residues. PAM 0 PAM 1 the proteins have undergone 1% change (= 1 point mutation per 100 amino acid residues).
Dayhoff’s PAM 1 mutation probability matrix Each element of the matrix shows the probability that an original amino acid (top) will be replaced by another amino acid (side)
PAM matrix “PAM N” matrix : N substitutions per hundred residues. PAM 0 PAM 1 : the proteins have undergone 1% change (= 1 point mutation per 100 amino acid residues). PAM 100? PAM 250? Multiplied the PAM 1 matrix by itself 250 times.
PAM 250 mutation probability matrix
Mutation Probability Matrix → Log-Odds Scoring Matrix Logarithms are easier to use for a scoring system. sum the scores of aligned residues (rather than having to multiply them). The score S for an alignment of residues i, j ← probability of aligning j with i ← likelihood of i by chance for tryptophan, S(trp, trp) =
Normalized frequencies of amino acids Gly Ala Leu Lys Ser Val Thr Pro Glu Asp 8. 9% 8. 7% 8. 5% 8. 1% 7. 0% 6. 5% 5. 8% 5. 1% 5. 0% 4. 7% Arg Asn Phe Gln Ile His Cys Tyr Met Trp (These frequencies sum to 1) 4. 1% 4. 0% 3. 8% 3. 7% 3. 4% 3. 3% 3. 0% 1. 5% 1. 0%
Mutation Probability Matrix → Log-Odds Scoring Matrix Logarithms are easier to use for a scoring system. sum the scores of aligned residues (rather than having to multiply them). The score S for an alignment of residues i, j ← probability of aligning j with i for tryptophan, ← likelihood of i by chance (background probability) S(trp, trp) = 10 log (0. 55/0. 010) = 17. 4
PAM 250 Log Odds Scoring Matrix
Substitution Matrices percentage accepted mutations (PAM) matrices blocks substitution matrix (BLOSUM) Blocks : conserved regions “BLOSUM N” matrix Sequences are clustered together if they have ≥ N% identity. BLOSUM 62, in the case where N = 62%. BLOSUM 80?
Choice of Substitution Matrices depends on the problem. ü BLOSUM matrices with higher numbers and PAM matrices with low numbers are designed for comparisons of closely related sequences. q The PAM matrix number indicates evolutionary distance q The BLOSUM matrix number refers to percentage identity
Calculation of an alignment score
Gaps Must be introduced judiciously ( )ﺑﺤﻜﻤﺔ Forcing two sequences to match up simply by inserting large numbers of gaps will not reflect reality and will produce meaningless alignment The best alignment is The maximum score for the smallest number of gaps. Limit! Gap scores are typically negative.
Gap penalty Gap scores are typically negative. Each time a gap is introduced, the penalty is subtracted. T H I S A - S E Q E N C E T H - - A T S E Q E N C E 5 8 -2 -2 4 5 5 5 6 9 5 46 36
• High gap penalty setting • 10 % identity • Low gap penalty setting • 18 % identity
Gap penalty Gap scores are typically negative. Since a single mutational event may cause the insertion or deletion of more than one residue, the presence of a gap is ascribed more significance than the length of the gap. separate penalties for gap creation and gap extension.
First gap position scores -11 Second gap position scores -1 Gap creation tends to have a large negative score; Gap extension involves a small penalty