PAINTING THE FULL PICTURE COMBINED ASSURANCE INTEGRATING THE

PAINTING THE FULL PICTURE COMBINED ASSURANCE INTEGRATING THE DIFFERENT ROLE PLAYERS

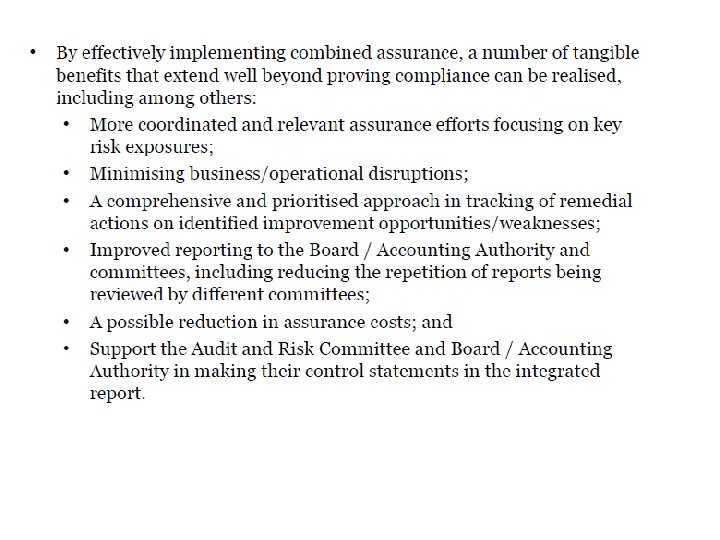
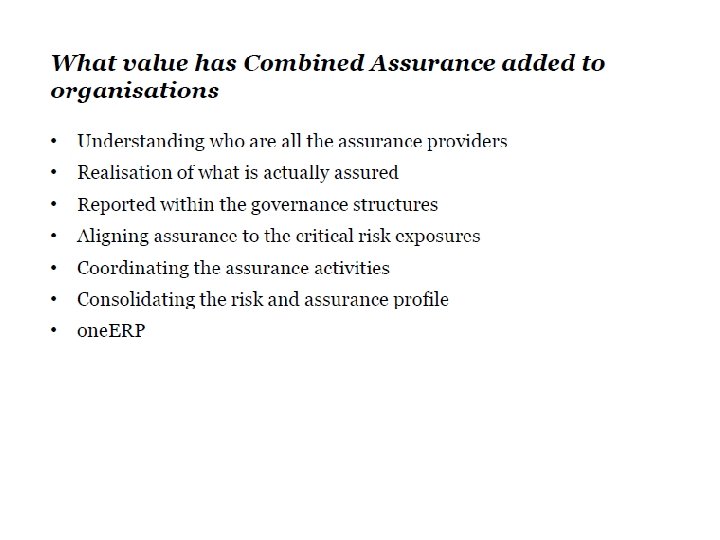
Cost Benefit Analysis Benefits § § § Increased executive management and audit committee confidence Enhanced control environment, awareness and discipline Improved Audit Committee oversight Increased knowledge of internal business processes Identification of improvement opportunities in both controls and processes Fewer control failure embarrassments Increased comfort for senior management Better quality audits (internal and external) Formalisation of processes and controls Increased awareness of internal controls at various levels within the business End to end process ownership and accountability

Our Approach Today!!! • • • Effectiveness on current assurance Designing a model Achieving the Goal Strengths to build on What can we improve upon? Linking Assurance to performance

No surprises!!! • • • SAA Guptagate State capturing Escom KPMG

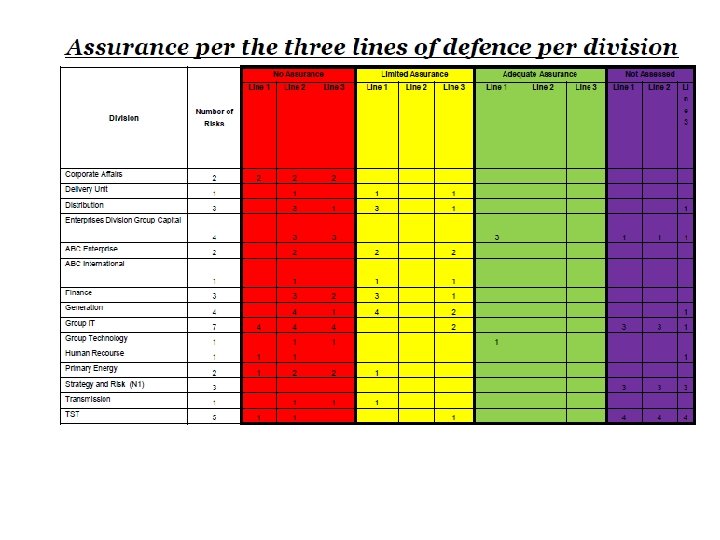
Key Objectives of the Framework Optimise Assurance Coverage Systematic assessment of Key risks associated with strategic objectives Support the audit committee in assessing the effectiveness of internal financial control Provide context of the impact of inadequate and ineffective control Coordinating the efforts of management, internal and external assurance providers Extent to which risks have been fully identified and responded to based on an organisation or Departments objective Assurance to the executive authority or board in making their statements on internal control in the integrated report. Quantitative and qualitative impact of control breakdown on the overall control environment.

Corporate Governance Framework Internal Audit’s journey COMBINED ASSURANCE RISK MANAGEMENT SOCIAL & ETHICAL FINANCIAL INTEGRATED REPORT CONDUCT PEOPLE SYSTEMS PROCESS POLICY STRUCTURE INTERNAL CONTROLS ACCOUNTABILITY OPERATIONS ETHICS CORPORATE CULTURE ENVIRONMENTAL LEGAL REGULATORY COMPLIANCE REQUIREMENTS AUTHORITIES STRATEGY PURPOSE VALUES GOALS PERFORMANCE MEASUREMENT

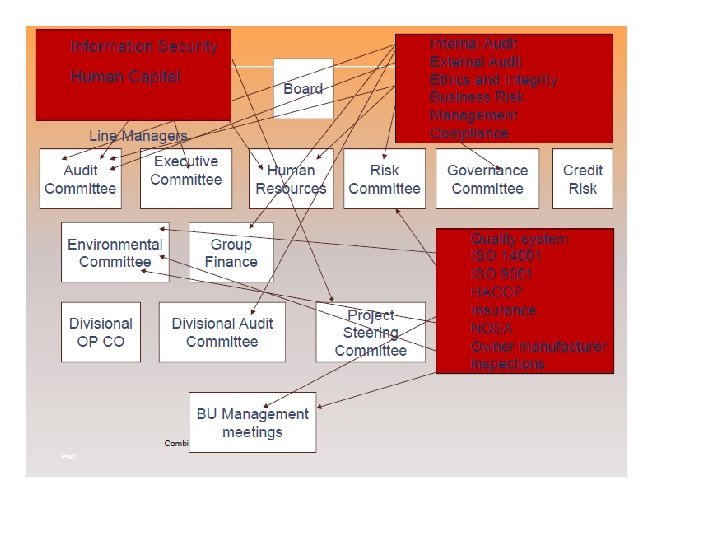
Effectiveness of Assurance Legal and Governance Council and the Audit Committee EXCO Stakeholder Com Treasury Risk Com CFO BRANCH MAN CO – E. G Budget Project Com Right Forum? Right Information? Repetition? Too much Information?

Risk universe Integrated Risk intelligent Fragmented • Effective application of the combined assurance model is reliant on an accurate population of the risk universe. To make sure that a municipality does not miss any potential risks in its structured process of risk identification, assessment, and reporting, it is important that a so-called risk universe with an exhaustive list of risk categories, as far as possible, is drafted. • Several risk universe models are available. The following risk universe is an example of a risk universe for the public sector. It can be adopted to accommodate the unique environment of individual municipalities. The example is tailored towards the integrated and risk intelligent municipalities.

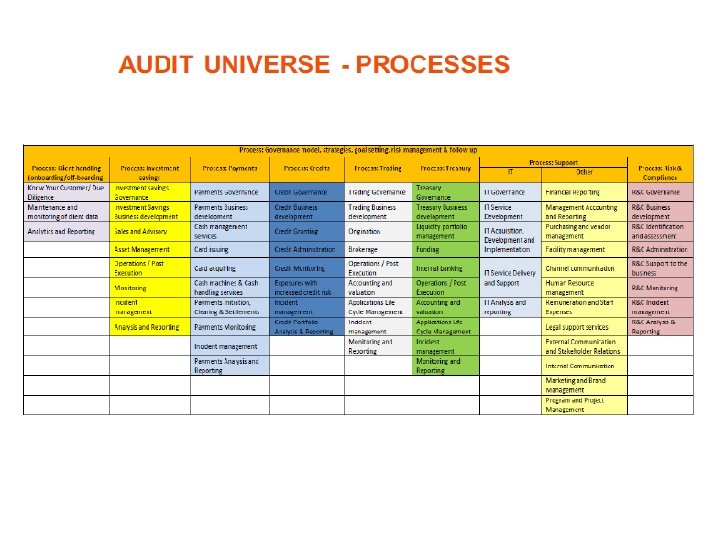
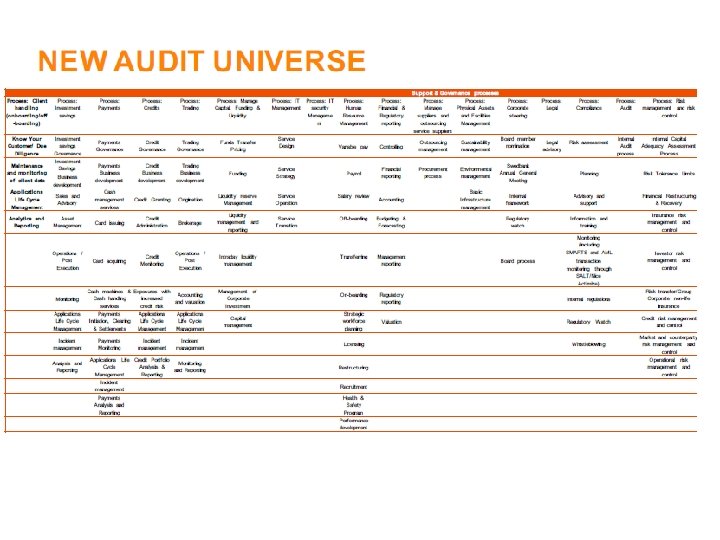
Audit Universe Legislature Provider of Voted funds Providers of other funds Other departments Customer Supplier Stakeholder Competitor Executive Authority Deliverables Legislative Auditor Rian v Niekerk Support Processes Production & Delivery Legislative & Regulatory Budget process New programs/objectives Ethics Economic Reputation Transaction Governance Service Delivery Current programs/objective s Process Other Tangibles Learning Organisation Plant, Property & Estate Human Resources Physical Asset Strategic People & Culture Contract Liability Legal Operations Public Sector Risk Universe Financial Accounting Suspense accounts Financial information Changes to acc. basis Liquidity Requisition of funds Cash Management Revenue fund Cheques and Electronic payments Knowledge Reporting Appropriation Accounting framework Regulatory & Compliance Budget Equitable share Grants Systems Hardware Software Networks Information Management Non financial Reporting Planning & Development Executive Authority Operations Organisation & Monitoring Provincial Treasury Legislature

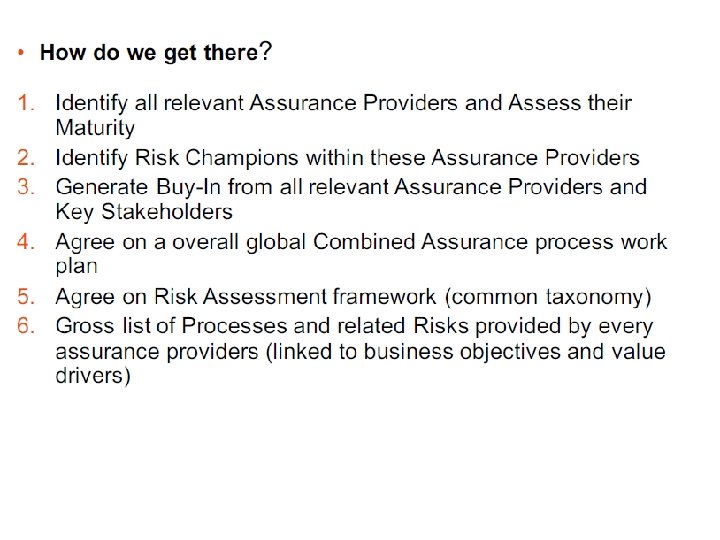
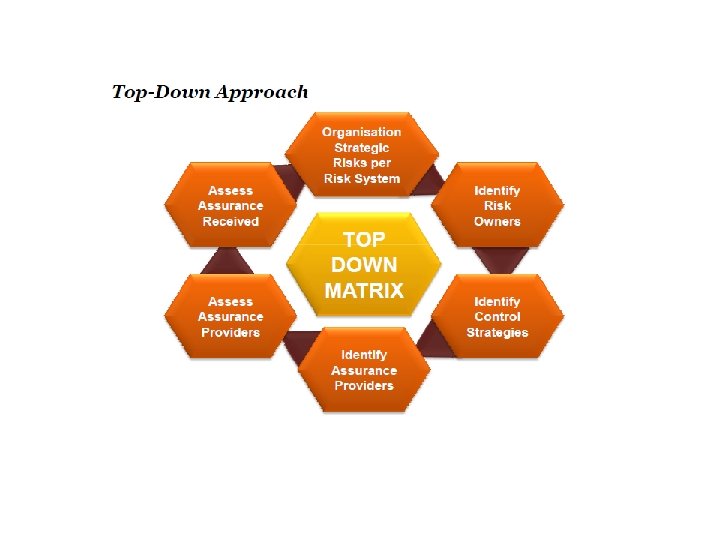
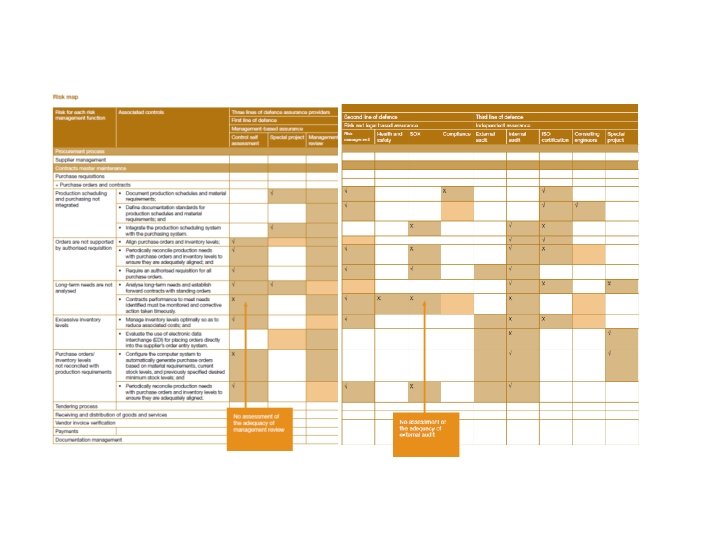
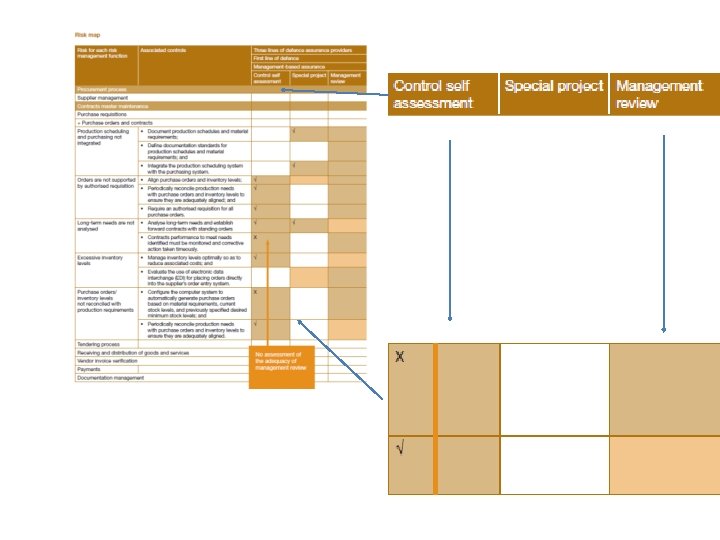
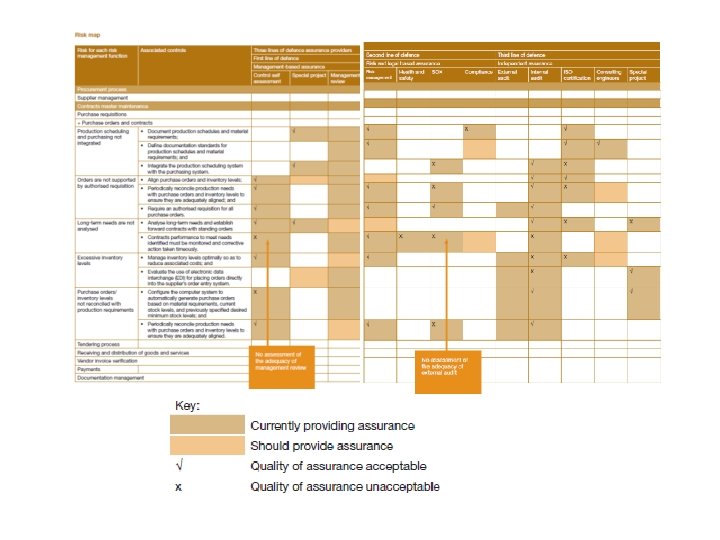
DESIGNING A MODEL Universe Identify key risk Identify who provides what on which risks? Analyse the different roles and quality of assurance and GAPS What assurance to be provided – and by whom? Agree on a common universe and acceptable methodology to ensure credibility

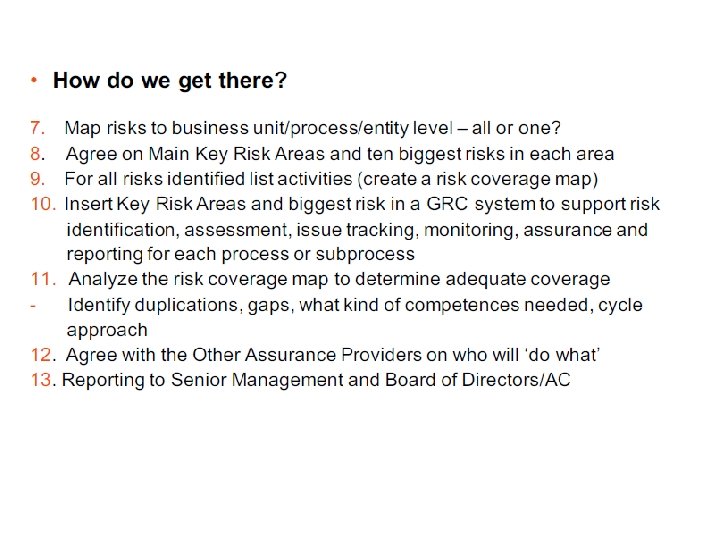
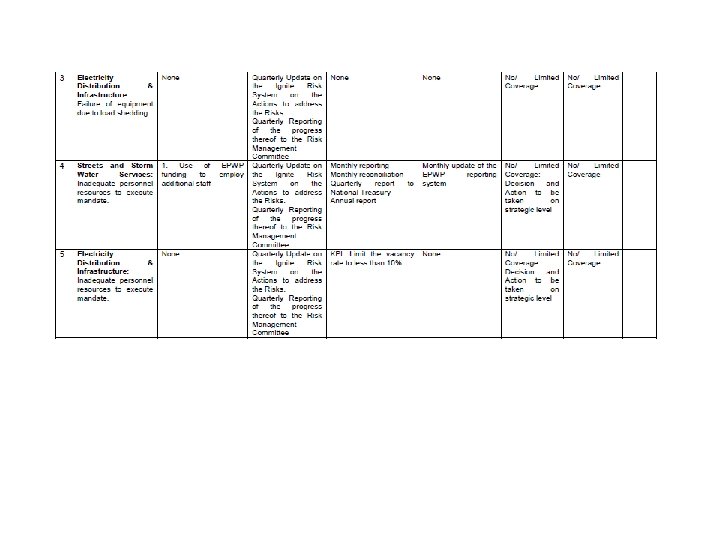
BLUE PRINT Who is the risk champion? Who in this scenario can present to top management? BLUE PRINT = Risks coverage, per assurance provider to the right governance structure National Treasury Model

Questions to ponder? – achieving the goal �Develop a combined assurance framework �Align the existing governance model to leading practice

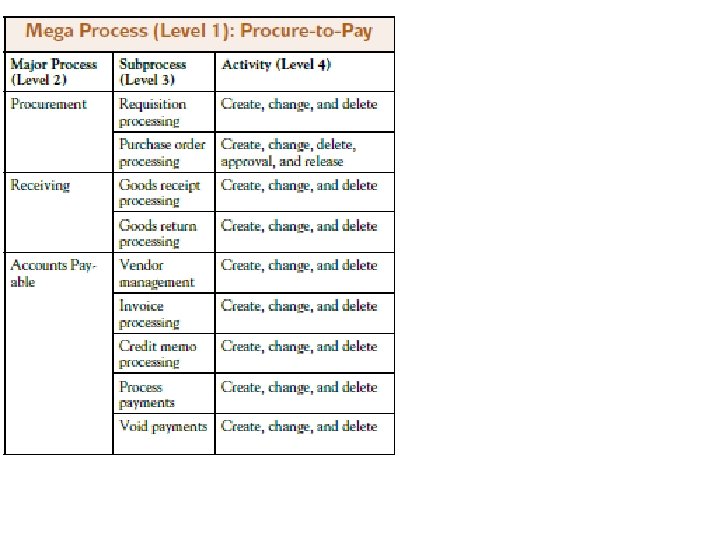
Top business risks Assurance providers Combined Key control assurance activities matrix Key assurance activities Key control activities

Top business risks �Assess the effectiveness of the risk management framework and processes and enhance risk governance, infrastructure and ownership (risk governance, risk framework and methodologies, risk appetite and tolerance, risk assessments, risk mitigation and control remediation)

Pre requisite for combined assurance • Effective risk management capacity

Level of maturity • Assurance provider – delivering objective assurance of the effectiveness of governance, risk and internal control system. • Problem solver – analysis of root causes of findings and making recommendations to correct the findings. • Insight generator – pro-active role in making recommendations and risk assurance. • Trusted advisor – providing pro-active advice of strategic importance well beyond the execution of assurance activities.

Risk maturity assessment – P 38

Rating – P 40

Top business risks �Identify key risks across the business


Key control activities �Integrating and aligning the Internal controls framework in an organisation �Assess the design, implementation and effectiveness of entity level controls �Document processes and assess the design and implementation of key controls �Test the effectiveness of key controls

Minimum tools in the toolbox • Lean six sigma • Root cause expert – 5 why’s – Fishbone diagram – Pareto analysis • Data mining • IT auditing skills • Boardroom presence

Lean Six Sigma Is the Integration of Two Powerful Business Improvement Approaches. . . Lean Six Sigma Speed + Waste Elimination Quality, Cost • Goal – Improve performance on items Critical to Customer Quality (CTQs) • Focus – Use DMAIC with (TQM) tools to eliminate variation • Method – Management engagement, dedicated team effort • Goal – Reduce waste and increase process speed • Focus – Implementing Waste reduction tools • Method – Improvement events Value Stream Mapping Lean Speed Enables Six Sigma Quality (Faster Cycles of Experimentation/learning) Six Sigma Quality Enables Lean Speed (Fewer Defects Means Less Time Spent on Rework) Efficiency Root Cause Analysis 49 Effectiveness

Sample Pareto Chart: Processing Errors 50

Example: Fishbone Diagram Material Machine Method s Computer screens Updates Product Shortages Power Failures Discovery of different discount rates occurs too late in process Billing process not accurate Too many “jumps” Master customer discount table not up-todate Management Policies Incomplete Training on common complaints Marketing metrics counterproductiv e Mother Measurement Nature Root Cause Analysis s Manpow er 51 Effect: Too many price adjustments at check-out Not enough staffing during peak times Unfamiliarity with procedures For vacation notification Notification of absence

Root Cause Analysis Ask "Why? " 5 Times Effect Computer Storage Costs Too High 1. Why? Users keep too many large files as email attachments 2. Why? Users don’t know that this results in an extra charge to the company 3. Why? Email policy not communicated 4. Why? Official email policy not defined _______ 1. Why? 2. Why? 3. Why? 4. Why? 5. Why? 5. Etc…. 52 Root Cause Analysis

Four legs of the table • • Process effectiveness People Risk coverage Value

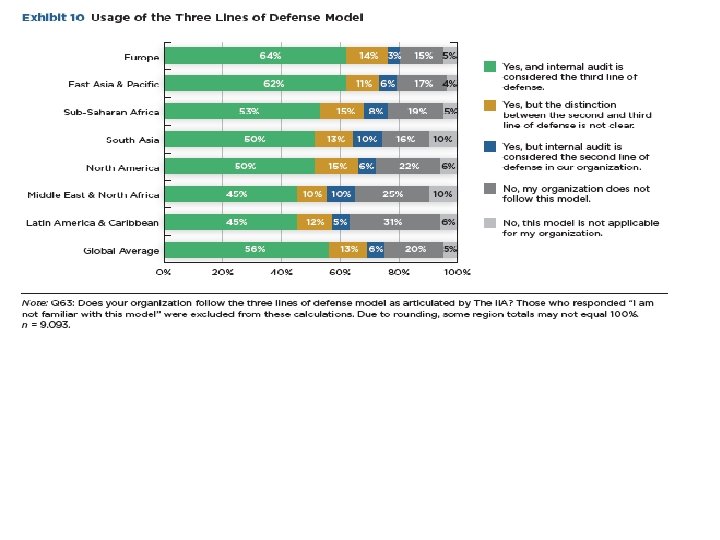
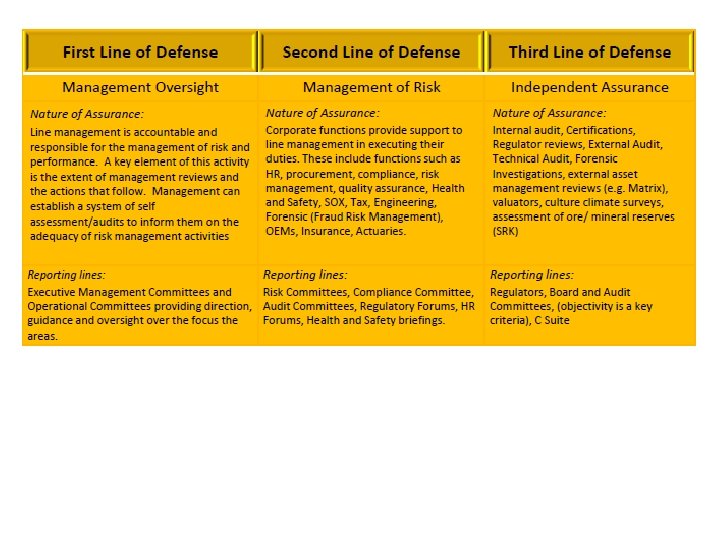
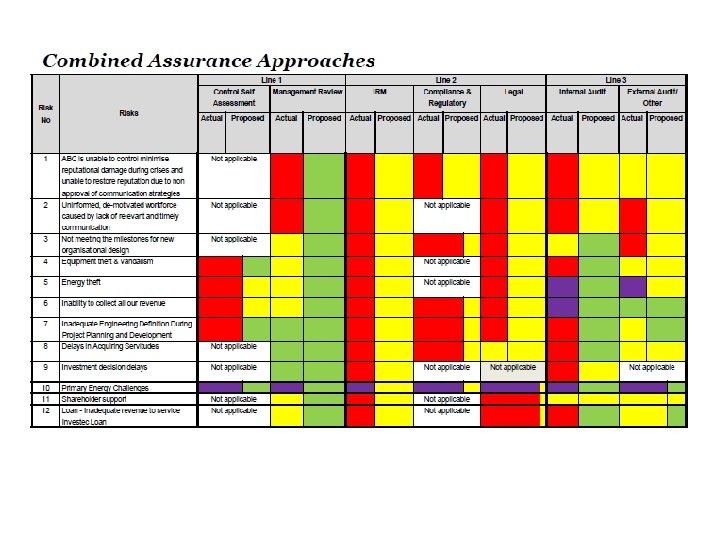
Strengths to build on � A combined assurance approach is mostly already in place – to an extent – which is a good starting point. The approach typically requires some further tweaking and embedding into the day to day business activities. � A three lines of defence assurance model is typically already established, where the first, second and third line assurance providers are already involved in the business with their roles being fairly mature (except perhaps for the management self-assessments). � An ERM framework is mostly already in place. This integrates the business objectives with business processes and key risks. � A Financial control framework and IT governance is often already in place, however not tied into the ERM and expanded to also cover nonfinancial controls, and not necessarily integrated

Assurance providers �Assess the overall effectiveness of assurance providers including External audit, Internal Audit �Regulatory compliance, and Risk management (role, position, people, processes, and performance)

Developing a rolling audit plan APPROACH § Identify the main drivers of your plan Strategy § Identify and ensure access to key sources of information Business Strategic review / update performance Board papers Committee papers e. g. Risk Attendance at meetings Investment & project proposals Project update reports / steer co. minutes Stakeholders • Regular scheduled meetings with key stakeholders e. g. Audit Co Chair; CEO; FD • Performance reports (e. g. monthly management accounts) • • • Risk analysis Change management

Developing a rolling audit plan cont. Structure Category § Establish and agree a clear ‘cascade’ of priorities which fits your organisation • Change management support & reviews § Populate quarter by quarter § Clear focus on the current quarter § Planning should be ‘thinner’ as you move further along the time horizon IIA Seminar April, 2014 • Investigations and special projects • Thematic reviews • Process reviews • Cyclical audits • Ad hoc advice and support

Process effectiveness - Deliver quality outputs Budget over time Cost effectiveness of IA Findings by status % of audits where tools were provided to the business (dashboard, data analytics) Audit ratings Time from fieldwork to report Staff utilization – direct vs. indirect time. Completed audits per auditor % audit findings remediated before final report % of audits using data analytics to drive scoping decisions – efficiency

People - Build capability and efficient capacity % staff – professional qualifications Alignment of talent to enterprise risks/ leverage of subject matter experts % IT versus non-IT staff Cost per audit hour Staff turnover Number of coaching sessions in a year. Number of staff rotations in and out of the internal audit activity. Average years of audit experience. Aligning scope and audit plan to management expectations. Promoting quality improvement and innovation Time cycle for drafting the annual audit plan Number of best practices identified communicated within an organization

Risk coverage - Align expectations to boardroom presence level % audits aligned to critical strategic, operational, financial and compliance risks % non-IT vs IT audits completed Assurance on risk management process and visual alignment if risks to audit plan and scope Level of focus on emerging risks and promotion of fraud awareness and risks Use and reliance of combined assurance and the three lines of defense. Number of control self assessment (CSA) sessions conducted. Applying that knowledge to help solve complex client issues. Development of deep industry knowledge. Developing and contributing best practices, emerging issues, and industry trends.

Value - Improve impact and value, boardroom presence % audit coverage within time and budget Business process improvement by IA, including growth initiatives and bottom line % audits completed utilizing data analytics Client satisfaction results Level of management requests to assist with issues of strategic importance, raising capital, tax strategies, continuous auditing Stakeholder assessment versus expectations Training sessions focus on governance, risk and control. Assessment of tone at the top, ethics and culture Percentage of identified risks audited Value added audits – benefit versus cost of audit

Resource planning • • • Survey of Heads of Internal Audit highlights a broad range of qualifications and practical experience amongst internal auditors. Despite this, nearly 60% of all internal audit departments bring in additional resources to complete their internal audit plans. The key areas where additional skills are required were: • • • Information Technology: 36% Taxation: 19% Finance: 15% Health and Safety: 11% Major Projects: 11% Business Continuity: 7% Telecoms: 5% Governance: 4% Third Party Activities: 2%

Sources of additional resources • Purchased from specialist service providers: • • 30% Co-sourcing with third party: Independent experts from within the business: 15% Secondment from a third party: 6% From other source: 30% 6%
 •")
Outsourced service provider skills • Industry knowledge and functional expertise (strategic operational knowledge) • Cross-culture training for global IA functions • Improved interpersonal skills to allow for effective communication not only with process owners/line managers but also with C-level executives • ERM – risk management and evaluation • Continuous auditing capabilities • Fraud skills • IT – automation of internal control environment • Specific certifications – Six Sigma, CFE, CFA, CIA, CFSA, CISA, and others should be considered in augmenting internal audit staff

Gap analysis • Review the results of your skills analysis to highlight any gaps. • Perform an assessment of the gaps and identify any actions you wish to take. • May choose not to action some of the gaps – accept the risk or provide partial assurance etc. • Look at your own organisation first: • • • Skill up your existing team? Recruit to fill any gaps? Use Secondments from the business? Graduates? Use of networks? Internal Specialists: language skills / cultural knowledge in specific geographical locations?

Linking Assurance to performance �Golden thread between strategy, risks, control and performance �Risk control – relationship �What are the risks to and of the strategy? � How do we control/manage those risks? � Effective risk management = a better chance of achieving objectives. � Achieving Objectives (EEE) = Performance Providing Po. E is only 1 measure of success.
 Key measurable objectives")
Governance process Risk Objective Process Exception reports Laws/regs Strategic/operational Plans (SMART/CQQT) Key measurable objectives and indicators Management info Performance measurement Capability – finance 08/03/2021& human Responsibility/ accountability Performance agreements/ Job descriptions 70

Inherent Risk – risk of not achieving objectives Risk Strategic risk Objective Process Inherent risk – before the assessment of any controls 08/03/2021 71

Control to minimize risks Risk Inherent risk Objective Residual risk Process Control Residual risk – after the assessment of any controls 08/03/2021 72
 08/03/2021 73")
Indicators of Economy, Efficiency, Effectiveness and Equity (FMPPI – p 7) 08/03/2021 73

�Develop the overall assurance and related materiality framework and approach for Internal Audit in supporting it’s overall level of assurance to the Audit Committee �Support Internal Audit in assessing the level of assurance in its written assessment to the Audit Committee
- Slides: 79