PAD MONITOR The TPC pad monitor is used
- Slides: 11

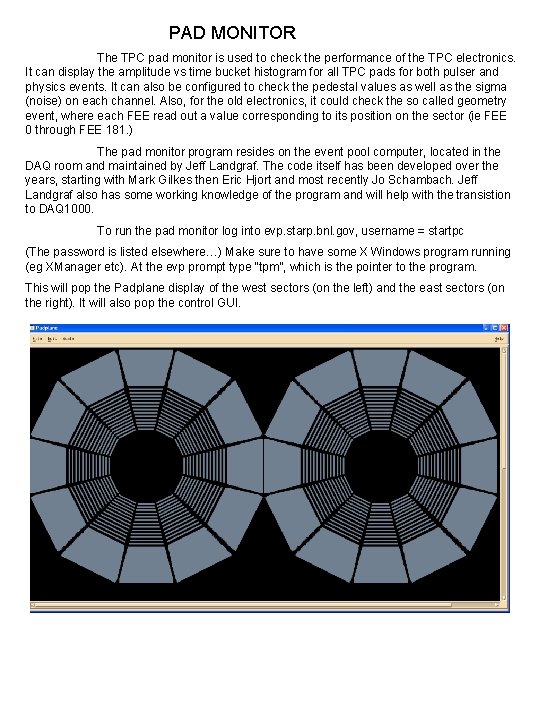
PAD MONITOR The TPC pad monitor is used to check the performance of the TPC electronics. It can display the amplitude vs time bucket histogram for all TPC pads for both pulser and physics events. It can also be configured to check the pedestal values as well as the sigma (noise) on each channel. Also, for the old electronics, it could check the so called geometry event, where each FEE read out a value corresponding to its position on the sector (ie FEE 0 through FEE 181. ) The pad monitor program resides on the event pool computer, located in the DAQ room and maintained by Jeff Landgraf. The code itself has been developed over the years, starting with Mark Gilkes then Eric Hjort and most recently Jo Schambach. Jeff Landgraf also has some working knowledge of the program and will help with the transistion to DAQ 1000. To run the pad monitor log into evp. starp. bnl. gov, username = startpc (The password is listed elsewhere…) Make sure to have some X Windows program running (eg XManager etc). At the evp prompt type “tpm”, which is the pointer to the program. This will pop the Padplane display of the west sectors (on the left) and the east sectors (on the right). It will also pop the control GUI.

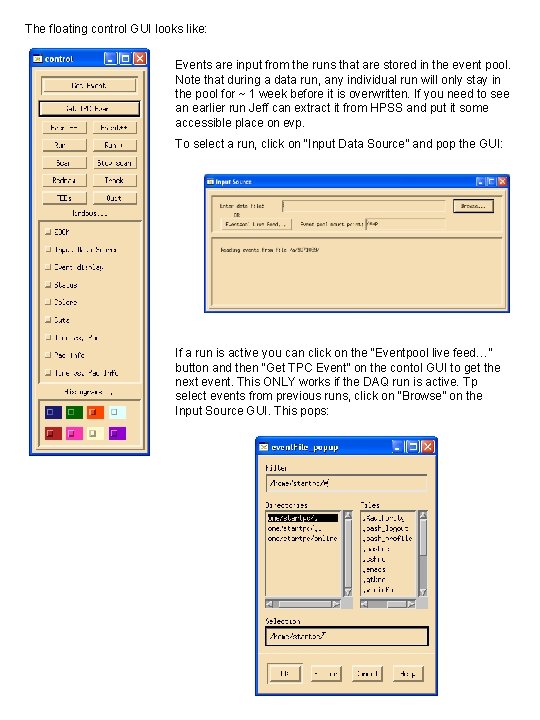
The floating control GUI looks like: Events are input from the runs that are stored in the event pool. Note that during a data run, any individual run will only stay in the pool for ~ 1 week before it is overwritten. If you need to see an earlier run Jeff can extract it from HPSS and put it some accessible place on evp. To select a run, click on “Input Data Source” and pop the GUI: If a run is active you can click on the “Eventpool live feed…” button and then “Get TPC Event” on the contol GUI to get the next event. This ONLY works if the DAQ run is active. Tp select events from previous runs, click on “Browse” on the Input Source GUI. This pops:

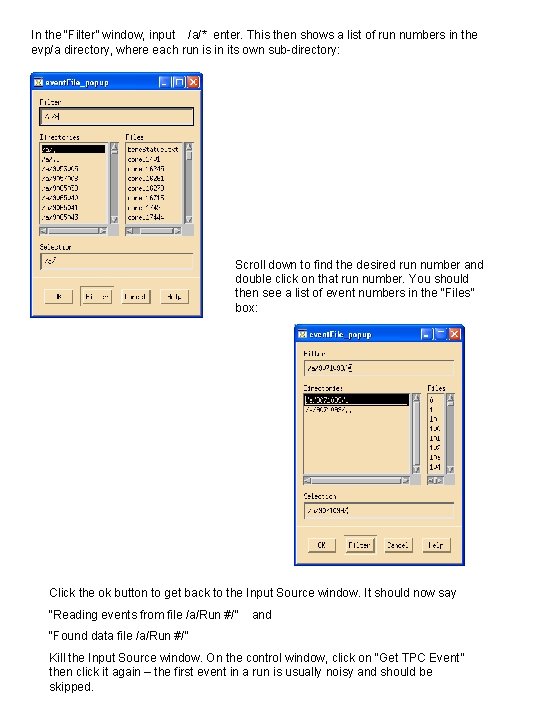
In the “Filter” window, input /a/* enter. This then shows a list of run numbers in the evp/a directory, where each run is in its own sub-directory: Scroll down to find the desired run number and double click on that run number. You should then see a list of event numbers in the “Files” box: Click the ok button to get back to the Input Source window. It should now say “Reading events from file /a/Run #/” and “Found data file /a/Run #/” Kill the Input Source window. On the control window, click on “Get TPC Event” then click it again – the first event in a run is usually noisy and should be skipped.

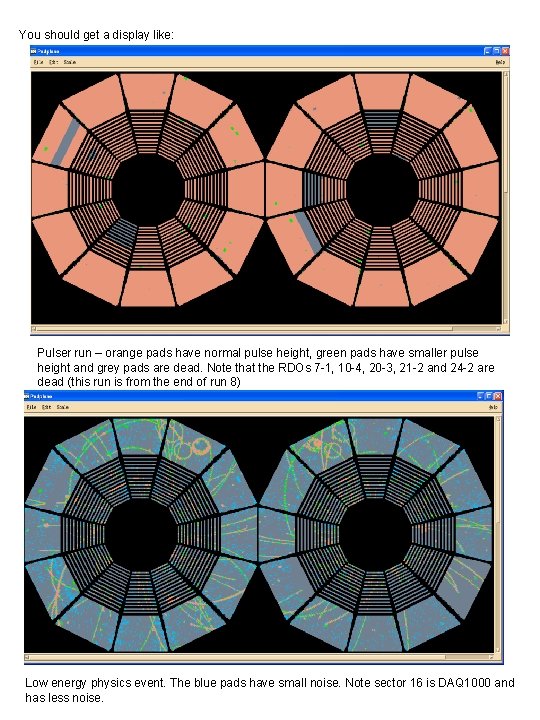
You should get a display like: Pulser run – orange pads have normal pulse height, green pads have smaller pulse height and grey pads are dead. Note that the RDOs 7 -1, 10 -4, 20 -3, 21 -2 and 24 -2 are dead (this run is from the end of run 8) Low energy physics event. The blue pads have small noise. Note sector 16 is DAQ 1000 and has less noise.

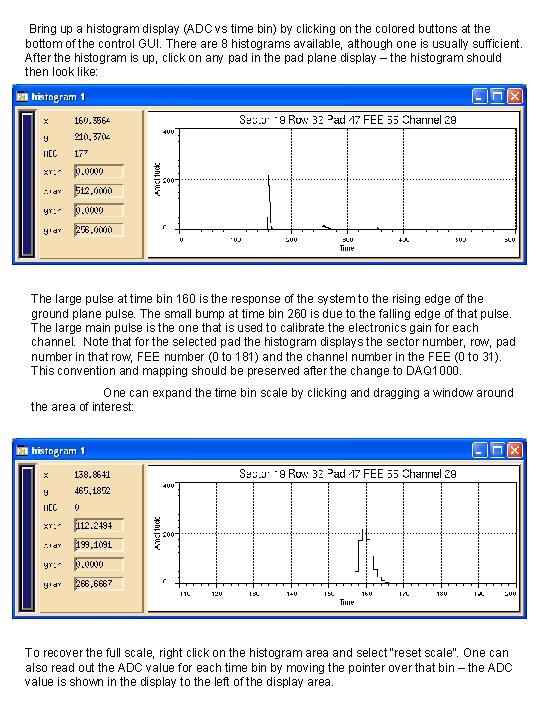
Bring up a histogram display (ADC vs time bin) by clicking on the colored buttons at the bottom of the control GUI. There are 8 histograms available, although one is usually sufficient. After the histogram is up, click on any pad in the pad plane display – the histogram should then look like: The large pulse at time bin 160 is the response of the system to the rising edge of the ground plane pulse. The small bump at time bin 260 is due to the falling edge of that pulse. The large main pulse is the one that is used to calibrate the electronics gain for each channel. Note that for the selected pad the histogram displays the sector number, row, pad number in that row, FEE number (0 to 181) and the channel number in the FEE (0 to 31). This convention and mapping should be preserved after the change to DAQ 1000. One can expand the time bin scale by clicking and dragging a window around the area of interest: To recover the full scale, right click on the histogram area and select “reset scale”. One can also read out the ADC value for each time bin by moving the pointer over that bin – the ADC value is shown in the display to the left of the display area.

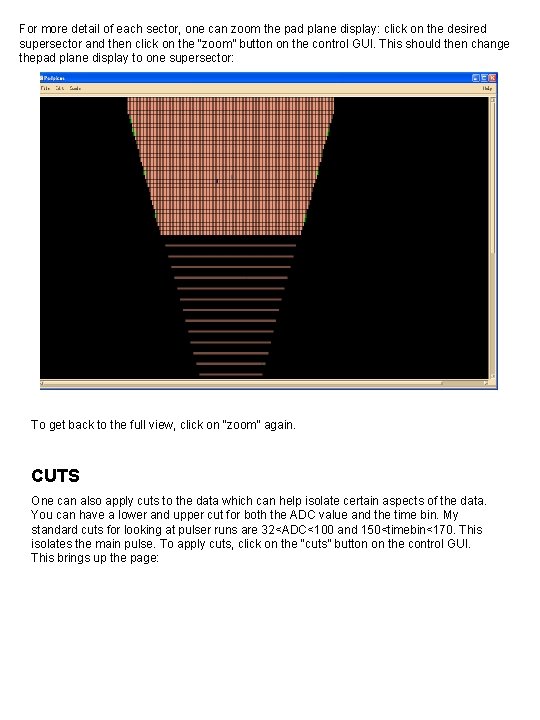
For more detail of each sector, one can zoom the pad plane display: click on the desired supersector and then click on the “zoom” button on the control GUI. This should then change thepad plane display to one supersector: To get back to the full view, click on “zoom” again. CUTS One can also apply cuts to the data which can help isolate certain aspects of the data. You can have a lower and upper cut for both the ADC value and the time bin. My standard cuts for looking at pulser runs are 32<ADC<100 and 150<timebin<170. This isolates the main pulse. To apply cuts, click on the “cuts” button on the control GUI. This brings up the page:

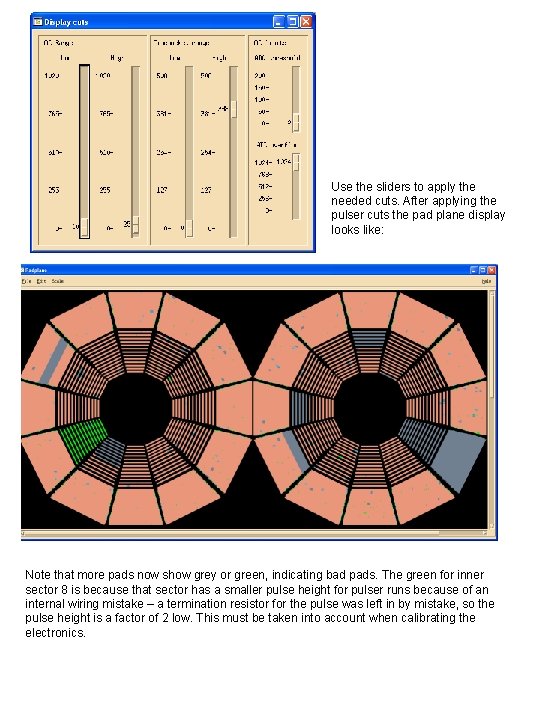
Use the sliders to apply the needed cuts. After applying the pulser cuts the pad plane display looks like: Note that more pads now show grey or green, indicating bad pads. The green for inner sector 8 is because that sector has a smaller pulse height for pulser runs because of an internal wiring mistake – a termination resistor for the pulse was left in by mistake, so the pulse height is a factor of 2 low. This must be taken into account when calibrating the electronics.

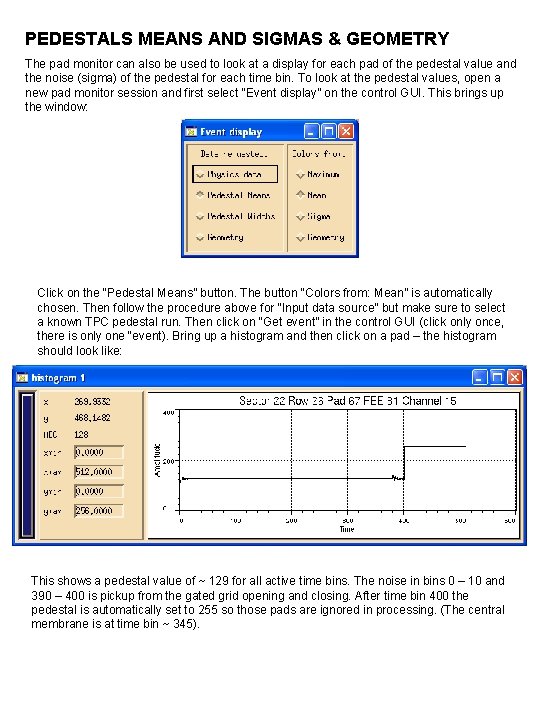
PEDESTALS MEANS AND SIGMAS & GEOMETRY The pad monitor can also be used to look at a display for each pad of the pedestal value and the noise (sigma) of the pedestal for each time bin. To look at the pedestal values, open a new pad monitor session and first select “Event display” on the control GUI. This brings up the window: Click on the “Pedestal Means” button. The button “Colors from: Mean” is automatically chosen. Then follow the procedure above for “Input data source” but make sure to select a known TPC pedestal run. Then click on “Get event” in the control GUI (click only once, there is only one “event). Bring up a histogram and then click on a pad – the histogram should look like: This shows a pedestal value of ~ 129 for all active time bins. The noise in bins 0 – 10 and 390 – 400 is pickup from the gated grid opening and closing. After time bin 400 the pedestal is automatically set to 255 so those pads are ignored in processing. (The central membrane is at time bin ~ 345).

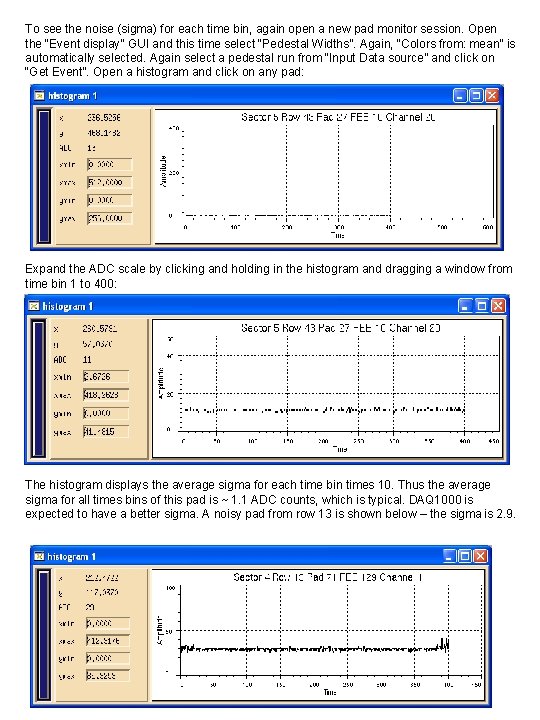
To see the noise (sigma) for each time bin, again open a new pad monitor session. Open the “Event display” GUI and this time select “Pedestal Widths”. Again, “Colors from: mean” is automatically selected. Again select a pedestal run from “Input Data source” and click on “Get Event”. Open a histogram and click on any pad: Expand the ADC scale by clicking and holding in the histogram and dragging a window from time bin 1 to 400: The histogram displays the average sigma for each time bin times 10. Thus the average sigma for all times bins of this pad is ~ 1. 1 ADC counts, which is typical. DAQ 1000 is expected to have a better sigma. A noisy pad from row 13 is shown below – the sigma is 2. 9.

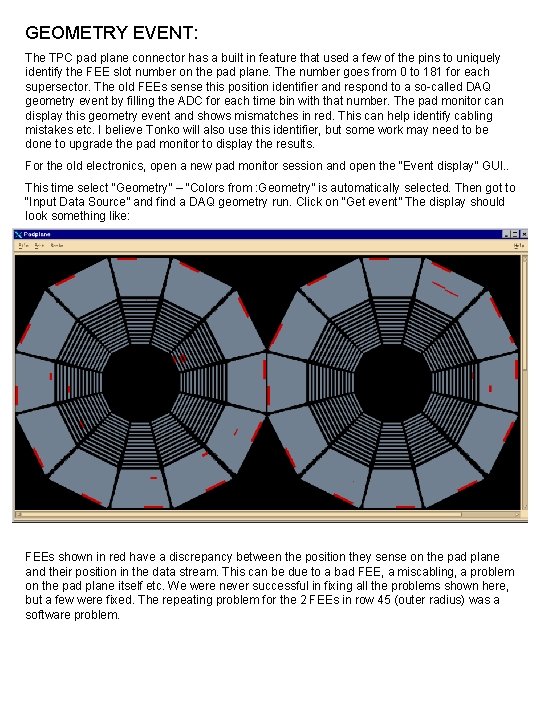
GEOMETRY EVENT: The TPC pad plane connector has a built in feature that used a few of the pins to uniquely identify the FEE slot number on the pad plane. The number goes from 0 to 181 for each supersector. The old FEEs sense this position identifier and respond to a so-called DAQ geometry event by filling the ADC for each time bin with that number. The pad monitor can display this geometry event and shows mismatches in red. This can help identify cabling mistakes etc. I believe Tonko will also use this identifier, but some work may need to be done to upgrade the pad monitor to display the results. For the old electronics, open a new pad monitor session and open the “Event display” GUI. . This time select “Geometry” – “Colors from : Geometry” is automatically selected. Then got to “Input Data Source” and find a DAQ geometry run. Click on “Get event” The display should look something like: FEEs shown in red have a discrepancy between the position they sense on the pad plane and their position in the data stream. This can be due to a bad FEE, a miscabling, a problem on the pad plane itself etc. We were never successful in fixing all the problems shown here, but a few were fixed. The repeating problem for the 2 FEEs in row 45 (outer radius) was a software problem.

PADPLANE MAPPING The mapping from the pad plane to the FEEs and then to the RDOs is documented on the web in the STAR TPC Hardware pages. The pad plane to FEE mapping will stay the same for DAQ 1000 but the FEE to RDO mapping may change, so a new document may be needed. There is also a full size drawing of the inner and outer pad planes showing each connector in detail (pin by pin). These drawings are kept in Dan Padrazo’s lab. For the other maps see: http: //www. star. bnl. gov/public/tpc. html And follow the links: Hardware -> Electronics -> Various maps in the Cabling section.