Pacific Decadal Oscillation MODES OF CLIMATE VARIABILITY Lecture

Pacific Decadal Oscillation MODES OF CLIMATE VARIABILITY Lecture 6 Oliver Elison Timm ATM 306 Fall 2016

Objectives l Spatial structure l Temporal characteristics l Ocean-Atmosphere interactions l Ecological impacts l l

Spatial Pattern of the Pacific Decadal Oscillation PDO is a mode defined by sea surface temperature anomalies in the Pacific Ocean l Note: The original 'definition' of the l PDO mode is done by multivariate statistical analysis of monthly SST anomalies north of 20 N in the Pacific.

Ocean-atmosphere states during positive and negative PDO phases Positive PDO phase Negative PDO phase Typical wintertime Sea Surface Temperature (colors), Sea Level Pressure (contours) and surface windstress (arrows) anomaly patterns during warm and cool phases of PDO

Pacific Decadal Oscillation time evolution Pacific Decadal Oscillation shows long periods with primarily positive index values, followed by decades with more frequent negative values. This is expressed with the term “decadal” in the name.

North Pacific Index: Measure of the strength of the Aleutian Low North Pacific Index (NP index or NPI) is the area-weighted sea level pressure over the region 30°N-65°N, 160°E-140°W. � Defined for winter season �

What is the connection between Aleutian Low strength and North Pacific SST anomalies? What is the statistical relationship? What is the physical connection?

What is the connection between Aleutian Low strength and North Pacific SST anomalies? Statistical relationship: Physical relationship:

Ocean Atmosphere Interaction in the North Pacific Recall: 2. 5 m ocean layer has the same heat capacity as the troposphere The ocean mixed layer is about 100 -200 m in North Pacific => huge heat capacity Sensible heat flux depends on SST, air temperature, winds Latent heat flux depends on SST relative humidity, winds SST anomalies are damped by latent and sensible heat fluxes

Ocean Atmosphere Interaction in the North Pacific Ocean is the 'flywheel' of the climate system. It stores 'excessive' heat fluxes coming from the atmosphere and compensates 'shortages' in the atmospheric energy demand. Shortwave, longwave, sensible and latent heat flux Mixed layer The extratropical atmospheric circulation shows irregular/random/chaotic variations Ocean temperature anomalies are more persistent than atmospheric temperature anomalies Damping time scale of ocean SST anomalies: 3 -6 months Interior Ocean
![Exponential decay & damping time scale SST Anomaly [deg C] Initial value Half value](http://slidetodoc.com/presentation_image_h/2b05a01db96f269648836c927b6f0c11/image-11.jpg "Exponential decay & damping time scale SST Anomaly [deg C] Initial value Half value")
Exponential decay & damping time scale SST Anomaly [deg C] Initial value Half value 2. 5 month half time e-folding time: 4 month Time in month
 as a response to stochastic atmopsheric forcing In the 1970")
Sea Surface Temperature (SST) as a response to stochastic atmopsheric forcing In the 1970 s climate scientists adopted the concept of “Brownian Motion” to theory of climate variability: Atmosphere with fast random variations and short damping time scales. Ocean has to respond to these variations. Ocean is the 'slowly moving' system (large heat capacity) that integrates atmospheric forcing. Link to youtube video https: //www. youtube. com/watch? v=FAdxd 2 Iv-

Extratropical ocean-atmosphere climate as a stochastically forced system Atmosphere: fast internal processes (from weather to monthly and interannual, even decadal time scales, variations appear random) → random force Ocean: slow response to random atmospheric forcing The generalized concept is called “Stochastic Climate Models”

Mixed-layer temperatures Pycnocline separates less dense upper ocean water mass from the cool dense water below. Mixing these two water masses requires strong wind stress (and turbulence) in the ocean. Cold season: cooling at surface + strong storm activity leads to a deepening of the mixed layer Warm season: warming of upper ocean water => formation of shallow mixed layer. F': heat flux anomaly (positive if ocean gains energy from atmosphere) T': ocean mixed-layer temperature anomaly λ (lambda): damping feedback: ocean restores back to the unperturbed temperature

Observation-based estimate of the mixed layer depth Note: Winter mixed layer thicker than during summer. Summer mixed layer (20 -30 m) isolates the deeper winter-mixed layer heat anomalies during summer. The following fall and winter: old heat anomalies 're-emerge' and influence the sea surface temperature in the next winter.

Memory for SST anomalies in the North Pacific Mixed layer heat content observations Gray shade: the stochastic model With growing mixed layer depth the ‘memory effect’ is increasing

Summary of the important mechanisms for the PDO

Impacts of the PDO Statistical methods are used to detect and to quantify connections between regional temperatures, rainfall, streamflow etc. with the PDO At least two difficulties we face with this approach: (a) we need long time series, since PDO variability contains decadal to multidecadal variability (100 years of continuous observations needed) (b) there is a danger of attributing regional variability to the 'wrong cause' Because ENSO, North Pacific atmosphere and ocean are not independently evolving, but they are connected.
 1901")
Impacts on rainfall In North America Correlation between PDO and rainfall (Nov-Mar season) 1901 -2004 Blue colors: negative correlation between PDO index and county-averaged rainfall anomalies. Red colors: positive correlation
")
Impacts on rainfall In North America Correlation between ENSO index and rainfall (Nov-Mar season) 1901 -2004 Blue colors: negative correlation between PDO index and county-averaged rainfall anomalies. Red colors: positive correlation
 and")
Impacts on rainfall In North America Correlation between NPI (strength of Aleutian Low) and rainfall (Nov-Mar season) 1901 -2004 Blue colors: negative correlation between PDO index and county-averaged rainfall anomalies. Red colors: positive correlation
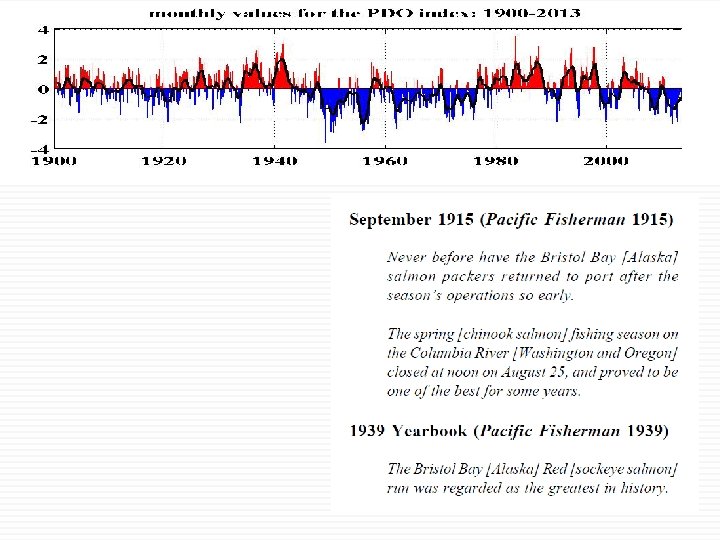
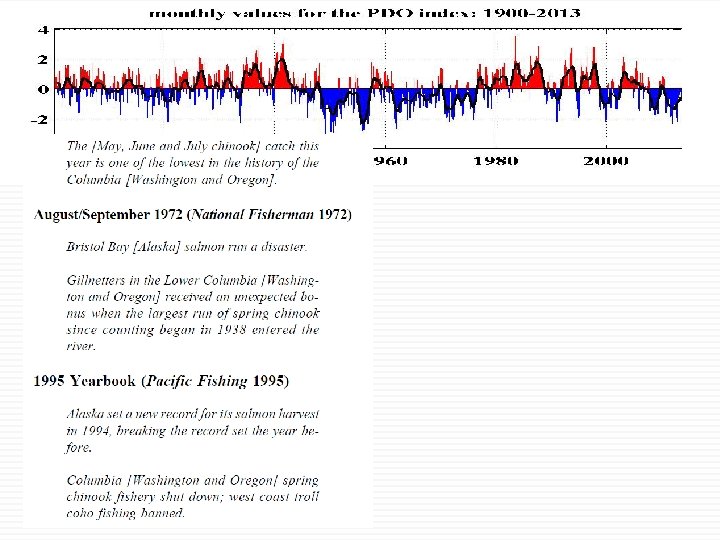

Impact of the PDO on commercial fisheries Rapid changes in the production levels of major commercial fish stocks have been connected to interdecadal climate variability in the northeast Pacific (Alaska, Washington, Oregon, California)

Impact of the PDO on commercial fisheries Sockeye Salmon Rapid changes in the production levels of major commercial fish stocks have been connected to interdecadal climate variability in the northeast Pacific (Alaska, Washington, Oregon, California) Pictures from Wikipedia: Fraser River Watershed https: //en. wikipedia. org/wiki/Sockeye_salmon

Impact of the PDO on commercial fisheries 3 -5 lb 5 -8 lb Pink (Humpy) Salmon Oncorhynchus gorbuscha Sockeye (Red) Salmon Oncorhynchus nerka http: //wdfw. wa. gov/fishing/salmon/species. html

Impact of the PDO on commercial fisheries PDO index

Impact of the PDO on commercial fisheries 3 -5 lb 5 -8 lb

Impact of the PDO on commercial fisheries Multivariate analysis: Combined look at climate index time series of the PDO, Aleutian Low, and ENSO (representing atmospheric and oceanic climate variability) plus 30 time series of fish catch (various regions and species) The longer the bar the higher the correlation. Sign of correlation is indicated here by the direction of the bars relative to the base line.

Impact of the PDO on commercial fisheries Multivariate time series index and correlation pattern show: § PDO was in negative phase 1940 s - 1970 s § Shift into positive phase 1970 s – 1990 s § Central, western and southeast Alaska catch records for Salmon show strong positive correlations with PDO § Weaker negative correlation with some (chinook & coho) species further south along the US Pacific coast.

Impact of the PDO on commercial fisheries Ecological response to the PDO-related environmental changes: § Ocean SST, mixed layer thickness, river streamflow => Changes in nutrient concentrations § Phytoplankton and zooplankton (base of the food chain) works its way up to top-level predators like salmon § For Alaskan salmon: § § § positive PDO year brings enhanced streamflows and nearshore ocean mixed-layer conditions favorable to high biological productivity Southwards along the Pacific Northwest: § negative PDO years bring favorable conditions for Salmon

Source: IPCC AR 4 report 2007, Ch. 3. 6 https: //www. ipcc. ch/publications_and_data/ar 4/wg 1/en/ch 3 s 3 -6. html#3 -6 -1
- Slides: 33