
Overview of the IMPLAN Model Agenda IMPLAN Review



- Slides: 17
Overview of the IMPLAN Model
Agenda § IMPLAN Review § IMPLAN Case Study § Understanding Regional Differences in IMPLAN Copyright © 2009 IHS Global Insight. All Rights Reserved.
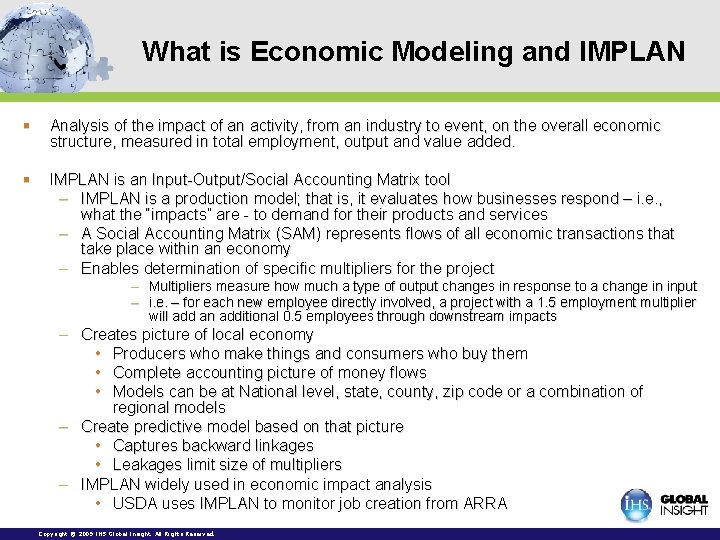
What is Economic Modeling and IMPLAN § Analysis of the impact of an activity, from an industry to event, on the overall economic structure, measured in total employment, output and value added. § IMPLAN is an Input-Output/Social Accounting Matrix tool – IMPLAN is a production model; that is, it evaluates how businesses respond – i. e. , what the “impacts” are - to demand for their products and services – A Social Accounting Matrix (SAM) represents flows of all economic transactions that take place within an economy – Enables determination of specific multipliers for the project – Multipliers measure how much a type of output changes in response to a change in input – i. e. – for each new employee directly involved, a project with a 1. 5 employment multiplier will add an additional 0. 5 employees through downstream impacts – Creates picture of local economy • Producers who make things and consumers who buy them • Complete accounting picture of money flows • Models can be at National level, state, county, zip code or a combination of regional models – Create predictive model based on that picture • Captures backward linkages • Leakages limit size of multipliers – IMPLAN widely used in economic impact analysis • USDA uses IMPLAN to monitor job creation from ARRA Copyright © 2009 IHS Global Insight. All Rights Reserved.
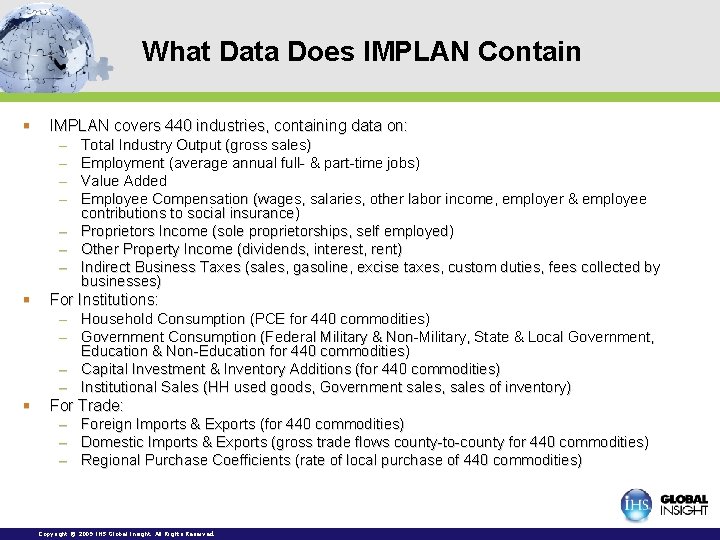
What Data Does IMPLAN Contain § IMPLAN covers 440 industries, containing data on: – Total Industry Output (gross sales) – Employment (average annual full- & part-time jobs) – Value Added – Employee Compensation (wages, salaries, other labor income, employer & employee contributions to social insurance) – Proprietors Income (sole proprietorships, self employed) – Other Property Income (dividends, interest, rent) – Indirect Business Taxes (sales, gasoline, excise taxes, custom duties, fees collected by businesses) § For Institutions: – Household Consumption (PCE for 440 commodities) – Government Consumption (Federal Military & Non-Military, State & Local Government, Education & Non-Education for 440 commodities) – Capital Investment & Inventory Additions (for 440 commodities) – Institutional Sales (HH used goods, Government sales, sales of inventory) § For Trade: – Foreign Imports & Exports (for 440 commodities) – Domestic Imports & Exports (gross trade flows county-to-county for 440 commodities) – Regional Purchase Coefficients (rate of local purchase of 440 commodities) Copyright © 2009 IHS Global Insight. All Rights Reserved.
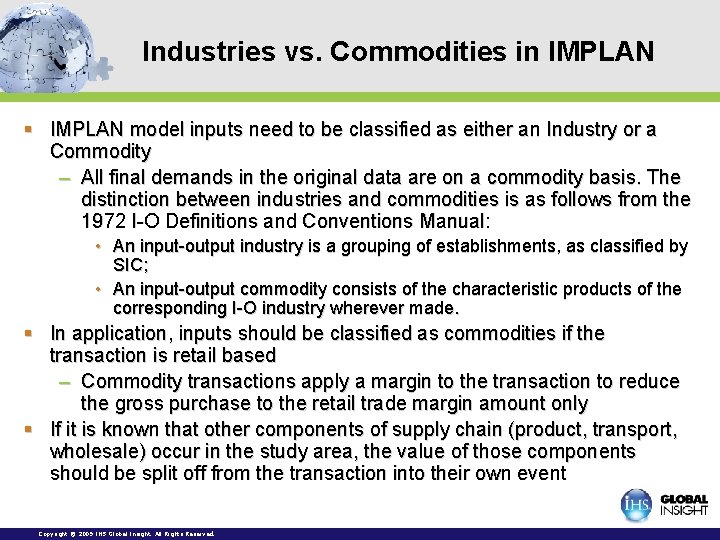
Industries vs. Commodities in IMPLAN § IMPLAN model inputs need to be classified as either an Industry or a Commodity – All final demands in the original data are on a commodity basis. The distinction between industries and commodities is as follows from the 1972 I-O Definitions and Conventions Manual: • An input-output industry is a grouping of establishments, as classified by SIC; • An input-output commodity consists of the characteristic products of the corresponding I-O industry wherever made. § In application, inputs should be classified as commodities if the transaction is retail based – Commodity transactions apply a margin to the transaction to reduce the gross purchase to the retail trade margin amount only § If it is known that other components of supply chain (product, transport, wholesale) occur in the study area, the value of those components should be split off from the transaction into their own event Copyright © 2009 IHS Global Insight. All Rights Reserved.
Economic Impact Definitions § Economic Impacts – Direct Effect • Direct effect refers to the response of the economy to the change in the final demand of a given industry, refers to those directly involved in the activity. – Indirect Effect • Indirect effect refers to the response of the economy to the change in the final demand of the industries that are dependent on the direct spending industries for their input, also known as the supplier effect. – Induced Effect • Induced effect refers to the response of the economy to changes in household expenditure as a result of income generated by the direct and indirect effects, also known as the income effect. § Value Added – Value added is payment to labor and capital used in the production of an industry. It is defined as the sum of labor income, indirect business taxes and business income. Copyright © 2009 IHS Global Insight. All Rights Reserved.
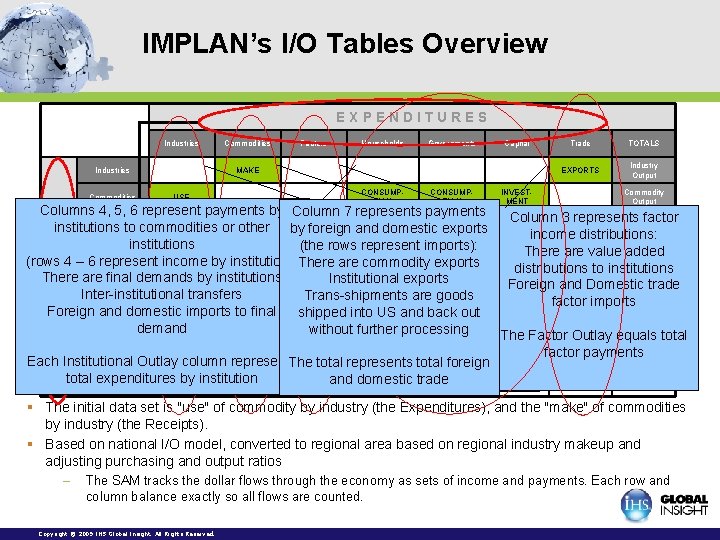
IMPLAN’s I/O Tables Overview EXPENDITURES Industries Commodities Factors Households Governments Capital MAKE USE CONSUMPTION INVESTMENT Trade TOTALS EXPORTS Industry Output Commodity Output R Columns 4, 5, 6 represent payments by Column 7 represents payments VALUE Column 2 all represents Column 3 represents all the Factor factor Column 1 represents Factors ADDED Receipts E institutions to commodities or other by foreign and domestic exports by Commodities: income distributions: the payments by Industry: DISBURSTAXES & EXTERNAL Household institutions (the rows represent imports): C Households SALES TRANSFERS They are made There in industries are value added They buy. TRANSFERS commodities MENTS TRANSFERS INCOME Receipts (rows. I 4 – 6 represent income by institution): There are commodity exports They are sold distributions to institutions Add& value. TRANSFERS from factories DISBURSTAXES EXTERNAL Governments SALES TRANSFERS There are final demands by institutions MENTS Institutional TRANSFERSexports SERVICES Receipts Foreign and Domestic trade Buy imports E Inter-institutional transfers Trans-shipments are goods DISBURSTAXES & NET Capital SALES TRANSFERSOutlay The Commodity factorequals imports Pay for. TRANSFERS employment MENTS TRANSFERS Receipts P Foreign and domestic imports to final shipped into US and back total out commodity INVESTMT output TRANSTrade T Trade IMPORTS processing IMPORTS demand without further SHIPMENTS Receipts The Factor Outlay equals total The Industry Outlay equals S Industry Commodity Household Government Trade payments total industry output. Capital factor TOTALS Factor Outlay Outlays Each Institutional Outlay column represents The total represents total. Outlay foreign Outlays total. Employment expenditures. JOBS by institution and domestic trade § The initial data set is "use" of commodity by industry (the Expenditures), and the "make" of commodities by industry (the Receipts). § Based on national I/O model, converted to regional area based on regional industry makeup and adjusting purchasing and output ratios – The SAM tracks the dollar flows through the economy as sets of income and payments. Each row and column balance exactly so all flows are counted. Copyright © 2009 IHS Global Insight. All Rights Reserved.
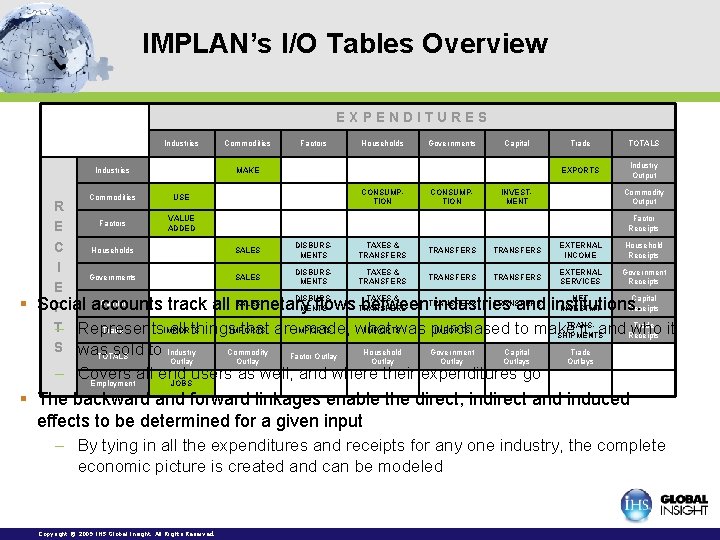
IMPLAN’s I/O Tables Overview EXPENDITURES Industries Commodities § Commodities Factors Households Governments Capital MAKE USE CONSUMPTION INVESTMENT Outlays Trade TOTALS EXPORTS Industry Output Commodity Output R VALUE Factors ADDED Receipts E DISBURSTAXES & EXTERNAL Household C Households SALES TRANSFERS MENTS TRANSFERS INCOME Receipts I DISBURSTAXES & EXTERNAL Governments SALES TRANSFERS MENTS TRANSFERS SERVICES Receipts E DISBURSTAXES & NET Capital TRANSFERS Social accounts track all SALES monetary flows TRANSFERS between industries and institutions. MENTS INVESTMT Receipts P TRANSTrade T Trade IMPORTS – Represents all things. IMPORTS that are. IMPORTS made, what was purchased to make it, and Receipts who it SHIPMENTS S was sold to Industry Commodity Household Government Capital Trade TOTALS Outlay Factor Outlays – Covers all end users as well, and where their expenditures go Employment JOBS § The backward and forward linkages enable the direct, indirect and induced effects to be determined for a given input – By tying in all the expenditures and receipts for any one industry, the complete economic picture is created and can be modeled Copyright © 2009 IHS Global Insight. All Rights Reserved.
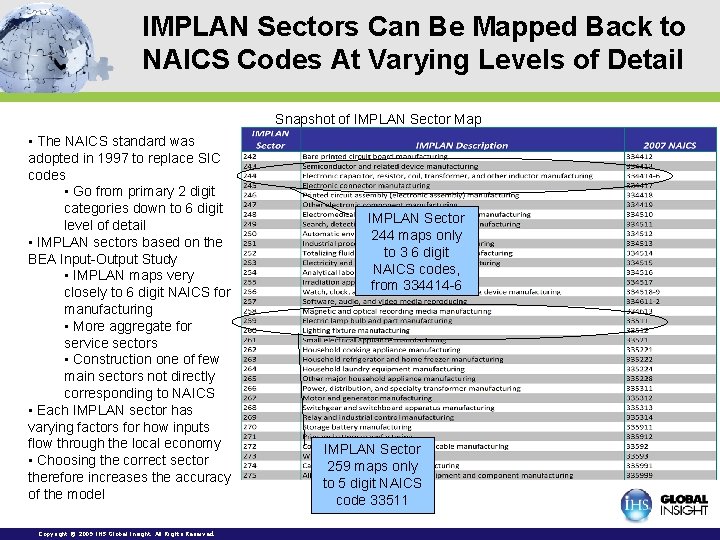
IMPLAN Sectors Can Be Mapped Back to NAICS Codes At Varying Levels of Detail Snapshot of IMPLAN Sector Map • The NAICS standard was adopted in 1997 to replace SIC codes • Go from primary 2 digit categories down to 6 digit level of detail • IMPLAN sectors based on the BEA Input-Output Study • IMPLAN maps very closely to 6 digit NAICS for manufacturing • More aggregate for service sectors • Construction one of few main sectors not directly corresponding to NAICS • Each IMPLAN sector has varying factors for how inputs flow through the local economy • Choosing the correct sector therefore increases the accuracy of the model Copyright © 2009 IHS Global Insight. All Rights Reserved. IMPLAN Sector 244 maps only to 3 6 digit NAICS codes, from 334414 -6 IMPLAN Sector 259 maps only to 5 digit NAICS code 33511
Agenda § § § EIA and IMPLAN Review IMPLAN Case Study Understanding Regional Differences in IMPLAN Sunfab Economic Impact Review Challenges and Opportunities Going Forward Copyright © 2009 IHS Global Insight. All Rights Reserved.
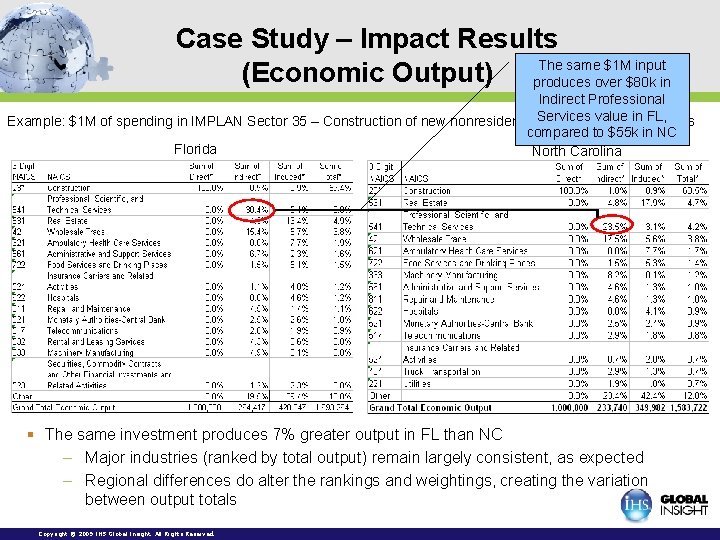
Case Study – Impact Results The same $1 M input (Economic Output) produces over $80 k in Indirect Professional value in FL, Example: $1 M of spending in IMPLAN Sector 35 – Construction of new nonresidential. Services manufacturing structures compared to $55 k in NC Florida North Carolina § The same investment produces 7% greater output in FL than NC – Major industries (ranked by total output) remain largely consistent, as expected – Regional differences do alter the rankings and weightings, creating the variation between output totals Copyright © 2009 IHS Global Insight. All Rights Reserved.
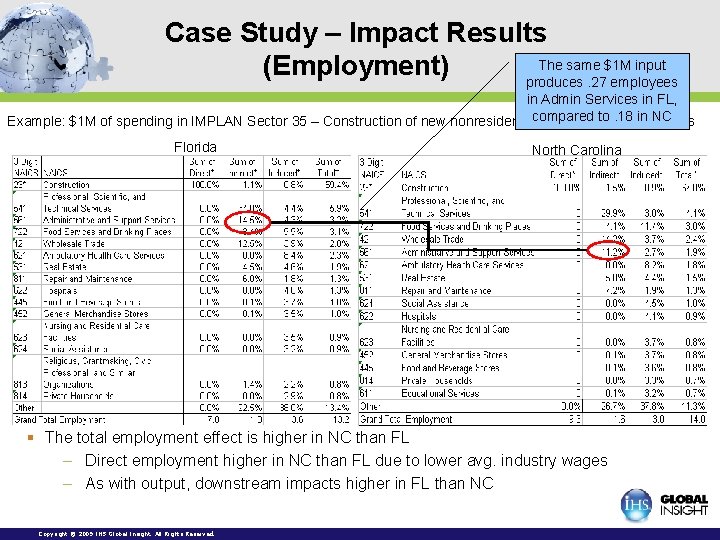
Case Study – Impact Results The same $1 M input (Employment) produces. 27 employees in Admin Services in FL, to. 18 structures in NC Example: $1 M of spending in IMPLAN Sector 35 – Construction of new nonresidentialcompared manufacturing Florida North Carolina § The total employment effect is higher in NC than FL – Direct employment higher in NC than FL due to lower avg. industry wages – As with output, downstream impacts higher in FL than NC Copyright © 2009 IHS Global Insight. All Rights Reserved.
Agenda § § § EIA and IMPLAN Review IMPLAN Case Study Understanding Regional Differences in IMPLAN Sunfab Economic Impact Review Challenges and Opportunities Going Forward Copyright © 2009 IHS Global Insight. All Rights Reserved.
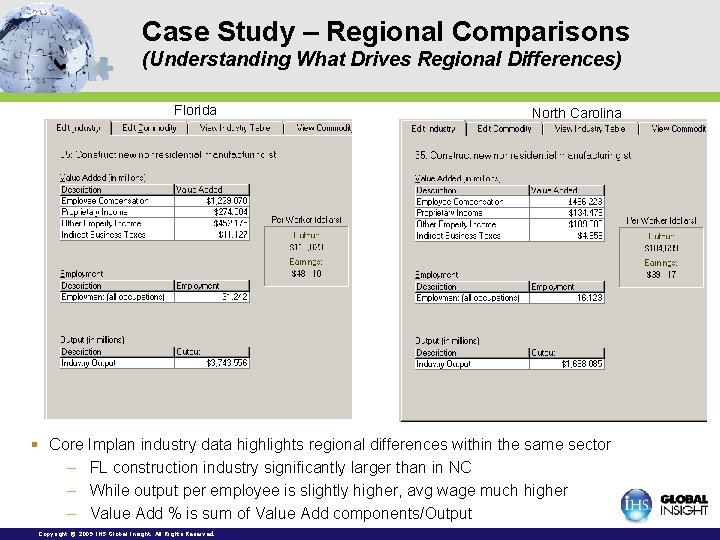
Case Study – Regional Comparisons (Understanding What Drives Regional Differences) Florida North Carolina § Core Implan industry data highlights regional differences within the same sector – FL construction industry significantly larger than in NC – While output per employee is slightly higher, avg wage much higher – Value Add % is sum of Value Add components/Output Copyright © 2009 IHS Global Insight. All Rights Reserved.
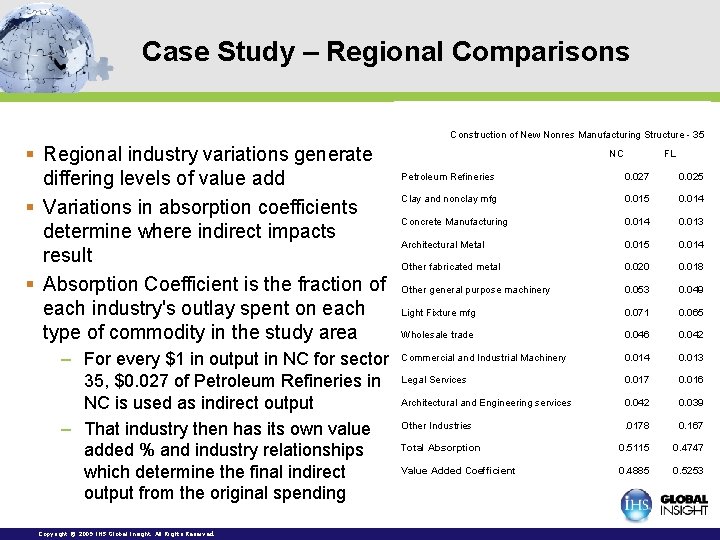
Case Study – Regional Comparisons Construction of New Nonres Manufacturing Structure - 35 § Regional industry variations generate differing levels of value add § Variations in absorption coefficients determine where indirect impacts result § Absorption Coefficient is the fraction of each industry's outlay spent on each type of commodity in the study area – For every $1 in output in NC for sector 35, $0. 027 of Petroleum Refineries in NC is used as indirect output – That industry then has its own value added % and industry relationships which determine the final indirect output from the original spending Copyright © 2009 IHS Global Insight. All Rights Reserved. NC FL Petroleum Refineries 0. 027 0. 025 Clay and nonclay mfg 0. 015 0. 014 Concrete Manufacturing 0. 014 0. 013 Architectural Metal 0. 015 0. 014 Other fabricated metal 0. 020 0. 018 Other general purpose machinery 0. 053 0. 049 Light Fixture mfg 0. 071 0. 065 Wholesale trade 0. 046 0. 042 Commercial and Industrial Machinery 0. 014 0. 013 Legal Services 0. 017 0. 016 Architectural and Engineering services 0. 042 0. 039 Other Industries . 0178 0. 167 Total Absorption 0. 5115 0. 4747 Value Added Coefficient 0. 4885 0. 5253
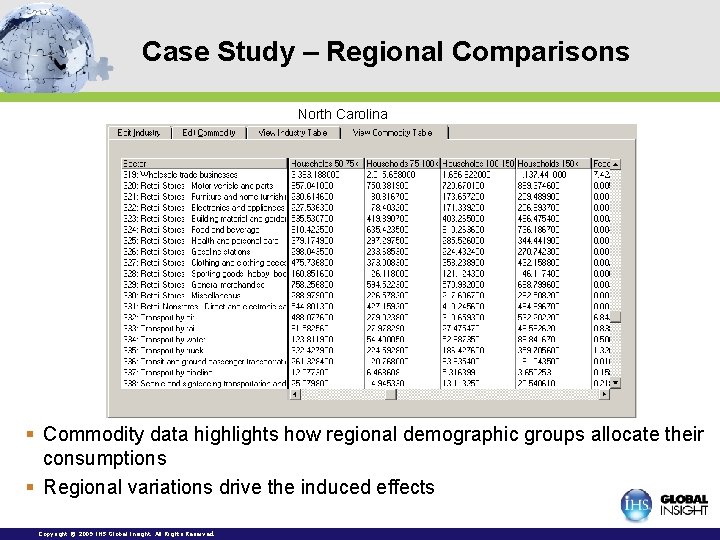
Case Study – Regional Comparisons North Carolina § Commodity data highlights how regional demographic groups allocate their consumptions § Regional variations drive the induced effects Copyright © 2009 IHS Global Insight. All Rights Reserved.
Thank You John Barrett Senior Consultant IHS Global Insight john. s. barrett@ihsglobalinsight. com 781 -301 -9274 Shane Norton Senior Consultant IHS Global Insight shane. norton@ihsglobalinsight. com 781 -301 -9071 Copyright © 2009 IHS Global Insight. All Rights Reserved.