Overview BWSSN Recap Skin Sensor Signal Types DSC

Overview • • BWSSN Recap Skin Sensor Signal Types DSC Brief Review DWT Brief Review ECG Signal DWT ECG Adapted for Wireless Transmission DSC DWT ECG Wireless Transmission

Typical Skin Sensor Network

BWSSN Basic Sensor Processor Module

Skin Sensor Signals • Modules will incorporate sensing, signal processing, RF communications and low power electronics. • Skin sensors for – Temperature: Thermistor – Heart Rate: ECG – Blood Oxygen: Pulse Oximeter – Blood Pressure – Sweat component detectors:
 Typical Area of Application Y 1 Y 2 Y 3")
Distributed Source Coding (DSC) Typical Area of Application Y 1 Y 2 Y 3 X Y 4 Yi = hi*X + Zi Zi: Noise hi: LTI Filter Wire- less Comm network Central Decoder

DSC SW Example Implementation Source X 000 Encoder 000 {000, 111} = 00 001 {001, 110} = 01 010 {010, 101} = 10 011 {011, 100} = 11 100 101 110 111 00 Decoder X={000, 111} Y=000 d. H(X, Y) ≤ 1 X-Y ≤ 1 X=000

Wireless Communication General Data Packet Structure Preamble sequence Start of Packet Delimiter PRE SPD LEN PC ADDRESSING DSN Link Layer PDU CRC-16 Data sequence number Addresses according to specified mode Flags specify addressing mode Length for decoding simplicity

TOSH Data Packet Used in Xbow Motes A typical TOSH data packet comprises the following: 7 E 42 FF FF 06 11 1 D 81 02 01 00 B 9 07 B 0 07 BE 07 B 5 07 7 F 00 FF 01 FF 03 00 00 00 55 86 7 E In this frame: 7 E 42 ==> SYNC and TYPE bytes is the Serial framing protocol The rest is the TOS_msg -- actual packet (detailed in file tos/types/AM. h)

TOSH Data Packet Breakdown is as follows: uint 16_t addr; // FF FF uint 8_t type; // 06 // uint 8_t group; // 11 uint 8_t length; // 1 D int 8_t data[TOSH_DATA_LENGTH]; // 81 02 01 00 B 9 07 B 0 07 BE 07 // B 5 07 7 F 00 FF 01 FF 03 00 00 // 00 00 00 uint 16_t crc; // 55 86

Energy Consumption Reduction Via DSC • TOSH_DATA_LENGTH is usually set equal to 29. Varying this number varies the length of the data packet. • Each packet carries node id, voltage, temperature, light and other mote information. • Each sensor’s data is encoded into two eight bit words. • One objective via DSC – reduce the number of data bits per sensor that is wirelessly transmitted from 16 to 8 with the receiver still yielding the sensor reading without loss of information.

Wavelet Transforms Introduction • Wavelet – A small wave • Wavelet Transforms – Convert a signal into a series of wavelets – Provide a way for analyzing waveforms, bounded in both frequency and duration – Allow signals to be stored more efficiently than by Fourier transform – Be able to better approximate real-world signals – Well-suited for approximating data with sharp discontinuities • “The Forest & the Trees” – See gross features with a large "window“ – See small features with a small "window” Source: Fengxiang Qiao, Ph. D. Texas Southern University www. missouri. edu/~sunc/TRB/ Introduction%20 to%20 Wavelet%20 a%20 Tutorial%20 -%20 Qiao. ppt

TIME-DOMAIN SIGNAL • The Independent Variable is Time • The Dependent Variable is the Amplitude • Most of the Information is Hidden in the Frequency Content Magnitude 2 Hz Time 10 Hz Time Magnitude 20 Hz Source: Fengxiang Qiao, Ph. D. Texas Southern University Time www. missouri. edu/~sunc/TRB/ Introduction%20 to%20 Wavelet%20 a%20 Tutorial%20 -%20 Qiao. ppt 2 Hz + 10 Hz + 20 Hz

STATIONARITY OF SIGNAL 2 Hz + 10 Hz + 20 Hz Magnitude Stationary Magnitude Occur at all times Time Frequency (Hz) Non. Stationary Magnitude 0. 0 -0. 4: 2 Hz + 0. 4 -0. 7: 10 Hz + 0. 7 -1. 0: 20 Hz Magnitude Do not appear at all times Source: Fengxiang Qiao, Ph. D. Texas Southern University Time Frequency (Hz) www. missouri. edu/~sunc/TRB/ Introduction%20 to%20 Wavelet%20 a%20 Tutorial%20 -%20 Qiao. ppt

• Wavelet Transform – An alternative approach to the short time Fourier transform to overcome the resolution problem – Similar to STFT: signal is multiplied with a function • Multiresolution Analysis – Analyze the signal at different frequencies with different resolutions – Good time resolution and poor frequency resolution at high frequencies – Good frequency resolution and poor time resolution at low frequencies – More suitable for short duration of higher frequency; and longer duration of lower frequency components Source: Fengxiang Qiao, Ph. D. Texas Southern University www. missouri. edu/~sunc/TRB/ Introduction%20 to%20 Wavelet%20 a%20 Tutorial%20 -%20 Qiao. ppt

PRINCIPLES OF WAVELET TRANSFORM • Split Up the Signal into a Bunch of Signals • Represents the Same Signal, but all Corresponding to Different Frequency Bands • Only Providing What Frequency Bands Exists at What Time Intervals Source: Fengxiang Qiao, Ph. D. Texas Southern University www. missouri. edu/~sunc/TRB/ Introduction%20 to%20 Wavelet%20 a%20 Tutorial%20 -%20 Qiao. ppt

PRINCIPLES OF WAVELET TRANSFORM • Basically WT is a convolution of the wavelet function with the signal • WT analyzes signal info by modifying the wavelets thru translation (location) and dilation (scale) • Wavelet function φa, b with Scale, a and Location, b T. Froese ECG Signal Classification using DWT: http: //www. cogs. susx. ac. uk/users/tf 29/publications/Froese_04_Classification. Of. ECGUsing. DWT_MEng. pdf
 • Wavelet Scale")
DEFINITION OF CONTINUOUS WAVELET TRANSFORM Translation (The location of the window) • Wavelet Scale Mother Wavelet – Small wave – Means the window function is of finite length • Mother Wavelet – A prototype for generating the other window functions – All the used windows are its dilated or compressed and shifted versions Source: Fengxiang Qiao, Ph. D. Texas Southern University www. missouri. edu/~sunc/TRB/ Introduction%20 to%20 Wavelet%20 a%20 Tutorial%20 -%20 Qiao. ppt

Translated 1 D Wavelet Example Source: Fengxiang Qiao, Ph. D. Texas Southern University www. missouri. edu/~sunc/TRB/ Introduction%20 to%20 Wavelet%20 a%20 Tutorial%20 -%20 Qiao. ppt

DWT SCALE • Scale – S>1: dilate the signal – S<1: compress the signal • Low Frequency -> High Scale -> Nondetailed Global View of Signal -> Span Entire Signal • High Frequency -> Low Scale -> Detailed View Last in Short Time • Only Limited Interval of Scales is Necessary Source: Fengxiang Qiao, Ph. D. Texas Southern University www. missouri. edu/~sunc/TRB/ Introduction%20 to%20 Wavelet%20 a%20 Tutorial%20 -%20 Qiao. ppt

Time Scaled 1 D Wavelet Source: Fengxiang Qiao, Ph. D. Texas Southern University www. missouri. edu/~sunc/TRB/ Introduction%20 to%20 Wavelet%20 a%20 Tutorial%20 -%20 Qiao. ppt

MATHEMATICAL EXPLANATION CWT can also be regarded as the inner product of the signal with a basis function Source: Fengxiang Qiao, Ph. D. Texas Southern University www. missouri. edu/~sunc/TRB/ Introduction%20 to%20 Wavelet%20 a%20 Tutorial%20 -%20 Qiao. ppt

COMPUTATION OF CWT • Step 1: The wavelet is placed at the beginning of the signal, and set s=1 (the most compressed wavelet); • Step 2: The wavelet function at scale “ 1” is multiplied by the signal, and integrated over all times; then multiplied by ; • Step 3: Shift the wavelet to t= , and get the transform value at t= and s=1; • Step 4: Repeat the procedure until the wavelet reaches the end of the signal; • Step 5: Scale s is increased by a sufficiently small value, the above procedure is repeated for all s; • Step 6: Each computation for a given s fills the single row of the time-scale plane; • Step 7: CWT is obtained if all s are calculated. Source: Fengxiang Qiao, Ph. D. Texas Southern University www. missouri. edu/~sunc/TRB/ Introduction%20 to%20 Wavelet%20 a%20 Tutorial%20 -%20 Qiao. ppt

RESOLUTION OF TIME & FREQUENCY Higher Frequencies Better time resolution; Poor frequency resolution Frequency Lower Frequencies Better frequency resolution; Poor time resolution Time • Each box represents a equal portion Source: Fengxiang Qiao, Ph. D. Texas Southern University • Resolution in STFT is selected once for entire analysis www. missouri. edu/~sunc/TRB/ Introduction%20 to%20 Wavelet%20 a%20 Tutorial%20 -%20 Qiao. ppt

Discrete Wavelet Transform • Discrete form of Wavelet function – m varies dilation, – n varies translation, – a 0 is a fixed dilation step, – b 0 is the location parameter > 0 • Natural way to sample parameters a and b is to use a log discretization of the ‘a’ scale and link this in turn to the size of the steps taken between ‘b’ locations T. Froese ECG Signal Classification using DWT: http: //www. cogs. susx. ac. uk/users/tf 29/publications/Froese_04_Classification. Of. ECGUsing. DWT_MEng. pdf

Discrete Wavelet Transform • DWT of a continuous signal via a discrete wavelet is given by • Tm, n are known as wavelet or detail coefficients • In the dyadic grid arrangement a 0=2, and b 0=1 • Discrete dyadic wavelets are usually selected to be orthonormal (orthogonal and normalized to have unit energy) – Means that info stored in a wavelet coefficient, Tm, n is not repeated elsewhere and allows for complete regeneration of the original signal without redundancy T. Froese ECG Signal Classification using DWT: http: //www. cogs. susx. ac. uk/users/tf 29/publications/Froese_04_Classification. Of. ECGUsing. DWT_MEng. pdf

Discrete Wavelet Transform • Sampling of the continuous signal is accomplished by associating the orthonormal dyadic discrete wavelets with scaling functions • Scaling function is convolved with the continuous signal to produce approximation coefficients which are weighted averages of the signal factored by 2 m/2 • These approximation coefficients Sm, n constitute a discrete approximation of the signal at scale m T. Froese ECG Signal Classification using DWT: http: //www. cogs. susx. ac. uk/users/tf 29/publications/Froese_04_Classification. Of. ECGUsing. DWT_MEng. pdf

Continuous Wavelet Transform Discrete Wavelet Transform T. Froese ECG Signal Classification using DWT: http: //www. cogs. susx. ac. uk/users/tf 29/publications/Froese_04_Classification. Of. ECGUsing. DWT_MEng. pdf

1 d DWT Algorithm Starting from s, 1 st step produces 2 sets of coeff: Approx coeff. c. A 1 and Detail coeff c. D 1. These vectors are obtained by convolving s with LPF Lo -D for c. A 1 and with HPF Hi-D for c. D 1 followed by dyadic decimation Source: Matlab

Matlab DWT Decomposition Algorithm Source: Matlab

DWT Matlab Implementation Source: Matlab

SUBBAND CODING ALGORITHM • Halves the Time Resolution – Only half number of samples resulted • Doubles the Frequency Resolution – The spanned frequency band halved 0 -1000 Hz X[n]5 12 Filter 1 256 S S D 1 A 1 D 2 A 3 D 3 A 1 256 Filter 2 128 D 1: 500 -1000 Hz 128 Filter 3 A 2 64 D 2: 250 -500 Hz 64 D 3: 125 -250 Hz A 3: 0 -125 Hz

Matlab Illustration Source: Matlab

Matlab Wavelet Decomposition Source: Matlab

Matlab Wavelet Decomposition Source: Matlab

WAVELET BASES Time domain Frequency domain Wavelet Basis Functions: Derivative Of a Gaussian M=2 is the Marr or Mexican hat wavelet

Various 1 D Wavelets Source: Fengxiang Qiao, Ph. D. Texas Southern University www. missouri. edu/~sunc/TRB/ Introduction%20 to%20 Wavelet%20 a%20 Tutorial%20 -%20 Qiao. ppt

Wavelet Function Criteria • For complex wavelets, FT must both be real and vanish for negative frequencies • Wavelet must have finite energy • Wavelet must have zero meaning that wavelet has no zero frequency components

DWT of ECG • DWT can be used to represent a discretely sampled ECG signal by a finite amount of time-invariant wavelet coefficients with enough resolution for further signal diagnostics. • DWT can also be used to filter noise and other signal deteriorating artifacts by dropping out selected coefficients in the reconstruction process

ECG Signal Origin http: //medicalcenter. osu. edu/patientcare/healthinformation/diseasesandconditions/he artdisease/arrhythmias/ • http: //your-doctor. com/healthinfocenter/medical-conditions/cardiovascular/conductiontutorial. html

ECG Signal Origin Cardiac conduction system: The specialized network of cells in the heart that initiates an electrical signal in the heart and carries it throughout the heart, causing it to beat.

Standard ECG Signal Detection

Typical ECG Signal Ref: http: //rnbob. tripod. com/index. htm
![ECG Signal Points of Origin [Diagram from Psychophysiology-Human Behaviour and Physiological Response] http: //home.](http://slidetodoc.com/presentation_image/63c0560f4d69ff68168174dd3c7fb878/image-43.jpg "ECG Signal Points of Origin [Diagram from Psychophysiology-Human Behaviour and Physiological Response] http: //home.")
ECG Signal Points of Origin [Diagram from Psychophysiology-Human Behaviour and Physiological Response] http: //home. iprimus. com. au/rboon/Heart. Rhythmsand. HRV. htm

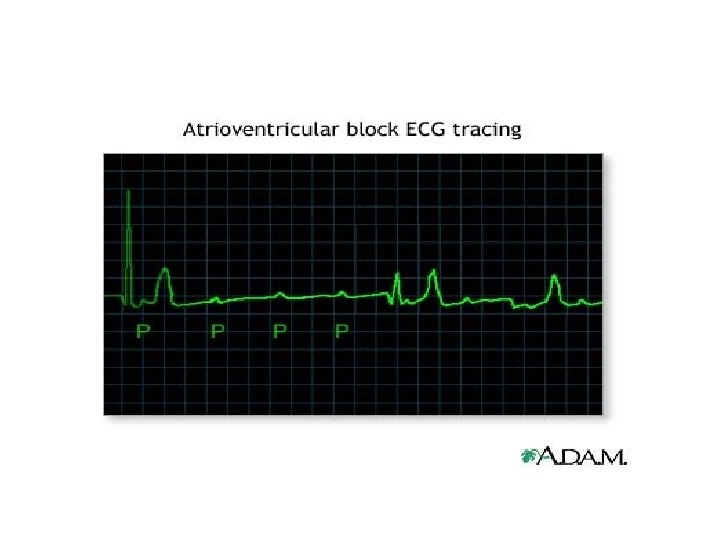
ECG Wave Components The P wave represents atrial activation; the PR interval is the time from onset of atrial activation to onset of ventricular activation. The QRS complex represents ventricular activation; the QRS duration is the duration of ventricular activation. The ST-T wave represents ventricular repolarization. The QT interval is the duration of ventricular activation and recovery. The U wave probably represents "afterdepolarizations" in the ventricles. http: //medstat. med. utah. edu/kw/ecg/mml/ecg_533. html http: //medstat. med. utah. edu/kw/ecg/image_index/index. html

Terminology for Contraction Phases Marquette Electronics Copyright 1996, http: //medstat. med. utah. edu/kw/ecg/mml/ecg_compens. html http: //medstat. med. utah. edu/kw/ecg/image_index/index. html

http: //medstat. med. utah. edu/kw/ecg/image_index/index. html

http: //medstat. med. utah. edu/kw/ecg/mml/ecg_arrhythmia. html http: //medstat. med. utah. edu/kw/ecg/image_index/index. html

http: //medstat. med. utah. edu/kw/ecg/image_index/index. html

http: //medstat. med. utah. edu/kw/ecg/image_index/index. html

http: //medstat. med. utah. edu/kw/ecg/image_index/index. html

Marquette Electronics Copyright 1996 http: //medstat. med. utah. edu/kw/ecg/mml/ecg_compens. html http: //medstat. med. utah. edu/kw/ecg/image_index/index. html

Heart Rate Variability - HRV Standards of Measurement, Physiological Interpretation, and Clinical Use Task Force of the European Society of Cardiology the North American Society of Pacing Electrophysiology. Correspondence to Marek Malik, Ph. D, MD, Chairman, Writing Committee of the Task Force, Department of Cardiological Sciences, St George's Hospital Medical School, Cranmer Terrace, London SW 17 0 RE, UK. http: //circ. ahajournals. org/cgi/content/full/93/5/1043
 SDNN ms")
Normal Values of Standard Measures of HRV Variable Units Normal Values (mean±SD) SDNN ms 141± 39 SDANN ms 127± 35 RMSSD ms 27± 12 Time Domain Analysis of Nominal 24 hours HRV triangular index 37± 15 Spectral Analysis of Stationary Supine 5 -min Recording Total power ms 2 3466 ± 1018 LF ms 2 1170± 416 HF ms 2 975± 203 LF nu 54± 4 HF nu 29± 3 LF/HF ratio 1. 5 -2. 0
![Typical Autonomic Response (ANS) Affecting Heart Rate [Diagram From The Institute of Heart. Math]](http://slidetodoc.com/presentation_image/63c0560f4d69ff68168174dd3c7fb878/image-55.jpg "Typical Autonomic Response (ANS) Affecting Heart Rate [Diagram From The Institute of Heart. Math]")
Typical Autonomic Response (ANS) Affecting Heart Rate [Diagram From The Institute of Heart. Math] http: //home. iprimus. com. au/rboon/Heart. Rhythmsand. HRV. htm

Typical ECG Signal Noise and Distortions
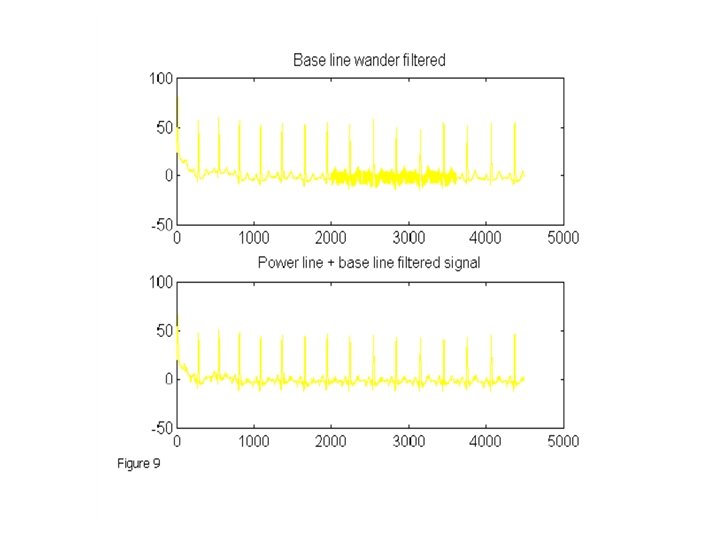

Clean ECG+ noise +60 hz DWT Filtered Signal

Sym 5 Processed Signal Clean ECG+ noise+ 60 hz DWT Filtered Signal

Db 5 Processed Signal Clean ECG+ noise+ 60 hz DWT Filtered Signal

Sym 5 Processed Signal Clean ECG+ noise+ 60 hz DWT Filtered Signal Peaks Detected for signal recovery

Db 5 Processed Signal Clean ECG+ noise+ 60 hz DWT Filtered Signal Peaks Detected for signal recovery
![Matlab DWT Threshold Selection Choices Matlab DWT Denoising function [XD, CXD, LXD] = wden(X,](http://slidetodoc.com/presentation_image/63c0560f4d69ff68168174dd3c7fb878/image-63.jpg "Matlab DWT Threshold Selection Choices Matlab DWT Denoising function [XD, CXD, LXD] = wden(X,")
Matlab DWT Threshold Selection Choices Matlab DWT Denoising function [XD, CXD, LXD] = wden(X, TPTR, SORH, SCAL, N, 'wname') • Wavelet decomposition is performed at level N and 'wname' is a string containing the name of the desired orthogonal wavelet • TPTR: Threshold Selection Rules: – 'rigrsure' use the principle of Stein's Unbiased Risk – 'heursure' is an heuristic variant of the first option – 'sqtwolog' for universal threshold – 'minimaxi' for minimax thresholding (see thselect for more information) – SORH ('s' or 'h') is for soft or hard thresholding (see wthresh for more information).

Multiplicative Threshold Rescaling • SCAL defines multiplicative threshold rescaling: – 'one' for no rescaling – 'sln' for rescaling using a single estimation of level noise based on first-level coefficients – 'mln' for rescaling done using level-dependent estimation of level noise

DWT ARHOS LP Filter R. H. Istepanian, L. J. Hadjileontiadis, S. M Panas, ECG Data Compression Using Wavelets and Higher Order Statistics Methods, IEEE Transactions on Information Technology in Biomedicine, Vol 5, No. 2 June 2001

Summary Research Goals • Signal processing algorithms for wireless skin sensors with the following optimization features and objectives – Higher signal to noise output with lower input signal power – Common interference signals identified and cancelled – Common and typical artifacts characterized, reduced and / or cancelled – Reduced instruction set, software memory and hardware requirements for processing of signal

Summary Research Goals • Utilization of multiple wireless sensors to improve desired signal via constructive signal addition from the multiple sensor outputs. • Processor hardware and software designed and optimized for low power consumption • Sensors to include types for measuring pulse, respiration, blood oxygenation, glucose levels, bio-impedance, skin hydration, and body temperature.
- Slides: 67