Overtopping of Seawalls Tony Mignone National Weather Service


")

![Lord’s Cove, NL Devon Telford elevation LLWLT [m] Relief of Lord's Cove 10 5](https://slidetodoc.com/presentation_image_h/2774ec7d0ba33776c33345e701ecf244/image-23.jpg "Lord’s Cove, NL Devon Telford elevation LLWLT [m] Relief of Lord's Cove 10 5")

")
")

 Crown Wall Berm Width Revetment")


- Slides: 33
Overtopping of Seawalls Tony Mignone National Weather Service Caribou Maine anthony. mignone@noaa. gov
Location of Test Sites
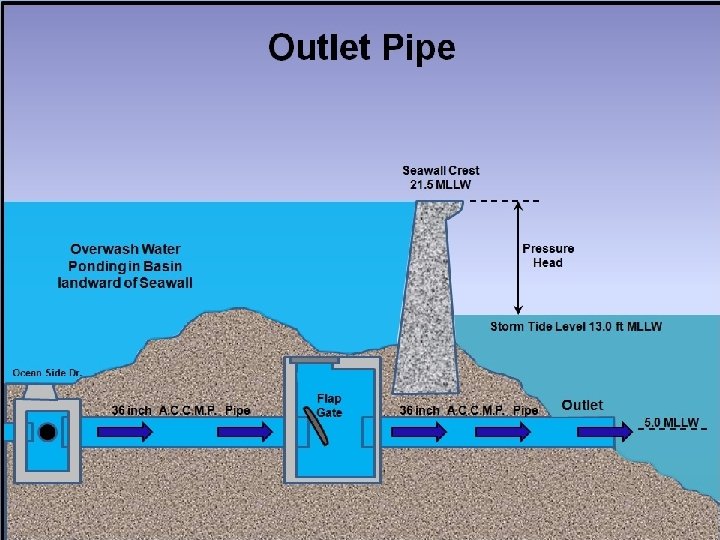
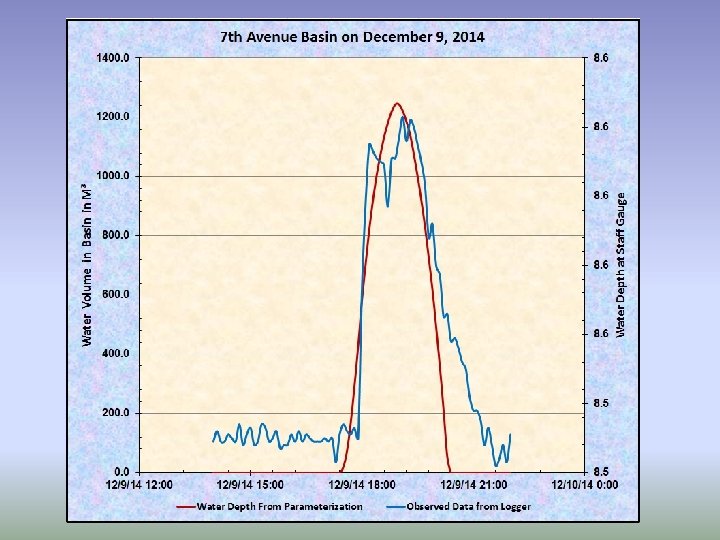
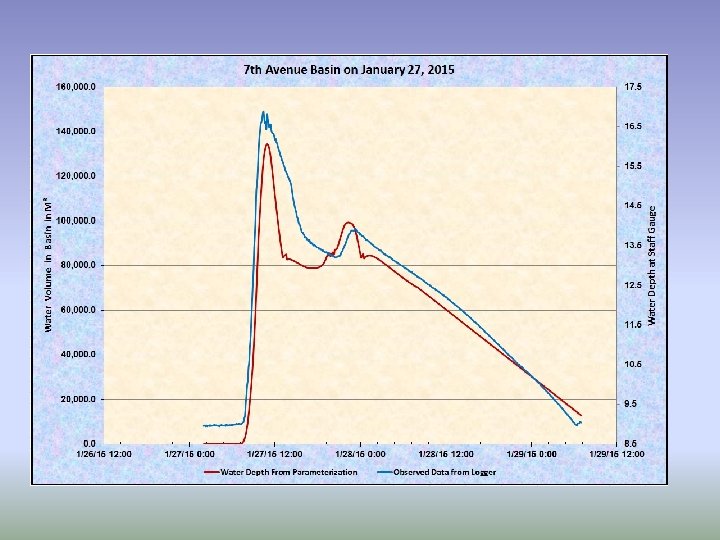
Avenues Basin Flooded from Overtopping Time Stamp = 27 th/0754 EST Water Level = 15. 476 feet Seawall Stop Sign 7 th & Ocean Side Dr. January 27, 2015
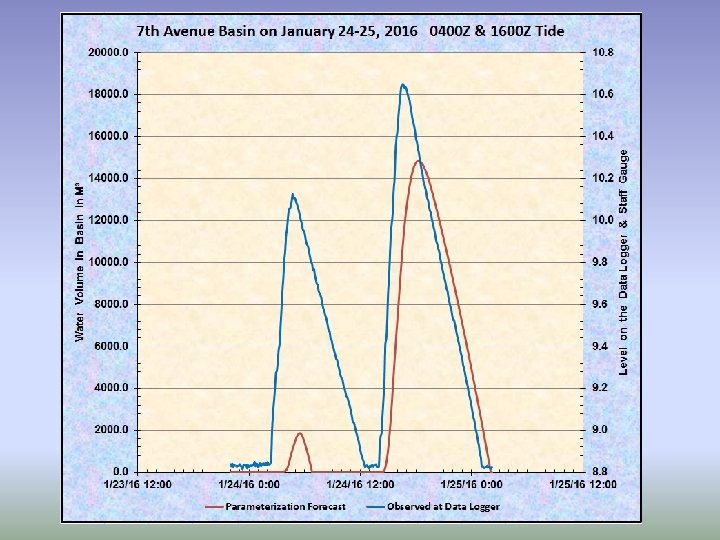
Seawall at Scituate Massachusetts Seawall Length of seawall used for calculations Staff Gauge 7 th Avenue Basin Seawall Data Logger Seawall Staff Gauge Scituate Ave Basin
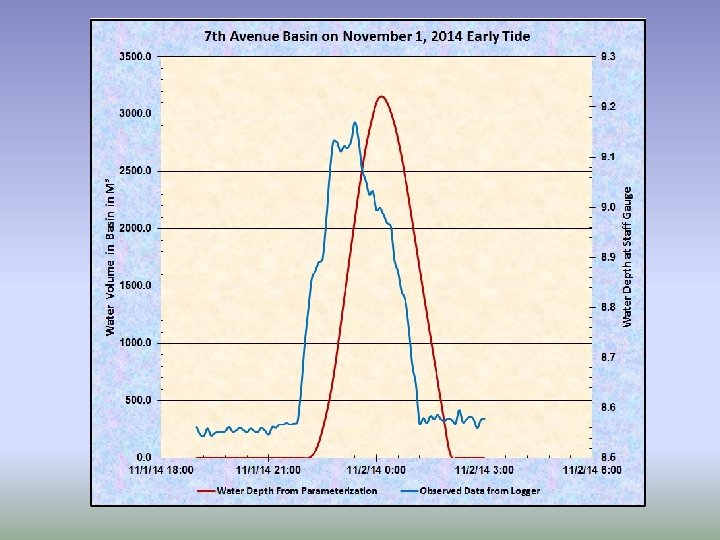
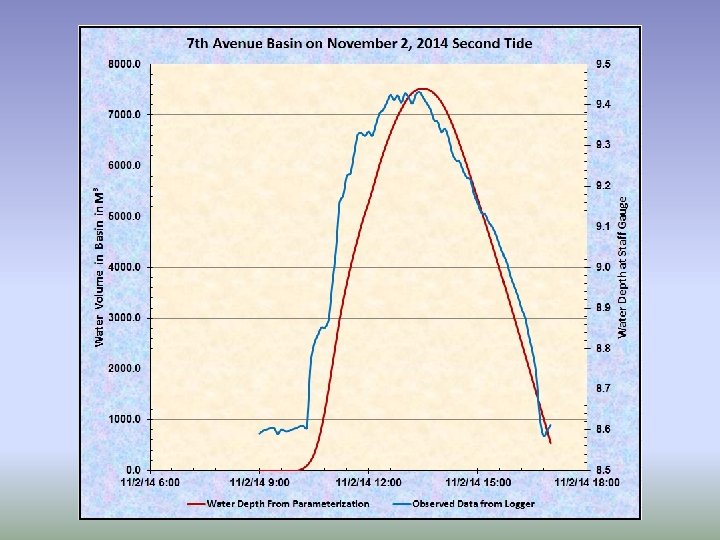
Test Events Deploy Water Level Pressure Gauge/Data Logger to Bottom of Staff gauge prior to expected storm event to measure water depth per unit time.
Overtopping Parameterization Bruce, van der Meer, and Jansen Mean overtopping discharge m³/s per meter of structure length Off shore wave steepness Dimensionless Freeboard for slopes Adjusted Dimensionless Freeboard for slopes (Bruce) Plunging wave dimensionless discharge
Algorithm Parameters Freeboard & Slope Seawall Crest Freeboard Seawall toe Slope measured from the +2. 0 MLLW level to the seawall toe Still Water Level (SWL)
Reduction Factors = Reduction factor for shallow water = Reduction factor for Berm/Sandbar = Reduction factor foreshore roughness = Reduction factor for angle of wave attack
Shallow water reduction factor J. P. de Waal & J. W. van der Meer Smaller waves break closer to the seawall Larger waves break in deeper water
Angle of wave attack reduction factor J. P. de Waal & J. W. van der Meer Seawall Short crested waves Long crested waves Wave Direction
Suggested Adjustment Kalman Filter Application of a Kalman Filter to determine bias? Suggested By: Andrew Teakles Canada) (Environment
Lord’s Cove
Lord’s Cove Wave Energy Research Centre (WERC)
Seawall at WERC
Lord’s Cove, NL Devon Telford elevation LLWLT [m] Relief of Lord's Cove 10 5 0 -5 -10 -15 0. 0 50. 0 100. 0 150. 0 200. 0 250. 0 300. 0 350. 0 400. 0 450. 0 distance from top of seawall [m] Relief 500. 0 550. 0 600. 0 650. 0 700. 0
J. P. de Wall & J. W. van der Meer Parameterizations Devon Telford
Lord’s Cove, NL - March 22, 2015 Event Devon Telford • Using Goda (2008) empirical formulas for breaking wave height and the estimated near shore slopes from the bathymetry charts. elevation LLWLT [m] Relief of Lord's Cove 10 5 Hb=5. 5 m 0 Hb=5. 6 m -5 m=. 014 Hb=5. 5 m m=. 007 -10 m=. 02 m=. 015 -15 0. 0 50. 0 100. 0 150. 0 200. 0 250. 0 300. 0 350. 0 400. 0 450. 0 distance from top of seawall [m] Relief 500. 0 550. 0 600. 0 650. 0 700. 0
Lord’s Cove, NL - March 22, 2015 Event Devon Telford • Using Goda (2010) empirical formulas for breaking wave depth and the estimated near shore slopes from the bathymetry charts. elevation LLWLT [m] Relief of Lord's Cove 10 5 hb=-4. 2 m 0 hb=-4. 0 m hb=-4. 5 m hb=-4. 1 m -5 m=. 007 m=. 014 -10 m=. 02 m=. 015 -15 0. 0 50. 0 100. 0 150. 0 200. 0 250. 0 300. 0 350. 0 400. 0 450. 0 distance from top of seawall [m] Relief max hb min hb 500. 0 550. 0 600. 0 650. 0 700. 0
Lord’s Cove, NL - March 22, 2015 Event Devon Telford • So we can “know” everything but the depth of the water when the waves break again right before the revetment. • But we can estimate it from the video and picture. elevation LLWLT [m] Relief of Lord's Cove 6 4 2 0 -2 -4 0. 0 10. 0 20. 0 30. 0 distance from top of seawall [m] Relief SWL 40. 0 50. 0 h [m] q (cu m) q (cu ft) 1 1. 5 2 2. 5 3 3. 5 4. 000 0. 04135 0. 04718 0. 05525 0. 06388 0. 07303 0. 08264 0. 09266 1. 460 1. 666 1. 951 2. 256 2. 579 2. 918 3. 272
Lord’s Cove Seawall (46. 878208⁰ N 55. 669737⁰ W) Crown Wall Berm Width Revetment Slope
Overtopping Parameterization Jan Pedersen
Common Runup & Overtopping Parameterization Data Points Ø Deep water outside Surface Zone Ø At the toe of the foreshore Ø At the toe of the Structure
Goda Equations
Campobello in our NWPS Domain Model Boundary Spectral Point CAR 59
Questions ? ?