
Overall Context MetroNorths 2017 Customer Satisfaction Survey was
- Slides: 2
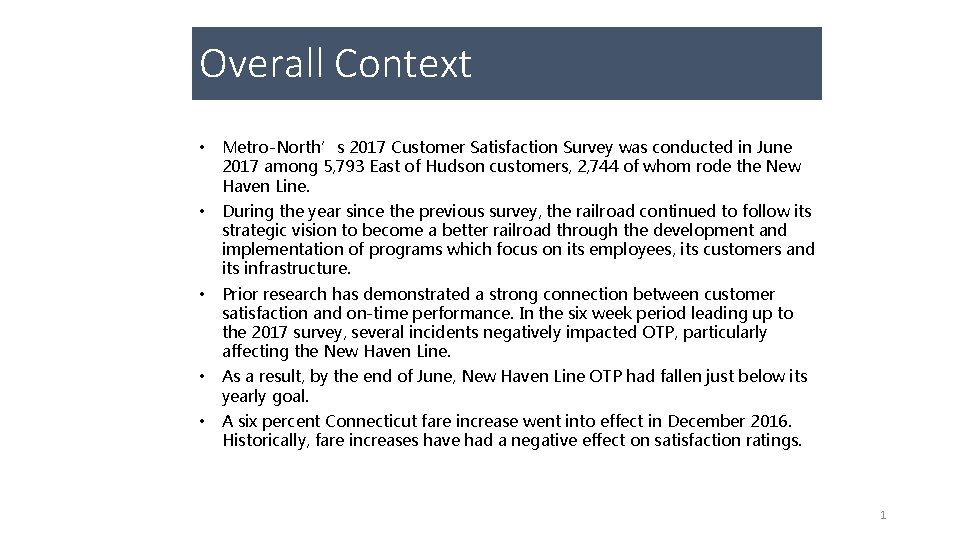
Overall Context • Metro-North’s 2017 Customer Satisfaction Survey was conducted in June 2017 among 5, 793 East of Hudson customers, 2, 744 of whom rode the New Haven Line. • During the year since the previous survey, the railroad continued to follow its strategic vision to become a better railroad through the development and implementation of programs which focus on its employees, its customers and its infrastructure. • Prior research has demonstrated a strong connection between customer satisfaction and on-time performance. In the six week period leading up to the 2017 survey, several incidents negatively impacted OTP, particularly affecting the New Haven Line. • As a result, by the end of June, New Haven Line OTP had fallen just below its yearly goal. • A six percent Connecticut fare increase went into effect in December 2016. Historically, fare increases have had a negative effect on satisfaction ratings. 1
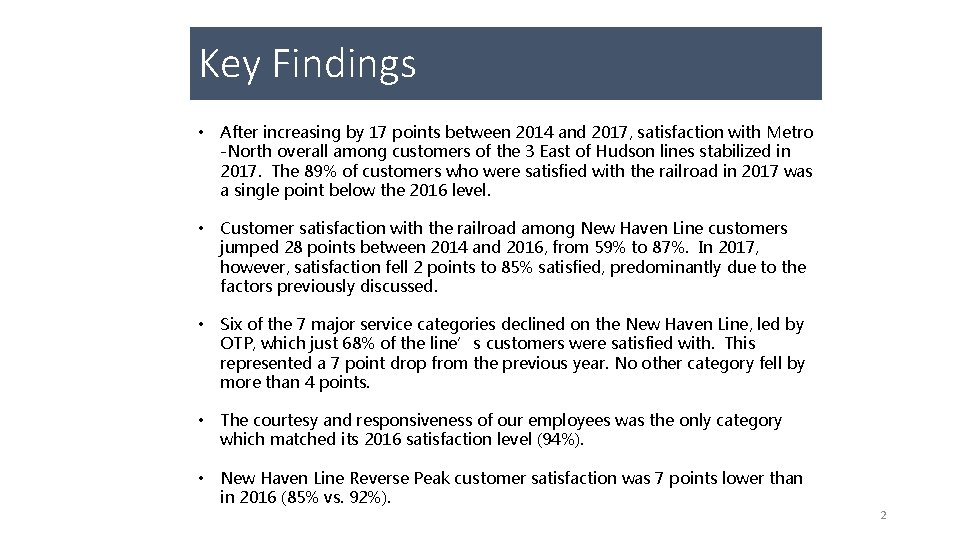
Key Findings • After increasing by 17 points between 2014 and 2017, satisfaction with Metro -North overall among customers of the 3 East of Hudson lines stabilized in 2017. The 89% of customers who were satisfied with the railroad in 2017 was a single point below the 2016 level. • Customer satisfaction with the railroad among New Haven Line customers jumped 28 points between 2014 and 2016, from 59% to 87%. In 2017, however, satisfaction fell 2 points to 85% satisfied, predominantly due to the factors previously discussed. • Six of the 7 major service categories declined on the New Haven Line, led by OTP, which just 68% of the line’s customers were satisfied with. This represented a 7 point drop from the previous year. No other category fell by more than 4 points. • The courtesy and responsiveness of our employees was the only category which matched its 2016 satisfaction level (94%). • New Haven Line Reverse Peak customer satisfaction was 7 points lower than in 2016 (85% vs. 92%). 2