Outsourcing Occupational and Industrial Concentration Nick Bloom Stanford

Outsourcing, Occupational and Industrial Concentration Nick Bloom, Stanford University Audrey Guo, Santa Clara University Brian Lucking, Charles River Associates 2020 ASSA Meetings
")
Disclaimer This research was conducted with restricted access to Bureau of Labor Statistics (BLS) data. The views expressed here do not necessarily reflect the views of the BLS or the U. S. government. Any opinions and conclusions expressed herein are those of the authors and do not necessarily represent the views of the U. S. Census Bureau. All results have been reviewed to ensure that no confidential information is disclosed.

Outsourcing allows firms to focus on their core competencies “The most powerful way to prevail in global competition. . . [is the] ability to identify, cultivate, and exploit the core competencies that make growth possible” - Prahalad and Hamel (1990) • Firms have a set of activities they can perform well, and outside these core competencies their ability starts to deteriorate

Supply Chain and Logistics Adhesives Engines
;")
Related Literature • Contracting Out and Alternative Work Arrangements: • Abraham and Taylor (1996); Dey, Houseman, Polivka (2010); Katz and Krueger (2015) • Income Inequality: • Dube and Kaplan (2010); Handwerker and Spletzer (2015); Song et. al (2015); Goldschmidt and Schmieder (2017) • Our paper studies a broad range of occupations, and documents the change in both occupational and industrial concentration over the last few decades
 Data 2) Occupational Concentration 3) Industrial Concentration")
Outline 1) Data 2) Occupational Concentration 3) Industrial Concentration
 • 1999 – 2016 • Semi-annual survey of U. S.")
Occupational Employment Statistics (OES) • 1999 – 2016 • Semi-annual survey of U. S. business establishments • Establishments report quantity and wage intervals for each occupation they employ (800+ detailed occupation codes) • We aggregate detailed occupations to the 5 -digit SOC level (about 450) • Employees assigned to occupations based on the work they perform and not on the basis of education or training • Restrict to establishments with 5 or more workers
 • 1976 – 2015 • Annual employment and payroll for")
Longitudinal Business Database (LBD) • 1976 – 2015 • Annual employment and payroll for universe of employer business establishments • Each establishment is also assigned a 6 -digit NAICS industry • We aggregate establishments to the firm level to study industrial concentration • Restrict to firms whose average payroll is less than $250, 000 and greater than full-time federal minimum wage

Measures of Occupational Concentration •

Notes: Means are weighted by survey weight and then smoothed over 3 -year averages.

Notes: Means are weighted by survey weight and then smoothed over 3 -year averages.

Notes: Means are weighted by survey weight and then smoothed over 3 -year averages.

Concentration by Establishment Size Notes: HHI means are weighted by survey weight*employment and then smoothed over 3 -year averages.

Regression Analysis

Regression Analysis
 Ratio: Overall employment")
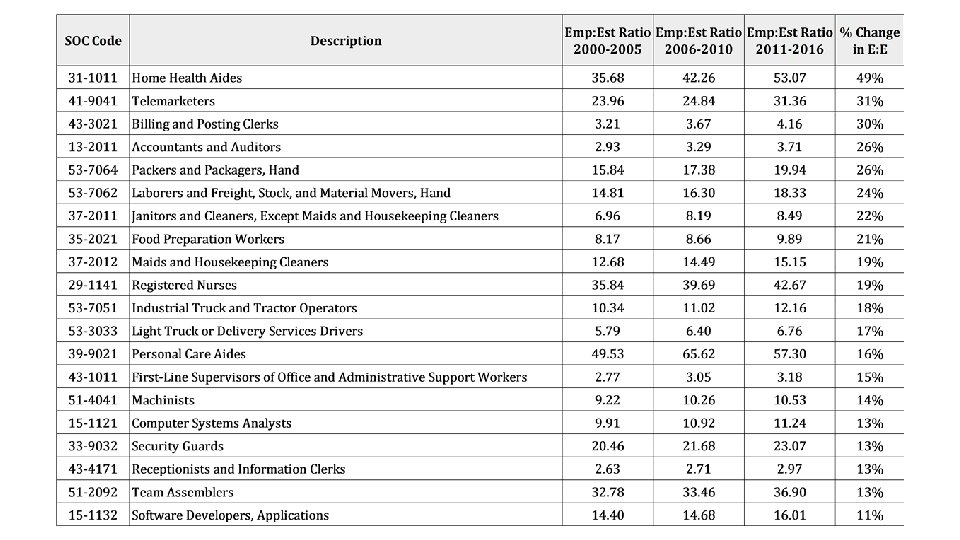
Method for Identifying Outsourceable Occupations • Employment to Establishment (E: E) Ratio: Overall employment in an occupation divided by the total number of establishments reporting at least one worker in that occupation • when employers outsource an occupation, they will no longer be considered an establishment reporting that occupation and the denominator of the E: E ratio shrinks • Calculate E: E for Top 50 SOC-5 occupations, and rank by percentage change from 2000 -2005 to 2011 -2016 period.


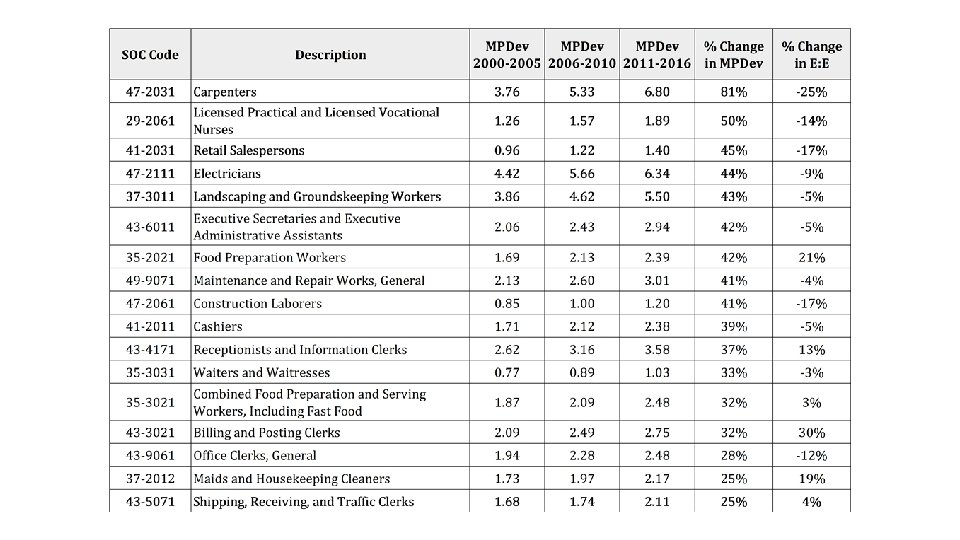
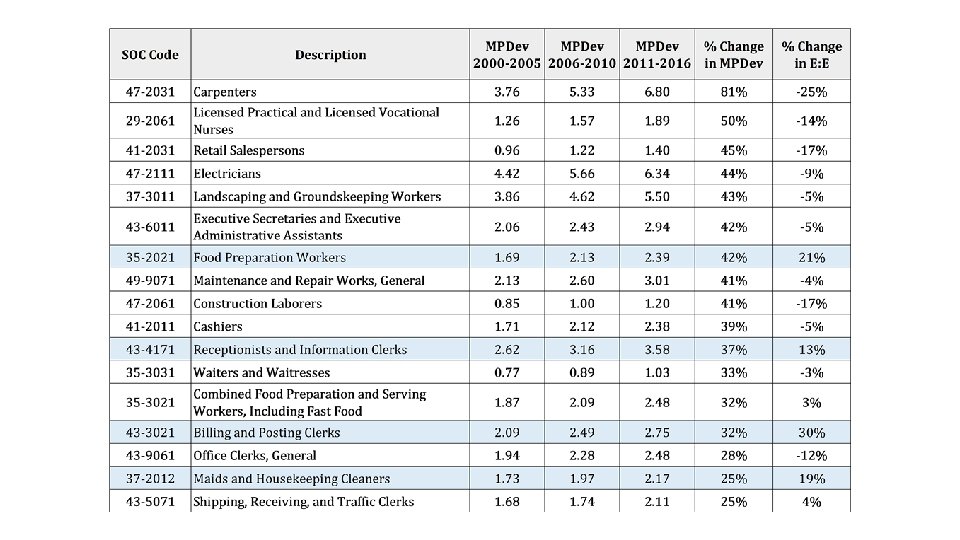
Alternative Measure for Identifying Outsourcing •

Similar pattern of rising industrial concentration in LBD Notes: Employment-weighted mean of firm-specific measures of annual industry concentration

Including controls makes pattern stronger

Also observe rising concentration in Compustat

Conclusions • Use multiple sources of firm microdata to document rising concentration in last few decades • Decrease in the number of occupations and industries in which firms are active • Increases in the share of employment accounted for by firms' most common occupations and most important industries • Rising occupational HHI and industrial HHI indices • Future work will explore drivers of this rise in concentration, and potential role of increased firm concentration on the rising segregation of employees by income and education across firms
- Slides: 27