Outline 1 Introduction 2 Ion trap Conventional trap
 3. Precision spectroscopy 4.")


 Signal to noise ratio")


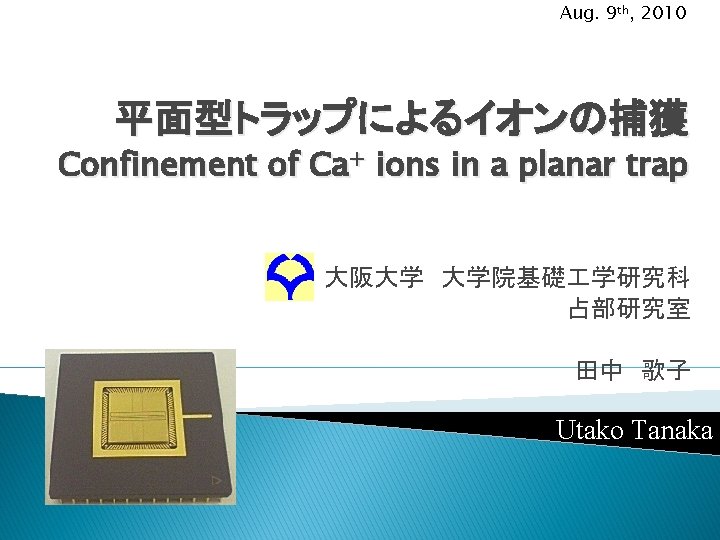
![4. Trap layout Potential depth x direction [mm] z direction [mm] Vrf=800 Vp-p,](https://slidetodoc.com/presentation_image_h/f6d7fce6dbd1069ebf4e59f059e27ea9/image-16.jpg "4. Trap layout Potential depth x direction [mm] z direction [mm] Vrf=800 Vp-p,")


 Gold")


- Slides: 29
Outline 1. Introduction 2. Ion trap (Conventional trap, Planar trap) 3. Precision spectroscopy 4. Trap layout 5. Characterization using Ca+ ions 6. Micromotion compensation 7. New design 8.Summary
1. Introduction Ion trap Confine charged particles by using electromagnetic field 60’s 80’s Proposed by Dehmelt Spectroscopy by Wineland, Werth, and Walther Paul trap (rf electric field) Penning Trap( static electric field and static magnetic field) 90’s Linear Paul trap Since these two types were established, structures of ion trap electrodes had been basically same. x y z
1. Introduction Planar trap Chiaverini et al. , Quantum Inf. Comput. 5, 419 -439 (2005) J. C. E. Pearson et al. , Phys. Rev. A 73, 032307 (2006) S. Seidelin et al. , Phys. Rev. Lett. 96, 253003 (2006) Kenneth R. Brown et al. , Phys. Rev. A 75, 015401 (2007) Linear Paul trap - + + Planar trap - ○ Complicated layout ○ Optical access ○ Coupling ion traps with other physical systems ▲ Shallow potential
2. Ion trap Conventional linear trap Line charge at z 0 2 dimention, analytic (K: const) Complex plane y d d x Electrostatic potential at a moment Positive line charge Negative line charge Pseudopotential
2. Ion trap Planar trap Complex plane y d’ d d d’ Electrostatic potential at a moment x Pseudopotential
Planar trap Quantum information processing Shuttling ions Junctions Quantum simulation 2 D trap Complicated layout Precision spectroscopy Large solid angle Optical access Electromagnetic field probe Quantum Optics Coupling ion traps with other physical systems Superconductivity material
3. Precition spectroscopy Transition frequency Linewidth Stability Allan deviation (S/N) Signal to noise ratio T T. Rosenband et al. , Science 319, 1808 (2008) Frequency Ratio of Al+ and Hg+ Single-Ion Optical Clocks; Metrology at the 17 th Decimal Place Cycle time to make a Single determination of the line center Averaging time
3. Precition spectroscopy Stability Allan deviation Detection efficiency Trap Lens Filter Viewport Solid angle Optics loss Quantum efficiency ~ 0. 01 0. 7 0. 5 Photomultiplier ~ 0. 5 ! Lens (insulator) cannot be close to the trapping region because it affects on the trapping potential.
3. Precition spectroscopy Accuracy 88 Sr+ 2 S Doppler shift Second order Quadrupole moment shift dc potential gradient Zeeman shifts First order 1/2 - 40 Ca + 2 D 5/2 171 Yb + 199 Hg + 2 S 1/2 - 2 D 5/2 137 Ba + 115 In + 1 S S 1/2 -2 D 3/2 (F=2 -F=0) 0 - 27 Al + 3 P 0 Doppler cooling limit ~ 10 -18 Residual thermal motion and micromotion D-state order of several hertz or more no quadrupole moment no first order Zeeman shift Compensation (m =0 -m =0) F F’ Second order Compensation Varing magnetic field due to currents at rf electrode Stark shifts Motional –induced Blackbody radiation (300 K 10 -16) -18 Residual thermal motion and micromotion ~ 10 7. 4 9. 3 -5. 4 ~ 10 -18 0. 38 -0. 08
4. Trap layout Simulation Middle Solver : Ansoft Maxwell 3 D Top End L End R g RF Center RF x y End L z wc wr End R Bottom wm RF DC Q: ion charge, m: ion mass : RF potential : DC potential : RF frequency
4. Trap layout � Functions of electrodes Middle Top End L End R g RF Center RF x y End L z wc wr End R Bottom wm RF: confinement x-y plane End: confinement z axis , y-direction Center: y-direction Top/Bottom:compensation of micromotion in the x direction(ideally 0 V)
4. Trap layout x-y plane y-z plane
4. Trap layout y = 0. 4 mm 0. 5 mm
4. Trap layout Design of planar trap Position of trapped ion --- several hundred micrometers above the surface q-parameter in Mathieu equation (trapping condition) --- 0. 1~ 0. 3 Potential depth --- ~ 1 e. V (conventional trap --- ~ 10 e. V) Secular frequencies ---A few MHz for radial direction Several hundred k. Hz for axial direction Overlapping of rf potential null and dc potential minimum --- to minimize micromotion Spacing between electrodes Wire bonding
4. Trap layout Potential depth x direction [mm] z direction [mm] Vrf=800 Vp-p, Ω/2π=20 [MHz] , wr=0. 82 mm , wc=0. 26 mm , g=0. 05 mm , r 0=0. 414 mm
4. Trap layout Ion motion position Mathieu equation x conventional trap Vrf cosΩt i = x, y, z y z 2 z 0 r 0 U 0 Q: charge m: mass κ: geometric factor Trap condition Ion motion Secular motion (Reduced by laser cooling) micromotion :Secular frequency :phase z
4. Trap layout Excess micromotion Stray electric field Edc Ion motion Excess micromotion This motion cannot be reduced by laser cooling. D. J. Berkeland et al. , J. Appl. Phys. 83, 5025 (1998) Compensation voltages are applied to reduce the micromotion. Excitation spectra in the presence of micromotion 100 MHz kx, ky : wavevector component Laser detuning [MHz] Conventional trap Ideally ( no stray field) (rf null)=(dc potential minimum) Planar trap It is necessary to design so that the condition is satisfied.
4. Trap layout 11. 5 mm Substrate Electrode Alumina (635μm thickness、99. 5%) Gold plating Ti/Pb/Au thickness 6± 1~ 2μm Mount Wire bonding ceramic pin grid array (CPGA) Al wire
4. Trap layout SEM images of trap electrode Previous trap 50μm Current trap 50μm Acknowledgement: Dr. Shimakage at NICT
4. Trap layout Vacuum level 10 -11 Torr 106 mm
5. Characterization using Ca+ ions Loading Laser cooling photoionization Energy level diagram of Continuum Energy level diagram of 2 P 1/2 4 85 2 P 0 6 9 τ~ 1s 72 423 nm 86 4 s 4 p 1 P 1 4 s 2 1 S 0 40 Ca+ 3/2 85 390 nm 40 Ca 397 nm 2 S 1/2 2 D 5/2 2 D 3/2
5. Characterization using Ca+ ions Experimental setup x y Oven z Ca beam 866 nm RF 20 MHz 800 Vpp(typ. ) x al il c tor He ona s re z Interference filter Amp Image intensifier Vacuum chamber ~2× 10 -11 Torr 397 nm 423 nm 375 nm Photomultiplier y Beam splitter Lens Trap 397 nm To pump Trap
5. Characterization using Ca+ ions Trapping ions Photoionization Fluorescence from trapped ions Ions are trapped 405 μm above from the surface. (Design 400 μm above)
5. Characterization using Ca+ ions Quantum jumps 15μm 2 P 3/2 85 4 1/2 0 85 2 P 86 2 S 1/2 6 397 nm τ~ 1s 2 D 5/2 2 D Energy level diagram of 3/2 40 Ca+
5. Characterization using Ca+ Middle Top ions End L Measurement of secular frequency An ac voltage of 0. 4 Vamp is applied to the middle top. When it resonates to the secular frequency, ions are heated and fluorescence drops. End R RF Center ωz. RF x y End L z End R Bottom Vrf=256 Vp-p、Vcenter=9. 8 V、 Vend =14 V Vtop=Vbottom=0 V
6. Micromotion compensation x y z Detection with side beam 397 nm Side beam Middle Top electrode End left End right Center Top middle Bottom middle Vrf Before compensation[V] 8. 8 6. 2 0 0 90 After compensation[V] 8. 8 6. 2 0 3. 0 90 End L End R RF Center ωz. RF x y End L z End R Bottom
Problems When loading, calcium beam contaminates the surface of the trap, which changes the trap condition such as compensation voltages. solution Oven x y Ca beam z Loading region al il c tor He ona s re 866 nm Moving ions Detection region Laser beams hole 397 nm 423 nm 375 nm y Trap 397 nm To pump x z Ca beam Oven Trap electrode
Summary Planar trap for precision spectroscopy Stability --- will be improved Accuracy Choose the species of ion example: Ba+ and In+ ? Currents at the rf electrode would be problem →Second order Zeeman shift Trapping Ca+ ions 405 μm above the surface (almost same as the designed value) Measurement of secular frequencies (Difference from simulation) Method of micromotion compensation in the y-direction Near future Laser beams y x z Ca beam Trap electrode