OutcomesBased Accountability TM Turning the Curve The Fiscal

Outcomes-Based Accountability TM “Turning the Curve” The Fiscal Policy Studies Institute Websites raguide. org resultsaccountability. com Book - DVD Orders amazon. com resultsleadership. org

SIMPLE COMMON SENSE PLAIN LANGUAGE MINIMUM PAPER USEFUL

Outcomes-Based Accountability is made up of two parts: Population Accountability about the well-being of WHOLE POPULATIONS For Communities – Counties – States - Nations Performance Accountability about the well-being of CUSTOMER POPULATIONS For Services – Agencies – and Service Systems

COMMON LANGUAGE

THE LANGUAGE TRAP Too many terms. Too few definitions. Too little discipline Benchmark Outcome Result Modifiers Indicator Measurable Core Urgent Qualitative Priority Programmatic Targeted Performance Incremental Strategic Systemic Measure Goal Objective Target Lewis Carroll Center for Language Disorders Core qualitative strategic Your made up jargon here Measurable urgent systemic

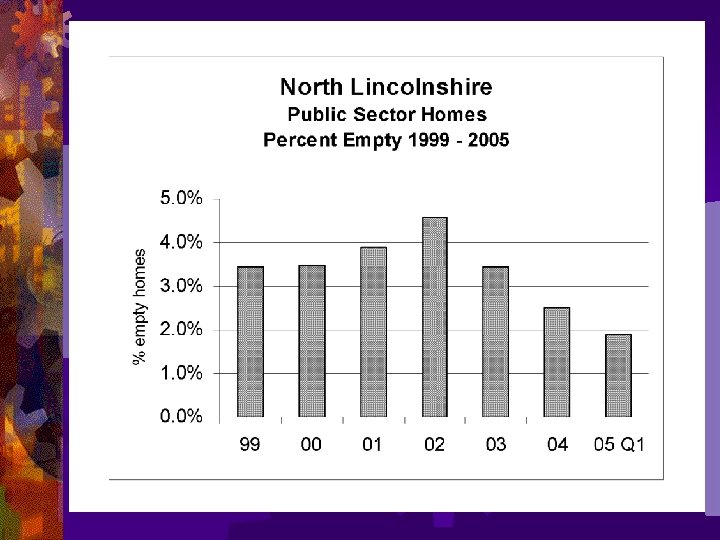
DEFINITIONS OUTCOME or RESULT condition of well-being for children, adults, families or communities. Population 1. A Children born healthy, Children ready for school, Safe communities, Environment, Prosperous Economy communities Clean Environment INDICATOR or BENCHMARK 2. A measure which helps quantify the achievement of an outcome. Performance Rate of low-birthweight babies, Percent ready at K entry, rate air quality index, index unemployment rate crime rate, PERFORMANCE MEASURE 3. A measure of how well a program, agency or service system is working. 1. How much did we do? Three types: 2. How well did we do it? 3. Is anyone better off? = Customer Outcome

IS IT A RESULT, INDICATOR OR PERFORMANCE MEASURE? RESULT 1. Safe Communities INDICATO 2. Crime rate R PERF. 3. Average police response time MEASURE RESULT 4. People are physically & mentally healthy INDICATO R 5. Rate of heart disease RESULT 6. People have living wage jobs and INDICATO R income PERF. MEASURE 7. % of people with living wage jobs and income

POPULATION ACCOUNTABILITY

Community Outcomes for Christchurch, NZ 1. A Safe City 2. A City of Inclusive and Diverse Communities 3. A City of People who Value and Protect the Natural Environment 4. A Well-Governed City 5. A Prosperous City 6. A Healthy City 7. A City for Recreation, Fun and Creativity 8. City of Lifelong Learning 9. An Attractive and Well-Designed City

City of London Ontario, Canada Priority Results ● A Strong Economy ● A Vibrant Diverse Community ● A Green and Growing City ● A Reliable Infrastructure ● A Safe City Source: Draft Strategic Plan Sept 2011

CARDIFF, WALES Community Outcomes 1. People in Cardiff are healthy 2. Cardiff has a clean attractive and sustainable environment 3. People in Cardiff are safe and feel safe 4. Cardiff has a thriving and prosperous economy 5. People in Cardiff achieve their full potential. 6. Cardiff is a great place to live, work and play. 7. Cardiff has a fair, just and inclusive society.

New Zealand Cardiff, Wales Santa Cruz County Kruidenbuurt Tilburg, Netherlands
 Experience Measure Inches of Water BASELINE Not")
Leaking Roof (Outcomes thinking in everyday life) Experience Measure Inches of Water BASELINE Not OK ? Fixed Turning the Curve Story behind the baseline (causes) Partners What Works Action Plan #2 Action Plan

Outcomes Experience Indicators Baseline & Story

75 people per day 45 people per day MADD 28 people per day 2010

Christchurch, New Zealand Number of Graffiti Sites FY 2002 to FY 2010

Newcastle, UK Nov 08 – Jan 09 8. 5 Revised 9 Nov 2007 Source: Connexions Tyne and Wear, UK

PERFORMANCE ACCOUNTABILITY

“All Performance Measures that have ever existed for any service in the history of the universe involve answering two sets of interlocking questions. ”

Service Performance Measures Quantity Quality How Muc h How Well did we do? ( # ) did we do it? ( % )

Performance Measures Effort How hard did we try? Effect Is anyone better off?

Service Performance Measures Effort How Well Muc h Effect

Output Input Effect Effort Service Performance Measures Quantity Quality How much service did we deliver? How well did we deliver it? How much What quality change / effect of change / did we effect produce? did we produce?

Service Performance Measures Effect Effort Quantity How much did we do? Quality How well did we do it? Is anyone better off? # %

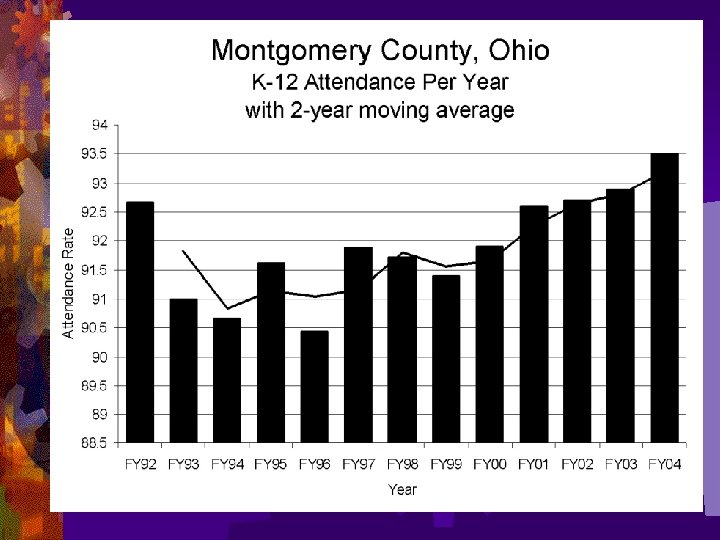
Effect Effort Education Quantity Quality How much did we do? How well did we do it? Number of students Studentteacher ratio Is anyone better off? Number of 16 olds with 5 A to C GCSE’s Percent of 16 yr olds with 5 A to C GCSE’s Number with good school attendance Percent with good school attendance

Effect Effort Drug/Alcohol Treatment Program Quantity Quality How much did we do? How well did we do it? Number of persons treated Percent of staff with training/ certification Is anyone better off? Number of clients off of alcohol & drugs - at exit Percent of clients off of alcohol & drugs - at exit - 12 months after

Effect Effort Waste Management Services Quantity Quality How much did we do? How well did we do it? # tonnes of residential waste Unit cost per tonne collected Is anyone better off? #/amt to land fill % to land fill #/amt diverted from landfill % diverted from landfill

Effect Effort Fire Department Quantity Quality How much did we do? How well did we do it? Number of responses Response Time Is anyone better off? # of fires % of fires kept to room of origin

Effect Effort Not All Performance Measures Are Created Equal Quality Quantity How much did we do? How well did we do it? Least Also Very Important Is anyone better off? Most Important

Effect Effort The Matter of Control Quantity Quality How much did we do? How well did we do it? Most Control Is anyone better off? Least Control PARTNERSH

Performance Accountability Types of Measures found in each Quadrant How much did we How well did we do it? do? # Clients/custome rs # Activities (by served type of activity) # # fully trained, % clients seen in their own language, worker safety, unit cost % Activity-specific measures e. g. % timely, % clients completing activity, % correct and complete, % meeting standard Is anyone better off? % Skills / # # % Common e. g. client staff ratio, workload ratio, staff measures turnover rate, staff morale, % staff Point in Time vs. 2 Point Comparison # Knowledge % Attitude / (e. g. parenting skills) Opinion % Behavior (e. g. toward drugs) % (e. g. school attendance) % Circumstance (e. g. working, in stable housing)

Service: School Hospital Job Training Fire Department _________________ How much did we do? Primary persons patients students # customers trained Primary activity hours of diagnostic alarms # job courses instruction tests responded to How well did we do it? Unit cost Workload ratio % of ___x___ that happen on time Is anyone better If your service works really well, off? how are your customer's better off? # students who persons who patients who % fires kept to graduate get jobs fully recover room of origin

Primary v. Secondary Direct v. Indirect Internal v. External LR UR Baseline & Story

Watermain Breaks per year London Ontario

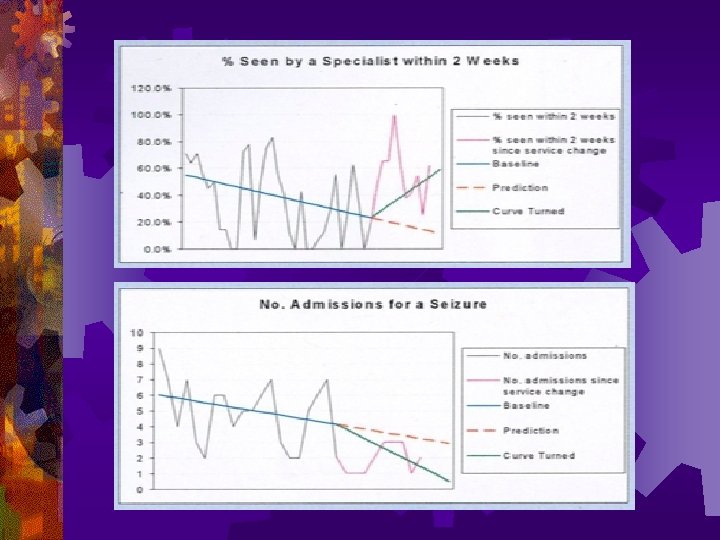
Advanced Baseline Display Create targets only when they are: FAIR & USEFUL Aspiration NOT Punishment Goal (line) Target or Standard Avoid publicly declaring targets by year if possible. ● x Your Baseline Comparison Baseline Instead: Count anything better than baseline as progress.

How Population & Performance Accountability FIT TOGETHER

THE LINKAGE Between POPULATION and PERFORMANCE POPULATION ACCOUNTABILITY POPULATION Healthy Births OUTCOMES Rate of low birth-weight babies Children Ready for School Percent fully ready per K-entry assessment Self-sufficient Families Percent of parents earning a living wage PERFORMANCE ACCOUNTABILITY Job Training Program # persons receiving training Unit cost person trained # who get living wage jobs % who get living wage jobs CUSTOMER OUTCOMES Contributio n relationship Alignment of measures Appropriate responsibili ty

Different Kinds of Progress 1. Data a. Population indicators Actual turned curves: movement for the better away from the b. Service performance measures: baseline. customer progress and better service: How much did we do? How well did we do it? Is anyone better off? 2. Accomplishments: Positive activities, not included above. 3. Anecdotes: Stories behind the statistics that show individuals are better off.

Board of Directors Meeting AGENDA 1. New data 2. New story behind the curves 3. New partners 4. New information on what works. 5. New information on financing 6. Changes to action plan and budget 7. Adjourn

SUMMARY

OBA in a Nutshell 2 – 3 - 7 2 - kinds of plus language accountability discipline Population Outcomes & accountability Indicators Performance kinds of performance measures. accountability measures How much did we do? 3 - How well did we do it? Is anyone better off? 7 - questions from ends to means in less than an hour. Baselines and Turning the Curve

“If I include you, you will be my partner. If I exclude you, you will be my judge. ” - Rosell


Turn the Curve Exercise POPULATION

Creating a Working Baseline from Group Knowledge Indicator or Performance Measure 65% ng Forecasti ng Backcasti Now Not OK?

Turn the Curve Exercise: Population Well-being 5 min: Starting Points - timekeeper and reporter - geographic area - two hats (yours plus partner’s) 10 min: Baseline - pick an outcome, and an indicator curve to turn - forecast to 2017 – OK or not OK? 15 min: Story behind the baseline - causes/forces at work - information & research agenda part 1 - causes Two pointers 15 min: What works? (What would it take? ) to action - what could work to do better? - each partners contribution - no-cost / low-cost ideas - information & research agenda part 2 – what works 10 min: Report convert notes to one page

4. ----- Off the Wall ONE PAGE Turn the Curve Report: Population Outcome: ________ Indicator Baseline Indicator (Lay Definition) Story behind the baseline --------------------------- (List as many as needed) Partners --------------------------- (List as many as needed) Three Best Ideas – What Works 1. ------------- 2. -------------- Sharp Edges 3. -----No-cost / low-cost 4. ----- Off the Wall

Turn the Curve Exercise – Lessons Talk to Action in an hour 1. How was this different from other processes? What worked and what didn’t work? 2. Why did we ask for: a. Results before indicators? b. Forecast? c. Story? d. No cost / low cost? e. Two hats? f. Crazy idea? g. Only 3 best ideas? 3. Do you think a lay audience could understand the reports? 4. How many think you could lead this exercise with a small group? (2+ curves at the same time)

Resources www. raguide. org www. resultsaccountability. com RBA Facebook Group Book - DVD Orders amazon. com resultsleadership. org

“If you do what you always did, you will get what you always got. ” Kenneth W. Jenkins President, Yonkers NY NAACP

THANK YOU ! Websites raguide. org resultsaccountability. com ----Book - DVD Orders-------amazon. com resultsleadership. org
- Slides: 66