Out of Control Action Plans 1 2 ProbAll


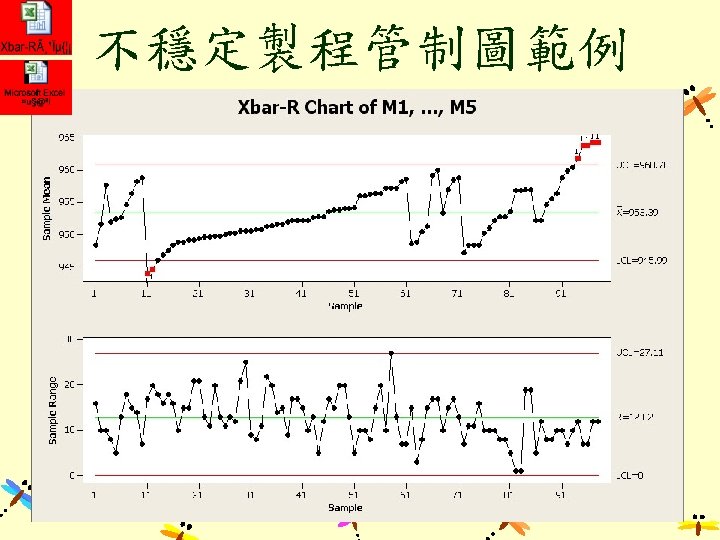
Out of Control Action Plans 製程失控行動計畫
=0. 59=0. 001953 X-bar LCL s Prob(Z>3)=0. 00135 狀況 #2")
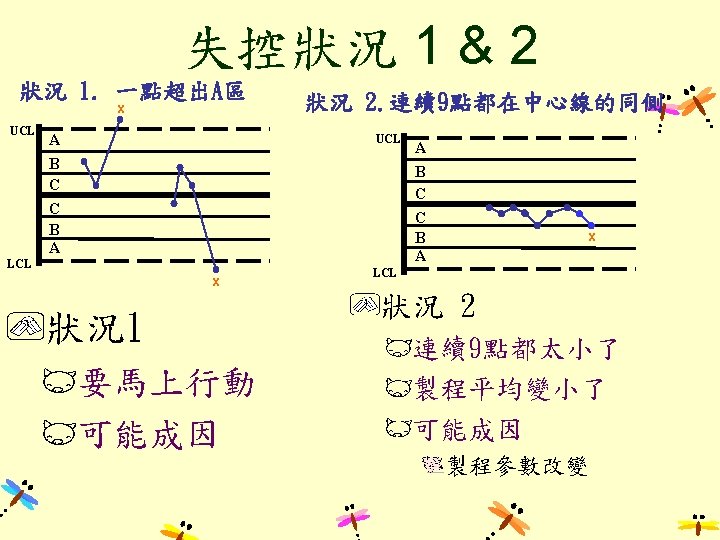
圖解失控狀況1及 2 Prob(All 9 Xi<Mean)=0. 59=0. 001953 X-bar LCL s Prob(Z>3)=0. 00135 狀況 #2 s UCL 狀況 #1 s s
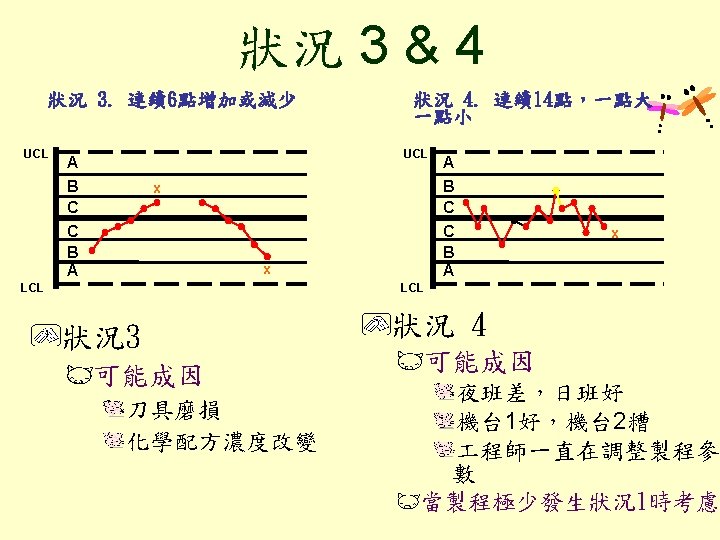

圖解狀況 3 X-bar 狀況 #3 LCL s UCL s s s

圖解狀況 4 X-bar 狀況 #4 LCL s UCL s s s
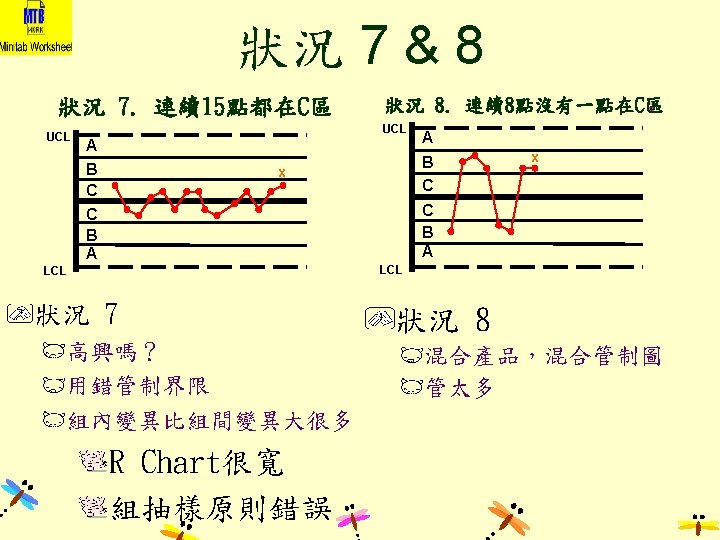

圖解狀況 7 & 8 back X-bar 狀況 #7 狀況 #8 LCL s UCL s s s

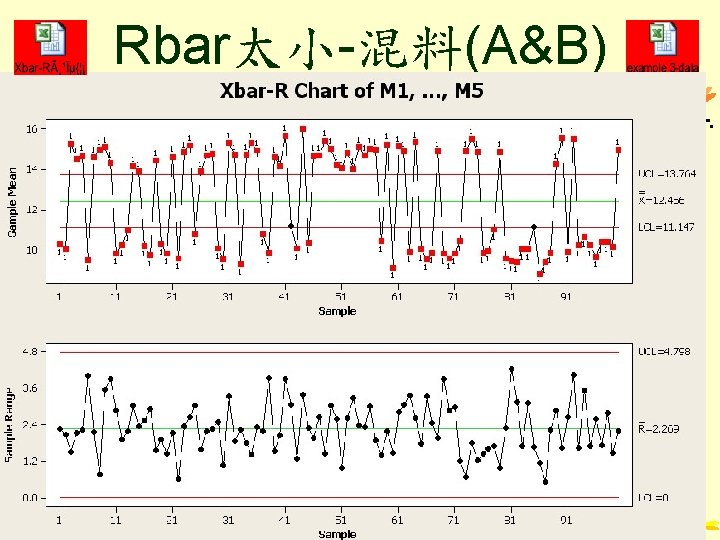
Rbar太大
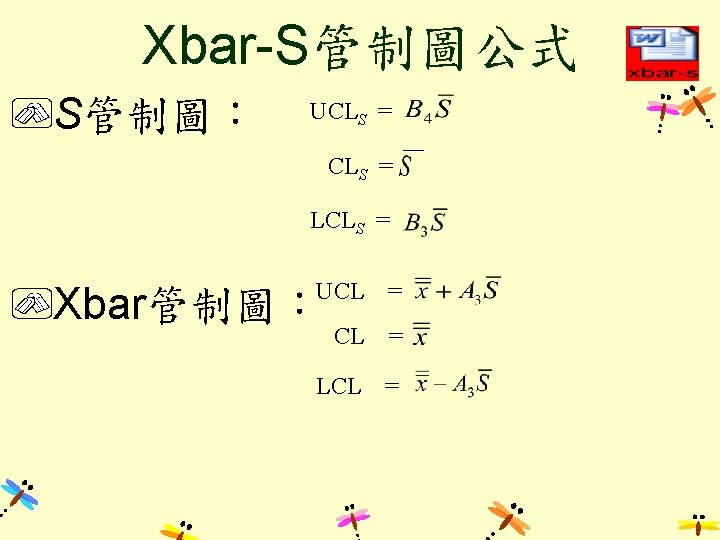

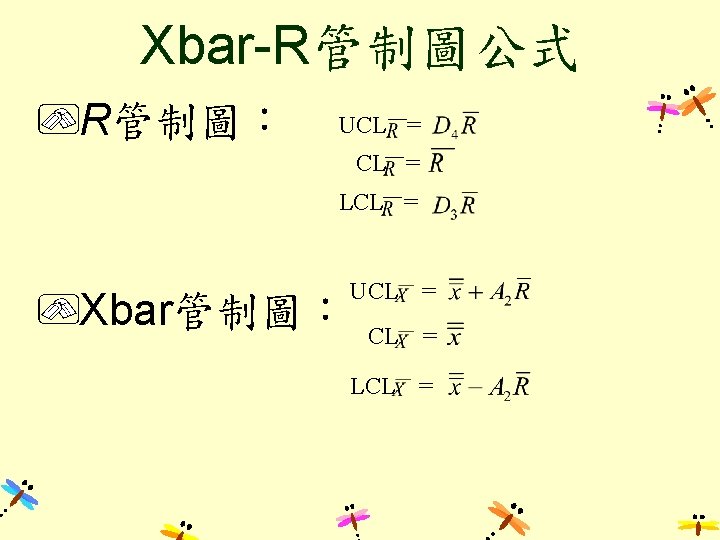
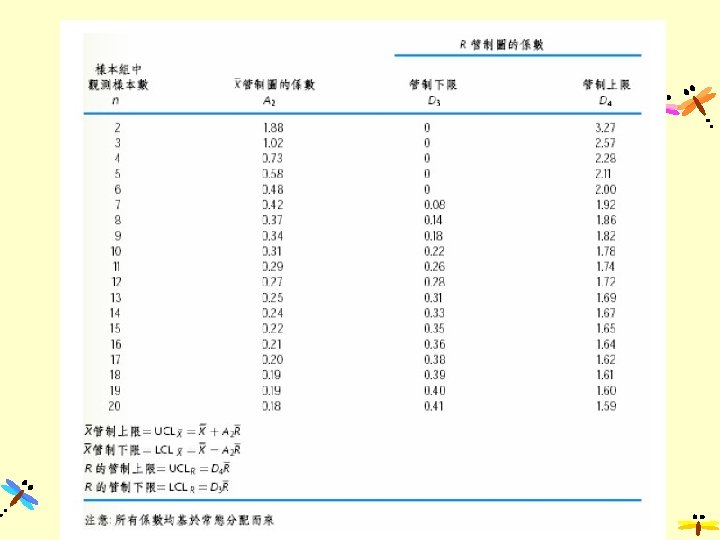
BP-Xbar R管制圖 用錯PPS
 OSAPs(Out of Spec. Action Plans)")
TSMC-Control Chart OCAPs (Out of Control Action Plans) OSAPs(Out of Spec. Action Plans)

I-MR管制圖 n=1 I-individual MR-moving range MRi=Ixi-xi-1 I 有一點OOC STAT→ Control Charts →Variable Charts for Individuals →I-MR

Attribute Control Chart 不連續管制圖

不連續管制圖分類 Defective Data Package does/does not leak Lamp does/does not light Go/no-go gauge data p and np charts 樣本數相同-p or np chart都可以 樣本數不同-只能用p chart Defect Data Bubbles in a windshield Paint flaws on a casing Errors on an invoice Bad die on a wafer C chart(缺點數管制圖) & u chart(單位缺點數管 制圖) 樣本數相同-c or u chart都可以 樣本數不同-只能用u chart
")
p 管制圖 Subgroup size Subgroups are usually quite large (50 to 200 or more!) Ideally, each subgroup should have at least 5 nonconforming units Minimum: 90% of the subgroups must have at least one non-conforming unit Subgroup sizes need not be constant, but should be within ± 25% of the mean subgroup size The lower the number of non-conforming units, the larger the required subgroup size In general, attribute charts need much larger subgroup sizes than the equivalent variable charts

p 管制圖 LCL When the mean proportion defective is small, the LCL can be a negative number. In this case there is no LCL and p=0 is still within the control limits It is advantageous to pick a subgroup size that establishes a lower control limit. This way improvements can also be detected

p 管制圖-example A plastic molding plant manufactures two-liter plastic bottles for the soft drink industry A common failure mode of the molding process is pinholes in the bottles that will cause long-term seepage. The bottles can be pressure tested for leakage. The test is destructive. A number of bottles from each lot of plastic are tested for leaks and the number of rejects are recorded Construct a p-chart of the defective bottles and evaluate whether the process is in control.

c chart- example Each month, 100 invoices are audited and the total number of mistakes is recorded. In a molding process, there is a problem with pinholes in plastic bottles. Each day, a number of bottles are examined and the number of pinholes are recorded.

SPC-Charts For All Occasions Variable Data? % Defective or Defects? No Yes Rational Subgroups? % Defective No No X-bar & R chart Constant Sample Size? I & MR chart Yes Subgroup Size >8? Defects Yes No Easy to Compute sigma? Yes X-bar & S chart No Constant Sample Size? Yes No p-chart u-chart np- or p-chart c- or u-chart

Demerit Control Chart When several less severe or minor defects can occur, we may need some system for classifying nonconformities or defects according to severity; or to weigh various types of defects in some reasonable manner.

Demerit Systems 1. 2. 3. 4. Class A Defects - very serious Class B Defects - serious Class C Defects - Moderately serious Class D Defects - Minor Let ci. A, ci. B, ci. C, and ci. D represent the number of units in each of the four classes.

Demerit Systems The following weights are fairly popular in practice: Class A-100, Class B - 50, Class C – 10, Class D – 1 di = 100 ci. A + 50 ci. B + 10 ci. C + ci. D di - the number of demerits in an inspection unit

~THE END~ ~ To Be Continued~
- Slides: 39