
Our Resources Our Schools V 2 PrincipalToCommunity Budget
Our Resources Our Schools V. 2 Principal-To-Community Budget Engagement 1
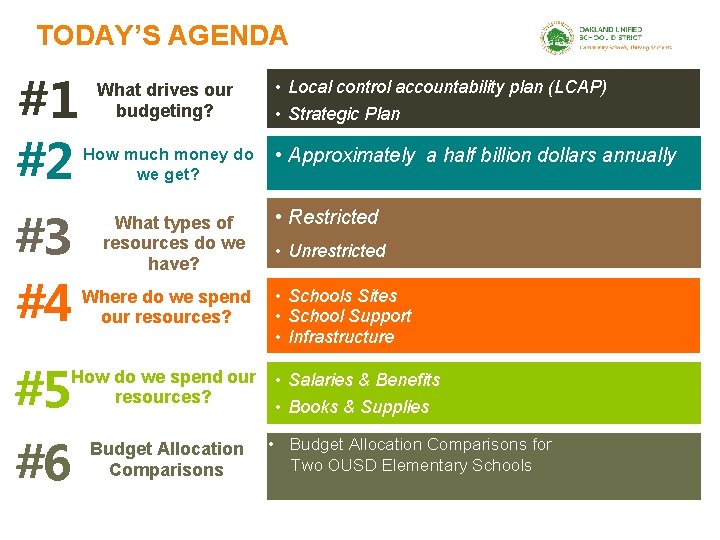
TODAY’S AGENDA #1 #2 #3 #4 What drives our budgeting? How much money do we get? What types of resources do we have? Where do we spend our resources? #5 How do we spend our resources? #6 Budget Allocation Comparisons • Local control accountability plan (LCAP) • Strategic Plan • Approximately a half billion dollars annually • Restricted • Unrestricted • Schools Sites • School Support • Infrastructure • Salaries & Benefits • Books & Supplies • Budget Allocation Comparisons for Two OUSD Elementary Schools 2
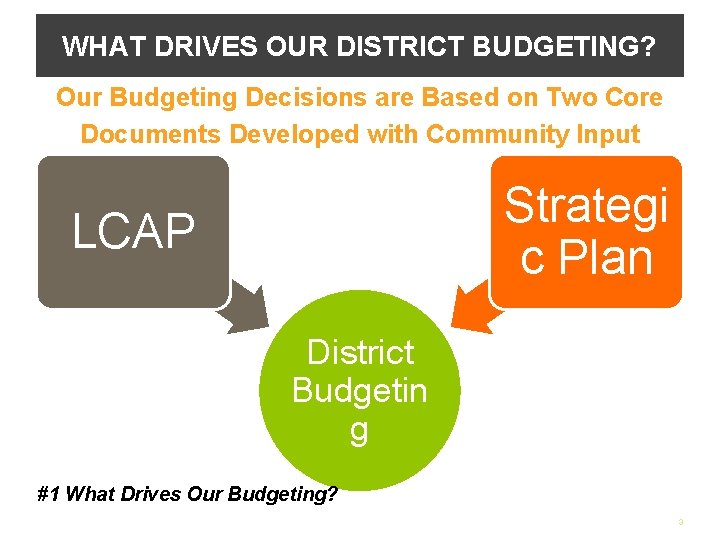
WHAT DRIVES OUR DISTRICT BUDGETING? Our Budgeting Decisions are Based on Two Core Documents Developed with Community Input Strategi c Plan LCAP District Budgetin g #1 What Drives Our Budgeting? 3
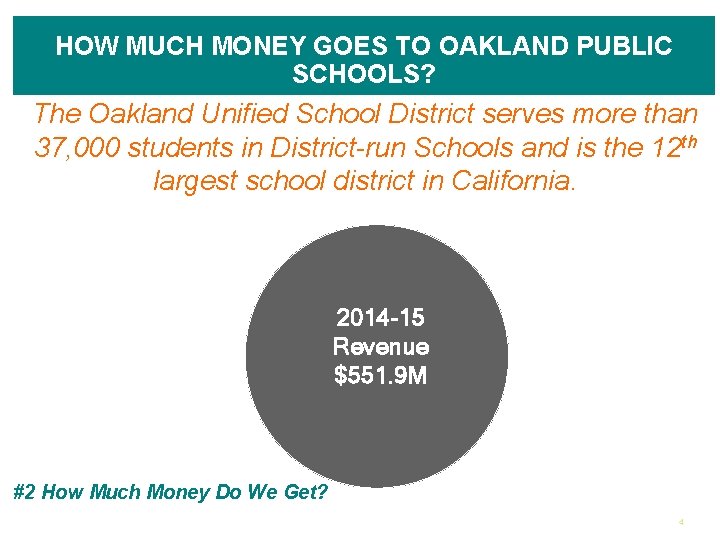
HOW MUCH MONEY GOES TO OAKLAND PUBLIC SCHOOLS? The Oakland Unified School District serves more than 37, 000 students in District-run Schools and is the 12 th largest school district in California. 2014 -15 Revenue $551. 9 M #2 How Much Money Do We Get? 4

OUR DISTRICT IS FUNDED BY TWO TYPES OF RESOURCES Restricted Unrestricted What is it: Money for Oakland to spend for any educational purpose Informed by: The local control accountability plan (LCAP) Examples: State Local Control Funding Formula (LCFF), lottery funds, lease income, interest Income What is it: Money for a particular educational purpose Informed by: The rules and requirements of the funder Example: School construction bonds, school nutrition, special education, private donations, federal funds (Title I) #3 What Types of Resources Do We Have? 5
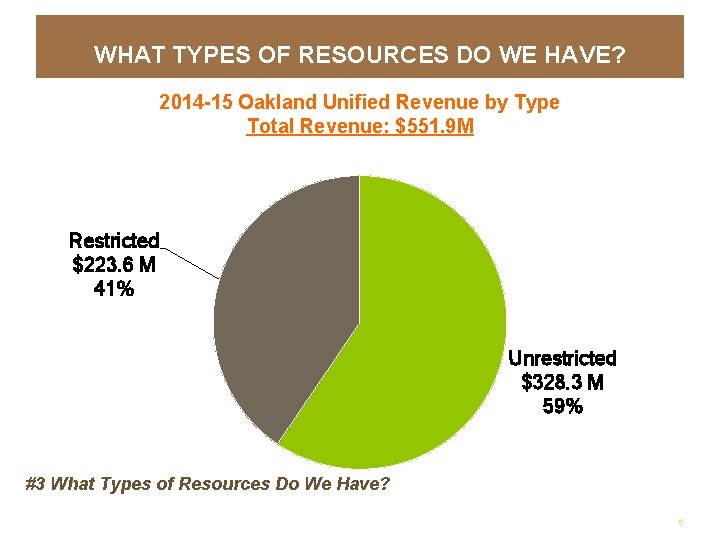
WHAT TYPES OF RESOURCES DO WE HAVE? 2014 -15 Oakland Unified Revenue by Type Total Revenue: $551. 9 M Restricted $223. 6 M 41% Unrestricted $328. 3 M 59% #3 What Types of Resources Do We Have? 6
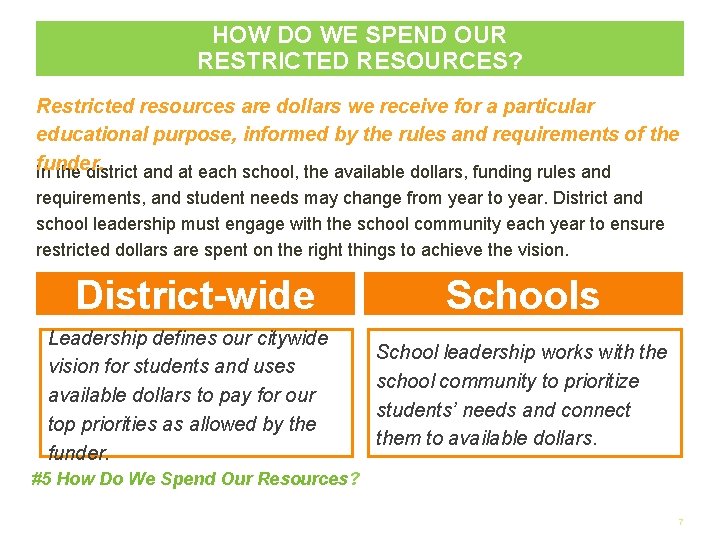
HOW DO WE SPEND OUR RESTRICTED RESOURCES? Restricted resources are dollars we receive for a particular educational purpose, informed by the rules and requirements of the funder. In the district and at each school, the available dollars, funding rules and requirements, and student needs may change from year to year. District and school leadership must engage with the school community each year to ensure restricted dollars are spent on the right things to achieve the vision. District-wide Leadership defines our citywide vision for students and uses available dollars to pay for our top priorities as allowed by the funder. Schools School leadership works with the school community to prioritize students’ needs and connect them to available dollars. #5 How Do We Spend Our Resources? 7
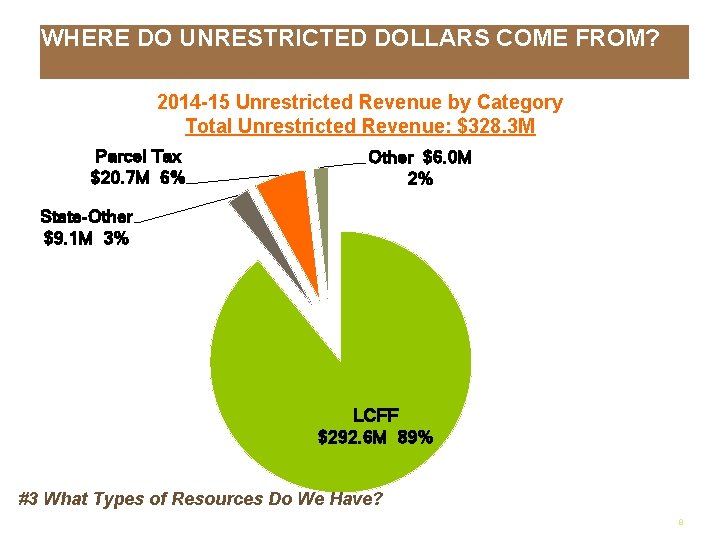
WHERE DO UNRESTRICTED DOLLARS COME FROM? 2014 -15 Unrestricted Revenue by Category Total Unrestricted Revenue: $328. 3 M Parcel Tax $20. 7 M 6% Other $6. 0 M 2% State-Other $9. 1 M 3% LCFF $292. 6 M 89% #3 What Types of Resources Do We Have? 8
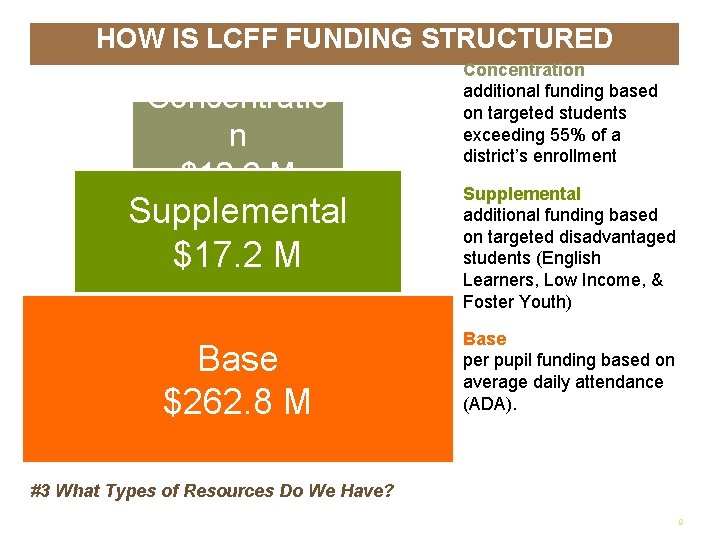
HOW IS LCFF FUNDING STRUCTURED Concentratio n $12. 6 M Supplemental $17. 2 M Base $262. 8 M Concentration additional funding based on targeted students exceeding 55% of a district’s enrollment Supplemental additional funding based on targeted disadvantaged students (English Learners, Low Income, & Foster Youth) Base per pupil funding based on average daily attendance (ADA). #3 What Types of Resources Do We Have? 9
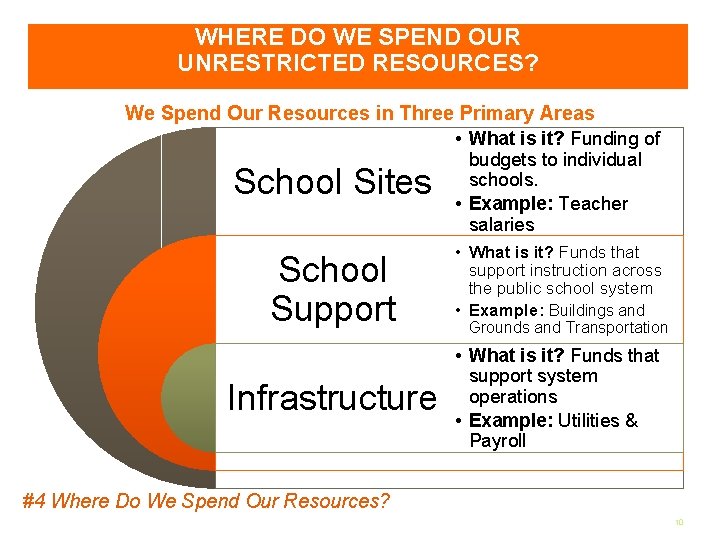
WHERE DO WE SPEND OUR UNRESTRICTED RESOURCES? We Spend Our Resources in Three Primary Areas • What is it? Funding of School Sites budgets to individual schools. • Example: Teacher salaries School Support • What is it? Funds that support instruction across the public school system • Example: Buildings and Infrastructure • What is it? Funds that support system operations • Example: Utilities & Payroll Grounds and Transportation #4 Where Do We Spend Our Resources? 10
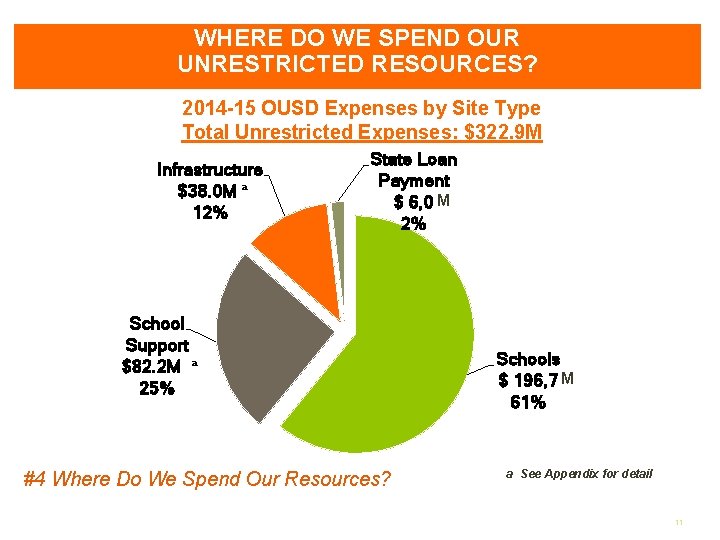
WHERE DO WE SPEND OUR UNRESTRICTED RESOURCES? 2014 -15 OUSD Expenses by Site Type Total Unrestricted Expenses: $322. 9 M Infrastructure $38. 0 M ª 12% State Loan Payment $ 6, 0 M 2% School Support $82. 2 M ª 25% #4 Where Do We Spend Our Resources? Schools $ 196, 7 M 61% a See Appendix for detail 11
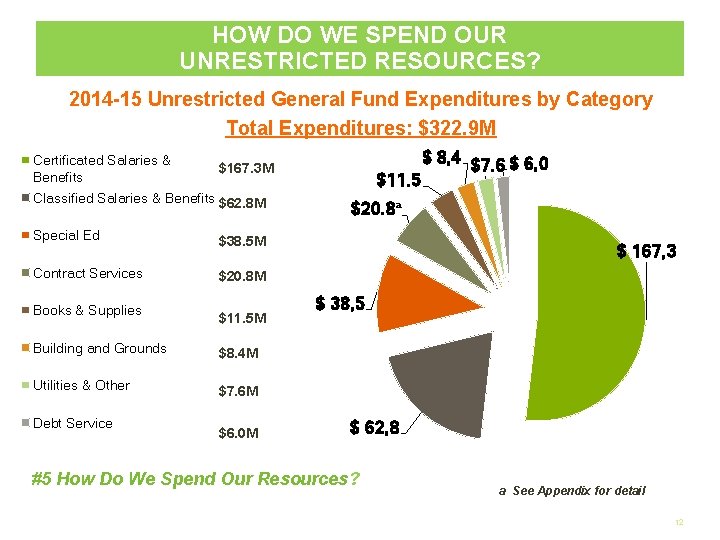
HOW DO WE SPEND OUR UNRESTRICTED RESOURCES? 2014 -15 Unrestricted General Fund Expenditures by Category Total Expenditures: $322. 9 M Certificated Salaries & $167. 3 M Benefits Classified Salaries & Benefits $62. 8 M Special Ed $38. 5 M Contract Services $20. 8 M Books & Supplies $11. 5 M Building and Grounds $8. 4 M Utilities & Other $7. 6 M Debt Service $6. 0 M $11. 5 $ 8, 4 $7. 6 $ 6, 0 $20. 8ª $ 167, 3 $ 38, 5 $ 62, 8 #5 How Do We Spend Our Resources? a See Appendix for detail 12
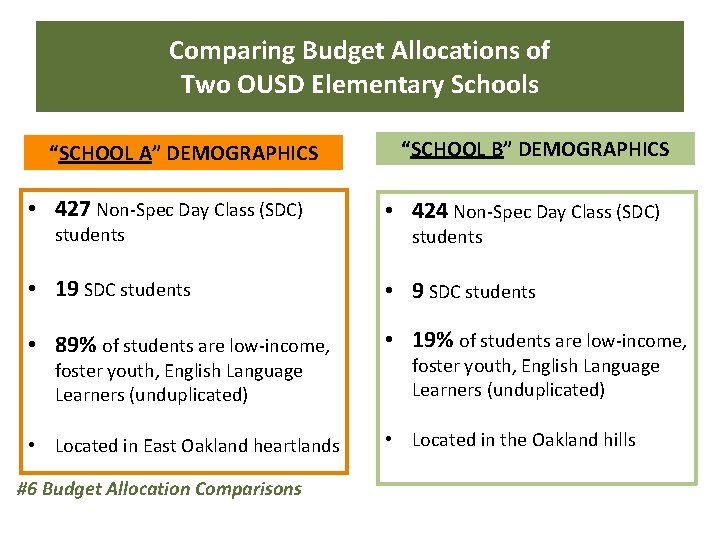
Comparing Budget Allocations of Two OUSD Elementary Schools “SCHOOL A” DEMOGRAPHICS • 427 Non-Spec Day Class (SDC) students “SCHOOL B” DEMOGRAPHICS • 424 Non-Spec Day Class (SDC) students • 19 SDC students • 89% of students are low-income, • 19% of students are low-income, • Located in East Oakland heartlands • Located in the Oakland hills foster youth, English Language Learners (unduplicated) #6 Budget Allocation Comparisons 13

Comparing Budget Allocations of Two OUSD Elementary Schools “School A” Staff & Discretionary Base Budget Allocation “School B” Staff & Discretionary Base Budget Allocation • 17. 8 Certificated Positions (includes Principal, classroom teachers) • 2. 5 Classified Positions (includes general front office staff, attendance staff, and noon supervision) • $175 per student base discretionary funding = $78, 050 • $175 per student base discretionary funding = $75, 775 #6 Budget Allocation Comparisons 14

Comparing Budget Allocations of Two OUSD Elementary Schools District-wide Student: Teacher ratio targets by grade level Grade Span TK/K 1 st 2 nd -3 rd Student: Teacher ratio 24: 1 27: 1 4 th-5 th 6 th-12 th 31: 1 32: 1 Note: Each elementary school has a specific school-wide student: teacher ratio target under the Local Control Funding Formula (LCFF). Some sites’ targets vary from the district-wide targets, but no site targets exceed district-wide targets. District-wide Classified Staff allocations formula by school type and size Discretionary Dollars per Student ELEMENTARY SCHOOL $ 175 MIDDLE SCHOOL HIGH SCHOOL $ 225 $ 300 K-8 SCHOOL $ 200 6 -12 SCHOOL $ 263 #6 Budget Allocation Comparisons 15
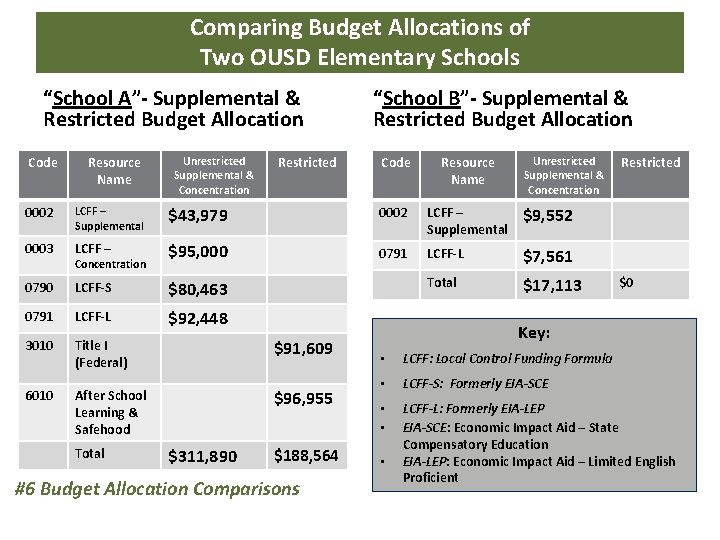
Comparing Budget Allocations of Two OUSD Elementary Schools “School A”- Supplemental & Restricted Budget Allocation Code Resource Name Unrestricted Supplemental & Concentration Restricted “School B”- Supplemental & Restricted Budget Allocation Code Resource Name Unrestricted Supplemental & Concentration 0002 LCFF – Supplemental $43, 979 0002 LCFF – Supplemental $9, 552 0003 LCFF – $95, 000 0791 LCFF-L $7, 561 0790 LCFF-S $80, 463 Total $17, 113 0791 LCFF-L $92, 448 3010 Title I (Federal) 6010 After School Learning & Safehood Concentration Total $91, 609 $96, 955 $311, 890 $188, 564 #6 Budget Allocation Comparisons Restricted $0 Key: • LCFF: Local Control Funding Formula • LCFF-S: Formerly EIA-SCE • • LCFF-L: Formerly EIA-LEP EIA-SCE: Economic Impact Aid – State Compensatory Education EIA-LEP: Economic Impact Aid – Limited English Proficient • 16
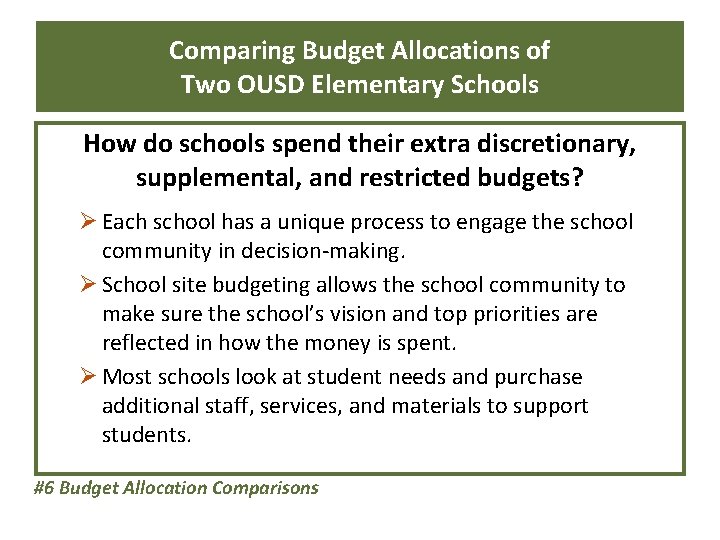
Comparing Budget Allocations of Two OUSD Elementary Schools How do schools spend their extra discretionary, supplemental, and restricted budgets? Ø Each school has a unique process to engage the school community in decision-making. Ø School site budgeting allows the school community to make sure the school’s vision and top priorities are reflected in how the money is spent. Ø Most schools look at student needs and purchase additional staff, services, and materials to support students. #6 Budget Allocation Comparisons 17

Appendix 18
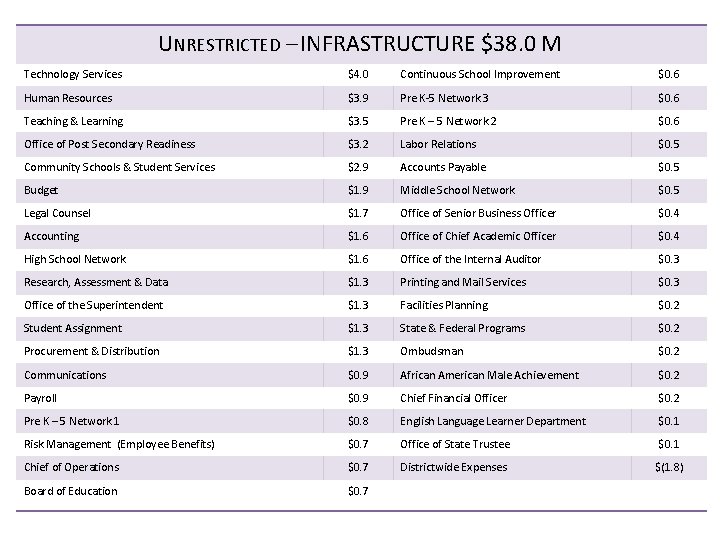
UNRESTRICTED – INFRASTRUCTURE $38. 0 M Technology Services $4. 0 Continuous School Improvement $0. 6 Human Resources $3. 9 Pre K-5 Network 3 $0. 6 Teaching & Learning $3. 5 Pre K – 5 Network 2 $0. 6 Office of Post Secondary Readiness $3. 2 Labor Relations $0. 5 Community Schools & Student Services $2. 9 Accounts Payable $0. 5 Budget $1. 9 Middle School Network $0. 5 Legal Counsel $1. 7 Office of Senior Business Officer $0. 4 Accounting $1. 6 Office of Chief Academic Officer $0. 4 High School Network $1. 6 Office of the Internal Auditor $0. 3 Research, Assessment & Data $1. 3 Printing and Mail Services $0. 3 Office of the Superintendent $1. 3 Facilities Planning $0. 2 Student Assignment $1. 3 State & Federal Programs $0. 2 Procurement & Distribution $1. 3 Ombudsman $0. 2 Communications $0. 9 African American Male Achievement $0. 2 Payroll $0. 9 Chief Financial Officer $0. 2 Pre K – 5 Network 1 $0. 8 English Language Learner Department $0. 1 Risk Management (Employee Benefits) $0. 7 Office of State Trustee $0. 1 Chief of Operations $0. 7 Districtwide Expenses $(1. 8) Board of Education $0. 7
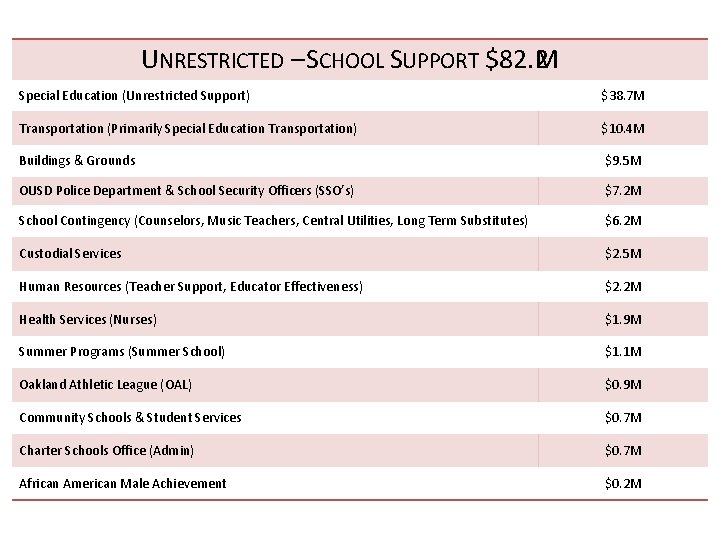
UNRESTRICTED – SCHOOL SUPPORT $82. 2 M Special Education (Unrestricted Support) $38. 7 M Transportation (Primarily Special Education Transportation) $10. 4 M Buildings & Grounds $9. 5 M OUSD Police Department & School Security Officers (SSO’s) $7. 2 M School Contingency (Counselors, Music Teachers, Central Utilities, Long Term Substitutes) $6. 2 M Custodial Services $2. 5 M Human Resources (Teacher Support, Educator Effectiveness) $2. 2 M Health Services (Nurses) $1. 9 M Summer Programs (Summer School) $1. 1 M Oakland Athletic League (OAL) $0. 9 M Community Schools & Student Services $0. 7 M Charter Schools Office (Admin) $0. 7 M African American Male Achievement $0. 2 M
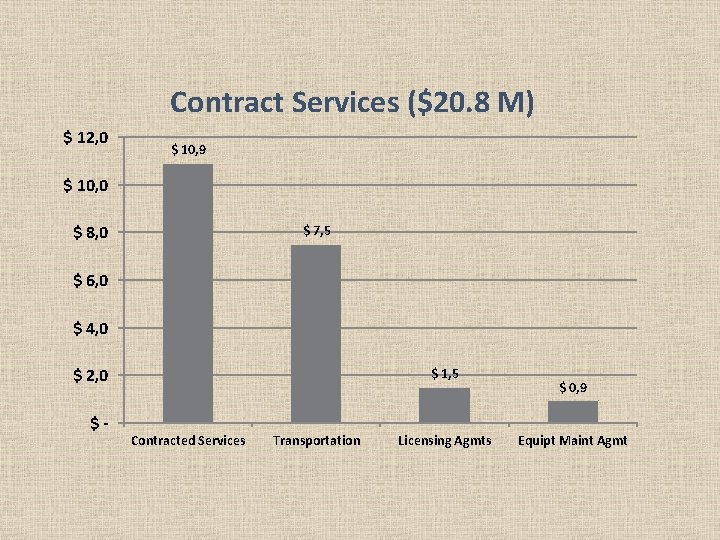
Contract Services ($20. 8 M) $ 12, 0 $ 10, 9 $ 10, 0 $ 8, 0 $ 7, 5 $ 6, 0 $ 4, 0 $ 2, 0 $- $ 1, 5 Contracted Services Transportation Licensing Agmts $ 0, 9 Equipt Maint Agmt
- Slides: 21