Oregon Guided Pathways Redesigning the College Experience for


 Mapping Pathways to Student End")

 2) 3) What is our students’ experience with career/college exploration, planning")


 2) 3) What is our students’ experience with career/college exploration, planning")

- Slides: 30
Oregon Guided Pathways Redesigning the College Experience for Student Success Davis Jenkins Community College Research Center Teachers College, Columbia University Oregon Pathways Institute May 10, 2018
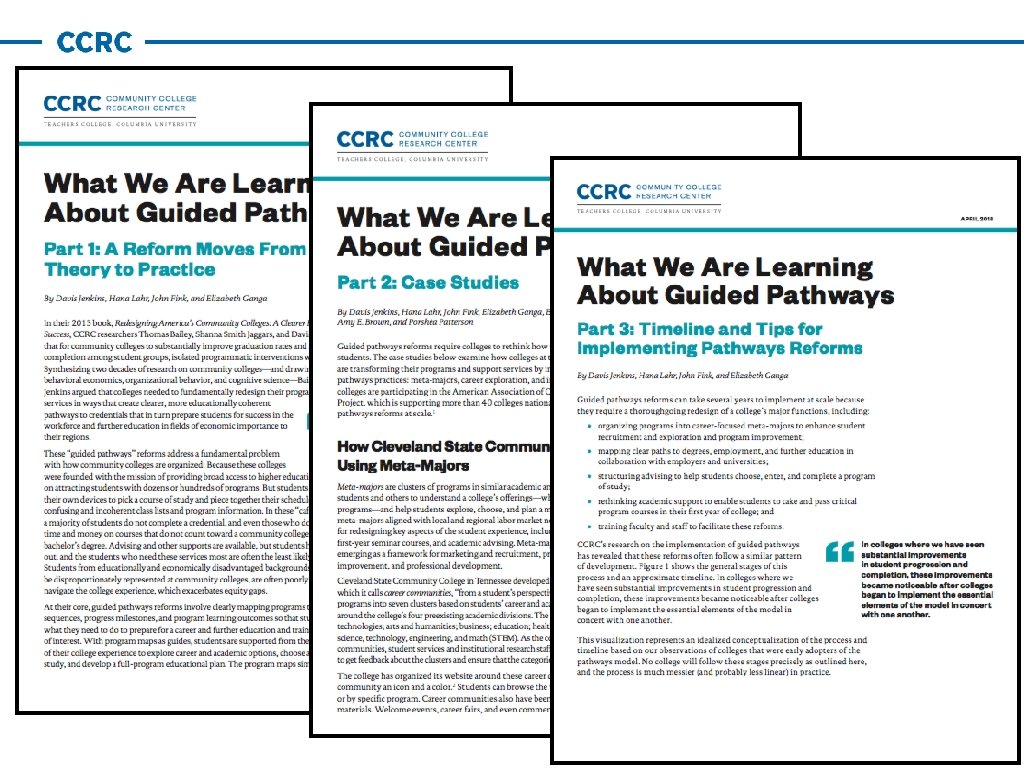
A National Movement: Colleges Implementing Guided Pathways
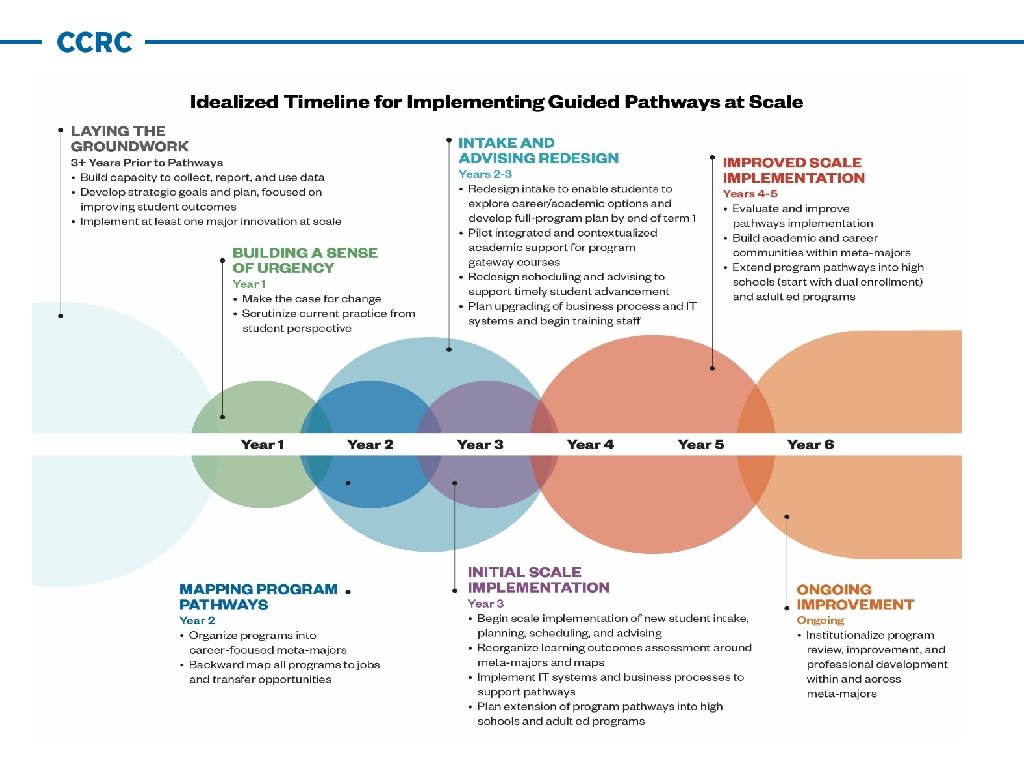
Essential Pathways Practices • Organize programs into “meta-majors, ” map programs to career-path jobs and transfer in majors • Help all students explore career/academic options and develop a full-program plan by end of term 1 • Make schedules and monitor progress based on students’ plans • Integrate and contextualize academic support into college program gateway courses, starting with math and English • Integrate active/experiential learning into every program • Build pathways into high schools, starting with dual enrollment
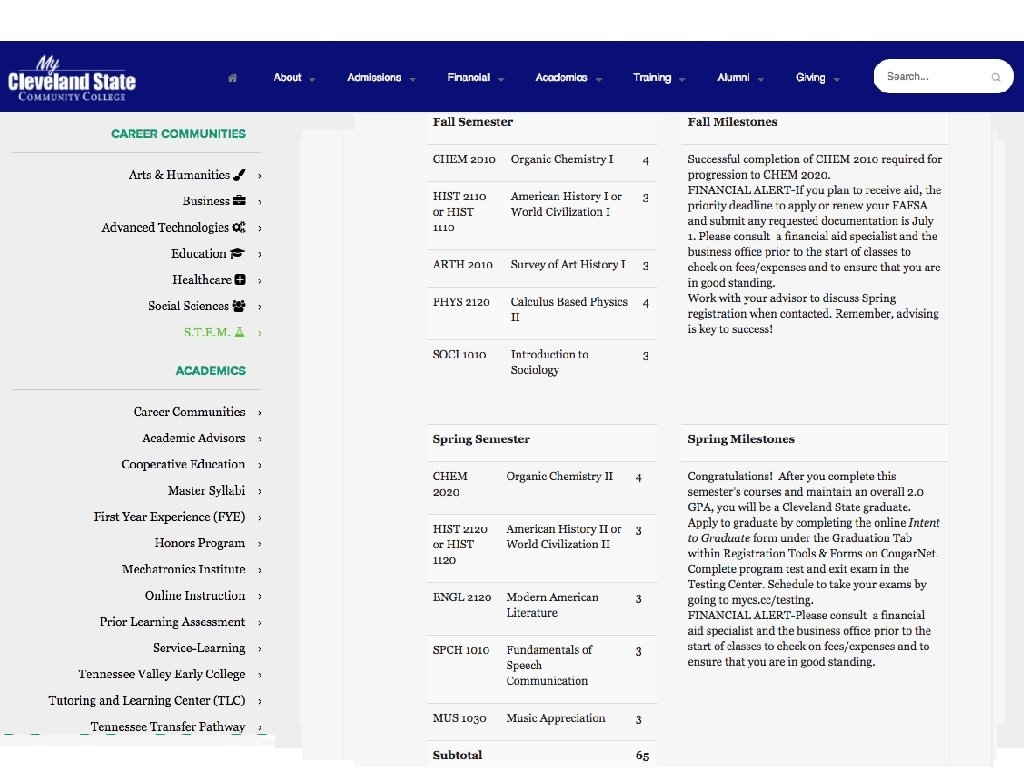
COMMUNITY COLLEGE RESEARCH CENTER Guided Pathways Practice Areas 1) Mapping Pathways to Student End Goals 2) Helping Students Choose and Enter a Path 3) Keeping Students on the Path 4) Ensuring that Students are Learning
COMMUNITY COLLEGE RESEARCH CENTER Guided Pathways Scale of Adoption
Guiding Questions 1) 2) 3) What is our students’ experience with career/college exploration, planning and progress monitoring currently? How would we like to see our students’ experience on these fronts change? What do we have to do to change it?
How do we know if guided pathways reforms are working?
Early Momentum Matters
Early Momentum Metrics • Credit momentum – % of FTEIC students who attempt 15/30 credits in one term/year • Gatekeeper momentum – % of FTEIC students who pass college-level English/math (or both) in one year • Program momentum – % of FTEIC students who pass at least 9 college-credit hours in the student’s field of study in one year
Early Momentum Mindsets • Credit momentum: • • Gatekeeper momentum: • • • From current semester schedule to full-program plan From full-time vs. part-time to “on-plan” vs. “off-plan From scheduling available courses to scheduling plan courses From academic assessment to holistic assessment From pre-requisite remediation to co-requisite support Program momentum: • • • From job/transfer help for near completers to career exploration and planning from the start From gen ed to meta-majors From math and English gateways to critical program courses
Early Adopters 13 Tennessee Community Colleges
Tennessee Essential Completion Practices: Scale of Adoption Assessment • SOAA distributed to colleges in fall 2017 • CCRC conducted follow-up calls in January 2018 • Send comments to CCRC on the Scale of Adoption report by April 13, 2018
Essential Completion Practices Scale of Adoption Assessment: Summary of Responses by TBR Colleges Mapping Pathways to Student End Goals January 2018 9 1 A. All programs—including both career-technical (AAS and technical certificates) and transfer programs—are well designed to guide and prepare students to enter employment and further education in fields of importance to the college’s service area. 3 1 0 0 5 2 1 B. Detailed information is provided on the college’s website on the employment and further education opportunities targeted by each program. 2 4 At Scale 0 Implementation in Progress Planning for implementation Not systematic 5 Not Occurring 5 1 C. Programs are clearly mapped out for students. Students know which courses they should take and in what sequence. Courses critical for success in each program and other key progress milestones are clearly identified. All this information is easily acces 2 1 0 12 0 1 D. Required math courses are appropriately aligned with the student’s academic focus area. 1 0 0
Helping Students Choose and Enter a Pathway January 2018 4 2 A. Every new student is helped to explore career/college options, and to choose an academic focus area and program that best aligns with the student’s interests and aptitudes. 4 5 0 0 6 2 2 B. All students are helped to build a full-program personal degree completion plan that incorporates the following milestones in year 1: three courses in their focus area; college-level English (6 hours) and mathematics (3 hours); and a schedule with as m 3 2 0 10 2 C. Poorly prepared students are provided with co-requisite support to help them succeed in college-level math and English courses. 2 1 0 At Scale 0 Implementation in Progress Planning for implementation Not systematic 3 2 2 D. Special supports are provided to help students succeed in the “gateway” courses in each academic focus area— (in addition to college-level math and English). Not Occurring 2 6 0 7 1 2 E. Intensive support is provided to help very poorly prepared students to succeed in collegelevel courses as soon as possible (i. e. , for those students not ready for corequisite courses). 1 2 2 0 2 F. The college works with high schools and other feeders, such as the Tennessee Reconnect Communities and Veterans Affairs, to motivate and prepare students to enter college-level coursework in a program of study when they enroll in college 11 0 2 0
Accelerating College Entry College Math Taken by Students in Tennessee Community Colleges Co-Requisite Scale Implementation, Fall 2015 21% Algebra 14% 64% Source: Belfield, Jenkins, Lahr (2016) Math for Liberal Arts Probability and Statistics
Keeping Students on their Path January 2018 6 2 3 A. Advisors monitor which program every student is in and how far along the student is toward completing the program requirements. 3 2 0 8 2 3 B. Students can easily see how far they have come and what they need to do to complete their program 3 0 0 2 At Scale 4 3 C. Students receive ongoing advisement in their academic program, and advisors and students are alerted when students are at risk of falling off their program plan. The college has policies and supports in place to intervene in ways that help students get Implementation in Progress 5 Planning for implementation 1 Not systematic 1 Not Occurring 1 5 3 D. Assistance is provided to students who are unlikely to be accepted into limited-access programs, such as nursing, to redirect them to another more viable path to credentials and a career that aligns with their interests, academic progress to date, and 3 4 0 1 3 E. The college schedules courses to ensure students can take the courses they need when they need them, can plan their lives around school from one term to the next, and can complete their programs in as short a time as possible. 9 3 0 0
Ensuring that Students are Learning January 2018 10 3 4 A. Program learning outcomes are aligned with the requirements for success in the further education and employment outcomes targeted by each program. 0 0 0 3 5 4 B. Students have ample opportunity to apply and deepen knowledge and skills through projects, internships, co-ops, clinical placements, group projects outside of class, service learning, study abroad, and other TBR High Impact Practices that program facul 2 3 0 9 3 4 C. Faculty assess whether students are mastering learning outcomes and building skills across each program, in both University Parallel and career/technical programs. At Scale Scaling in Progress 1 Planning for implementation 0 Not systematic 0 Not Occurring 7 5 4 D. Results of learning outcomes assessments are used to improve teaching and learning through program review, professional development, and other intentional campus efforts 1 0 0 1 1 4 E. The college helps students document their learning for employers and universities through portfolios and other means beyond transcripts. 3 7 1
TBR CCs Credit Momentum KPIs 100% 75% 67% Earned 6+ credits in 1 st term 50% 49% 42% Earned 15+ credits in Year 1 32% 30% 25% 24% Earned 12+ credits in 1 st term 13% Earned 24+ credits in Year 1 12% Earned 30+ credits in Year 1 6% 3% 0% Fall 2010 Fall 2011 Fall 2012 Fall 2013 Fall FTEIC Cohort Source: CCRC Analysis of TBR Data Fall 2014 Fall 2015 Fall 2016
TBR CCs: Earned 24+ credits in Year 1, by Age Groups and Race 18 -19 20 -24 25+ Black 100% 80% 60% 40% Hispanic White 29% 27% 21% 20% 15% 13% 10% 6% 10% 9% 3% 0% 0% Fall 2010 Fall 2011 Fall 2012 Fall 2013 Fall FTEIC Cohort Source: CCRC Analysis of TBR Data Fall 2014 Fall 2015 Fall 2016 Fall 2010 Fall 2011 Fall 2012 Fall 2013 Fall FTEIC Cohort Fall 2014 Fall 2015 Fall 2016
TBR CCs Gateway math and English KPIs 100% 75% 63% 61% Passed college English in year 1 52% 50% 42% 43% 45% 40% 38% Passed college math in year 1 28% 25% 18% 15% Passed college English & math in year 1 0% Fall 2010 Fall 2011 Fall 2012 Fall 2013 Fall FTEIC Cohort Source: CCRC Analysis of TBR Data Fall 2014 Fall 2015 Fall 2016
TBR CCs: Passed college English in year 1, by Age Groups and Race 18 -19 20 -24 25+ Black 100% 80% Hispanic White 65% 64% 60% 57% 50% 47% 40% 55% 47% 40% 43% 40% 33% 20% 0% 0% Fall 2010 Fall 2011 Fall 2012 Fall 2013 Fall FTEIC Cohort Source: CCRC Analysis of TBR Data Fall 2014 Fall 2015 Fall 2016 22% Fall 2010 Fall 2011 Fall 2012 Fall 2013 Fall FTEIC Cohort Fall 2014 Fall 2015 Fall 2016
TBR CCs: Passed college math in year 1, by Age Groups and Race 18 -19 20 -24 25+ Black 100% 80% 60% Hispanic White 49% 47% 40% 38% 46% 40% 32% 34% 23% 22% 20% 19% 20% 10% 6% 0% 0% Fall 2010 Fall 2011 Fall 2012 Fall 2013 Fall FTEIC Cohort Source: CCRC Analysis of TBR Data Fall 2014 Fall 2015 Fall 2016 Fall 2010 Fall 2011 Fall 2012 Fall 2013 Fall FTEIC Cohort Fall 2014 Fall 2015 Fall 2016
TBR CCs Persistence and College Course Completion KPIs 100% 21 19. 4 75% Persisted from term 1 to term 2 76% 73% 71% 18 70% Credit pass rate Average Credits per Student 15 50% 14. 1 13. 7 Average college credits attempted in the first year per student 12 25% Average college credits earned in the first year per student 10. 0 9 6 0% Fall 2010 Fall 2011 Fall 2012 Fall 2013 Fall FTEIC Cohort Source: CCRC Analysis of TBR Data Fall 2014 Fall 2015 Fall 2016
Summary of Oregon Community College VFA KPI Reports Oregon Community Colleges Credit Momentum KPIs 40% Earned 15+ credits in year 1 , 36% 35% 30% 25% 20% Earned 24+ credits in year 1, 16% 17% 15% 10% Earned 30+ credits in year 1, 6% 7% 5% 0% 2010 CCRC Analysis of Oregon VFA KPI reports Cohort Year 2014
Summary of Oregon Community College VFA KPI Reports Oregon Community Colleges Gateway Course Completion KPIs 45% 40% 42% Completed college English in year 1, 38% 35% 30% 25% 20% Completed college math in year 1, 17% 18% 15% 12% 10% Completed both college math & English in year 1, 10% 5% 0% 2010 CCRC Analysis of Oregon VFA KPI reports Cohort Year 2014
Guiding Questions 1) 2) 3) What is our students’ experience with career/college exploration, planning and progress monitoring currently? How would we like to see our students’ experience on these fronts change? What do we have to do to change it?
Thank you!